
Fig. 1: Single nucleus transcriptome and chromatin accessibility of macaque cortex (Source data are provided as a Source Data file).
From: Spatially resolved gene regulatory and disease-related vulnerability map of the adult Macaque cortex
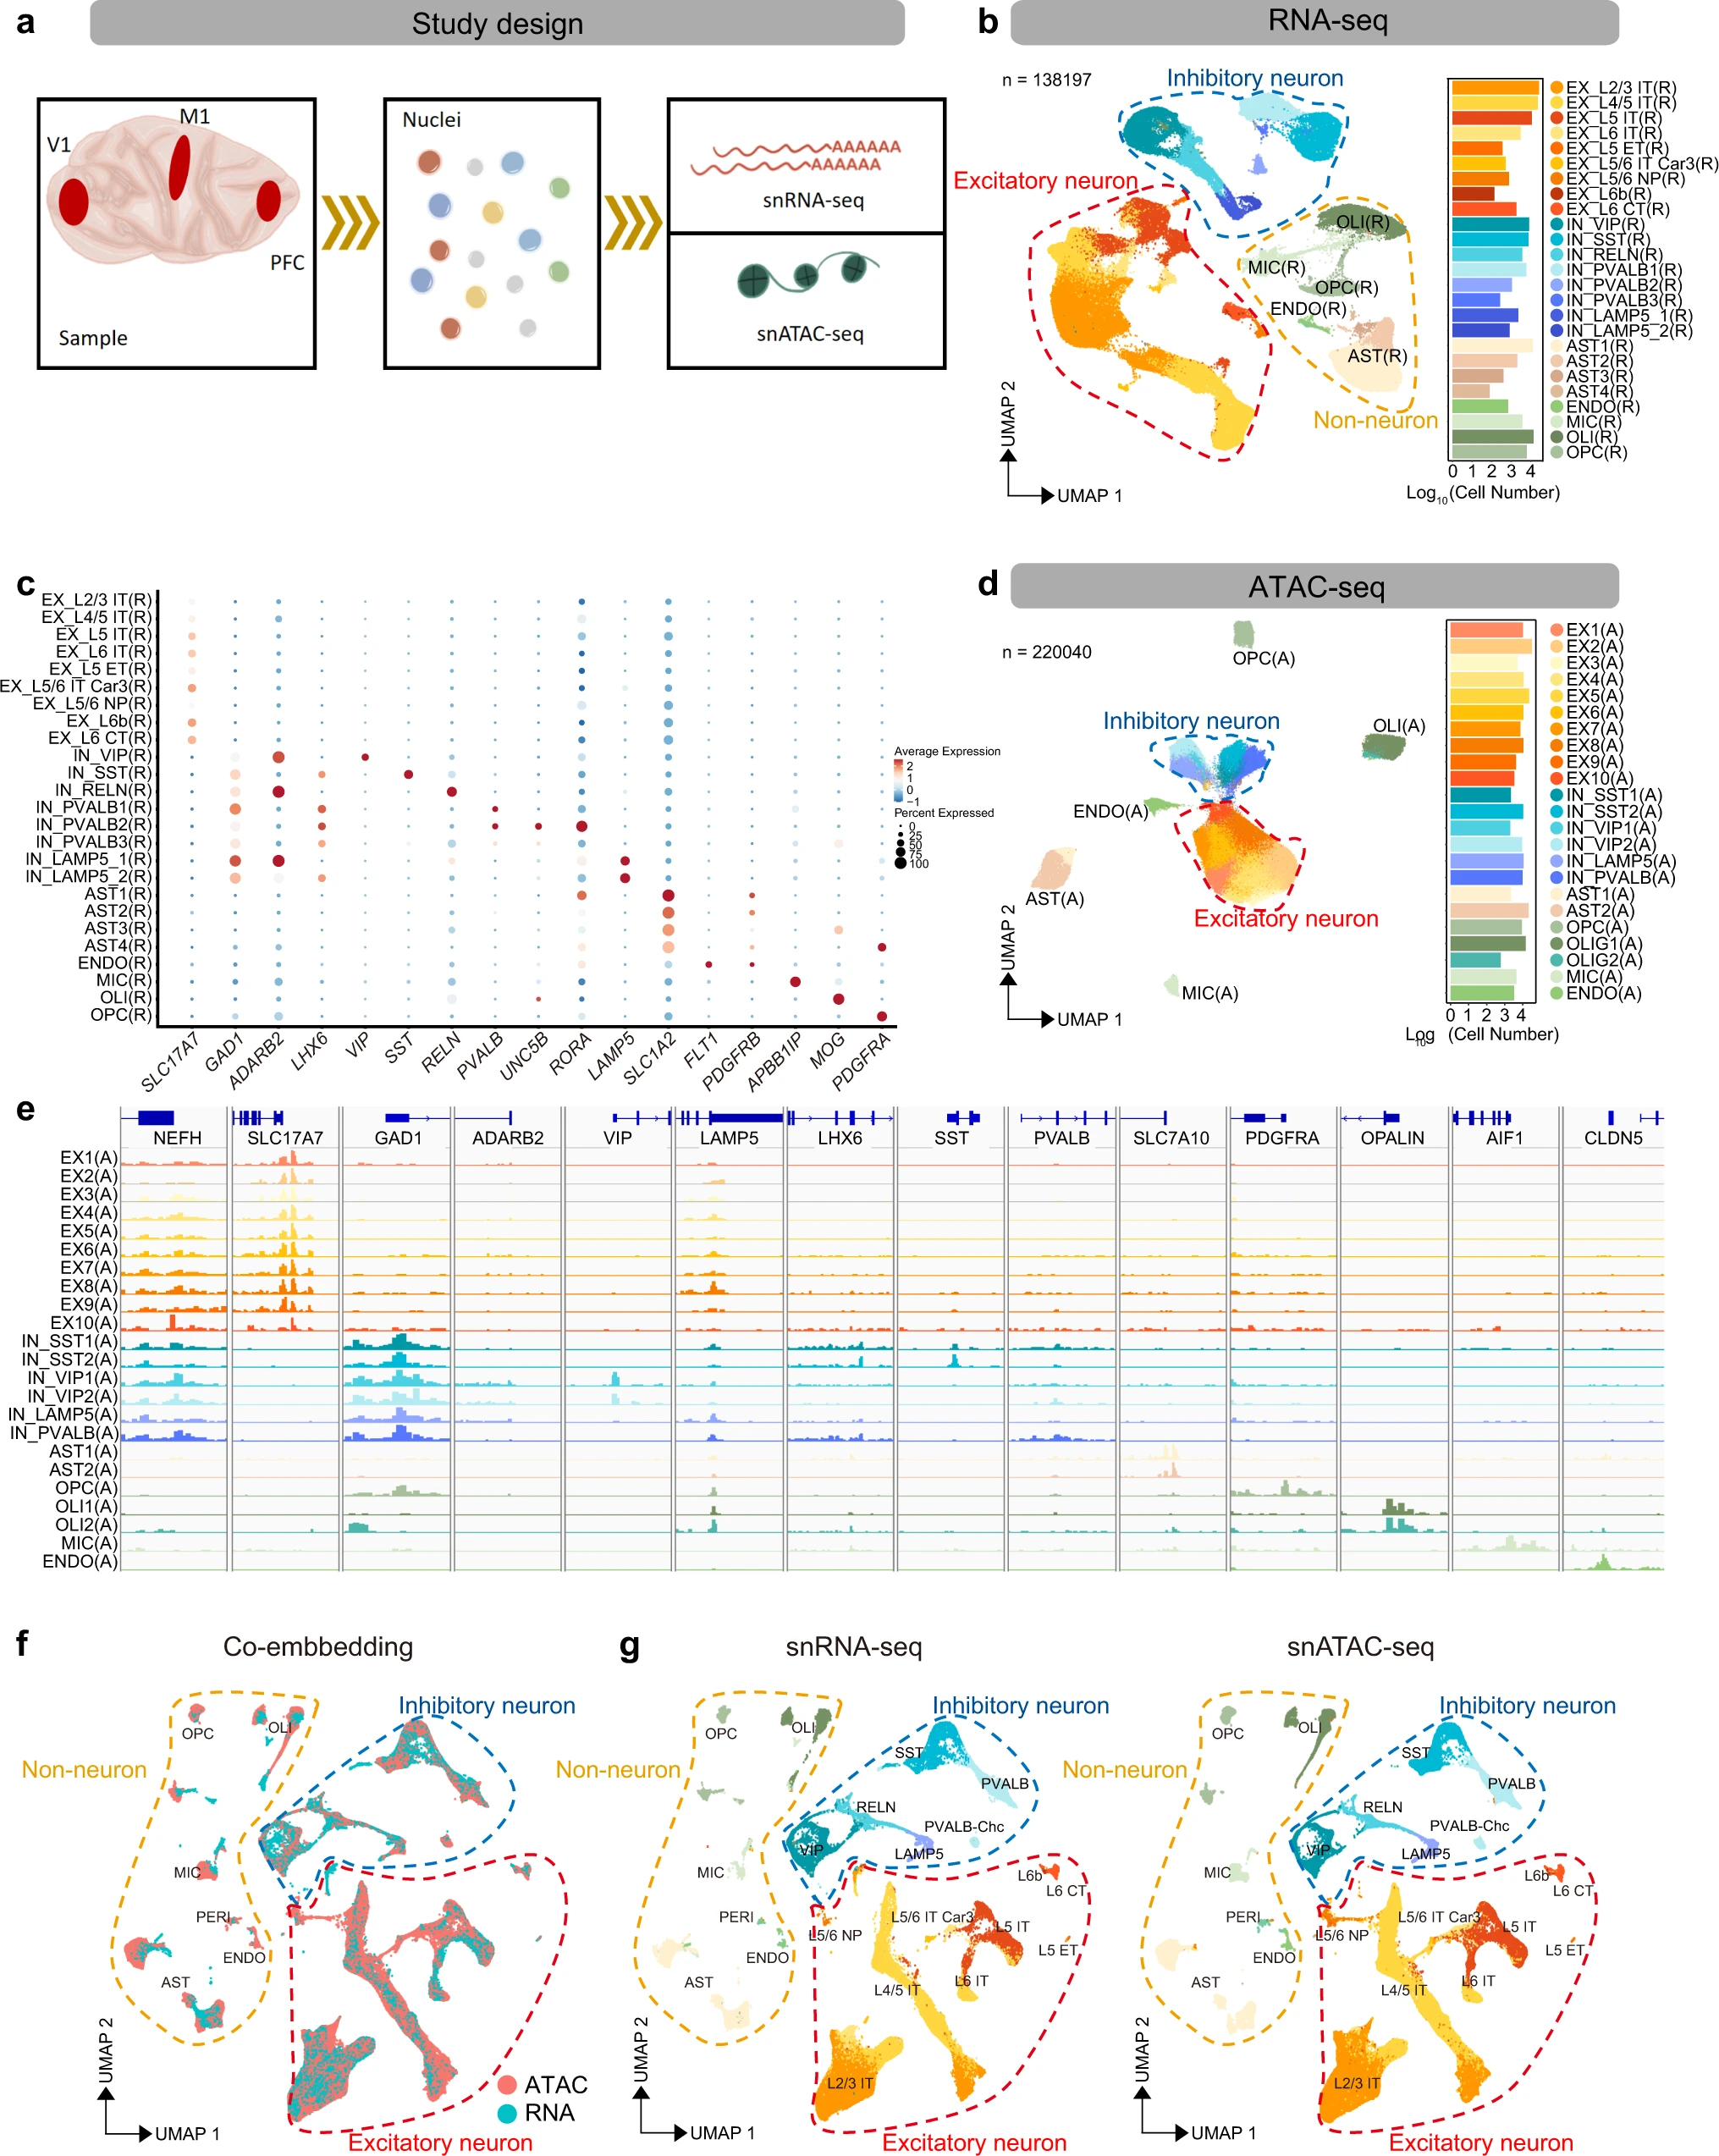
a Schematic workflow of single-nucleus isolation from the prefrontal cortex (PFC), primary motor cortex (M1) and primary visual cortex (V1) for snATAC-seq and snRNA-seq, sample processing, library generation and downstream analysis. b Uniform manifold approximation and projection (UMAP) of snRNA-seq data showing all clusters colored by cell types (N = 138,197 cells) (left), bar plot showing the number of cells per cell type (right). c Dot plots of expression values for marker genes of neuronal and non-neuronal cell types in snRNA-seq data. d UMAP visualization of snATAC data showing all clusters colored by cell types (N = 220,040 cells) (left), bar plot showing the number of cells per cell type (right). e Integrative genomics viewer (IGV) plots showing color-coded aggregate read density for cells within each cell cluster at neuronal and non-neuronal cell-type-specific marker genes. f Co-embedding of snRNA-seq and snATAC-seq clusters across PFC, M1 and V1 brain regions using Seurat V3 (N = 347,682 cells). g UMAP projection of snRNA-seq (N = 138,197 cells) and snATAC-seq cells (N = 209,485 cells) from (f). Cell clusters in each UMAP are color-coded and annotated according to cell identity.
