
Fig. 1: The used polar motion (PM) and length-of-day variations (ΔLOD) records.
From: Inner core static tilt inferred from intradecadal oscillation in the Earth’s rotation
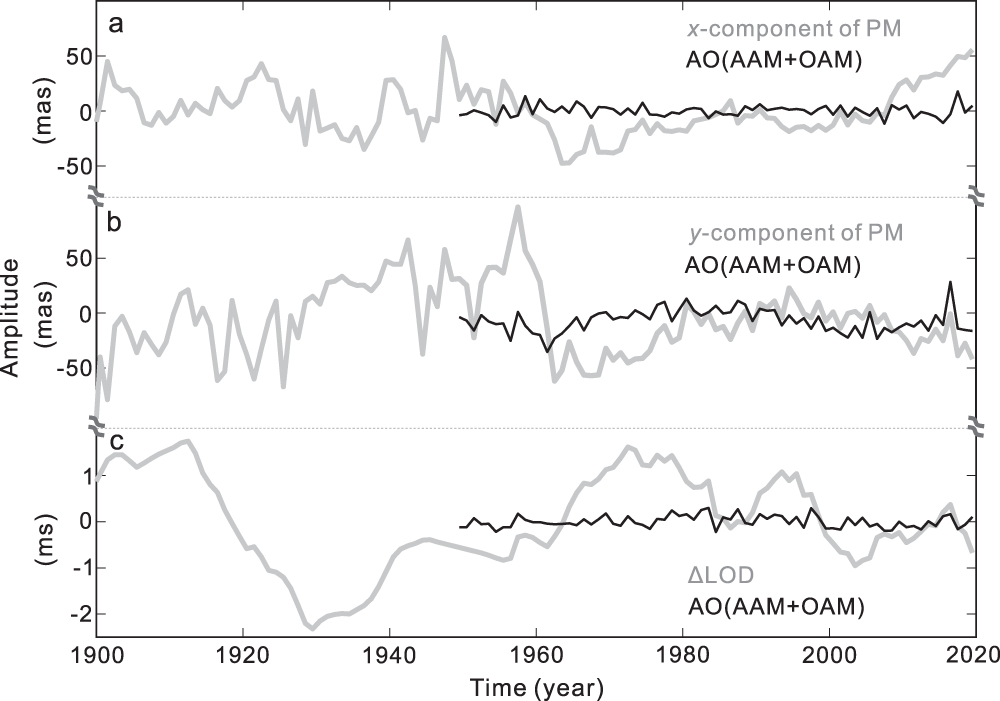
The x component (a) and y component (b) of the observed PM records from 1900 to 2020 (gray curves) and the PM excited by the atmospheric and oceanic angular momentum (AAM + OAM, abbreviated as AO: black curve) from 1949 to 2020; c the observed ΔLOD record from 1900 to 2020 (gray curves) and the ΔLOD excited by the AAM + OAM (AO: black curve) from 1949 to 2020.
