
Fig. 1: Growth and immune component analysis in T22, T127 and co-transplantation models.
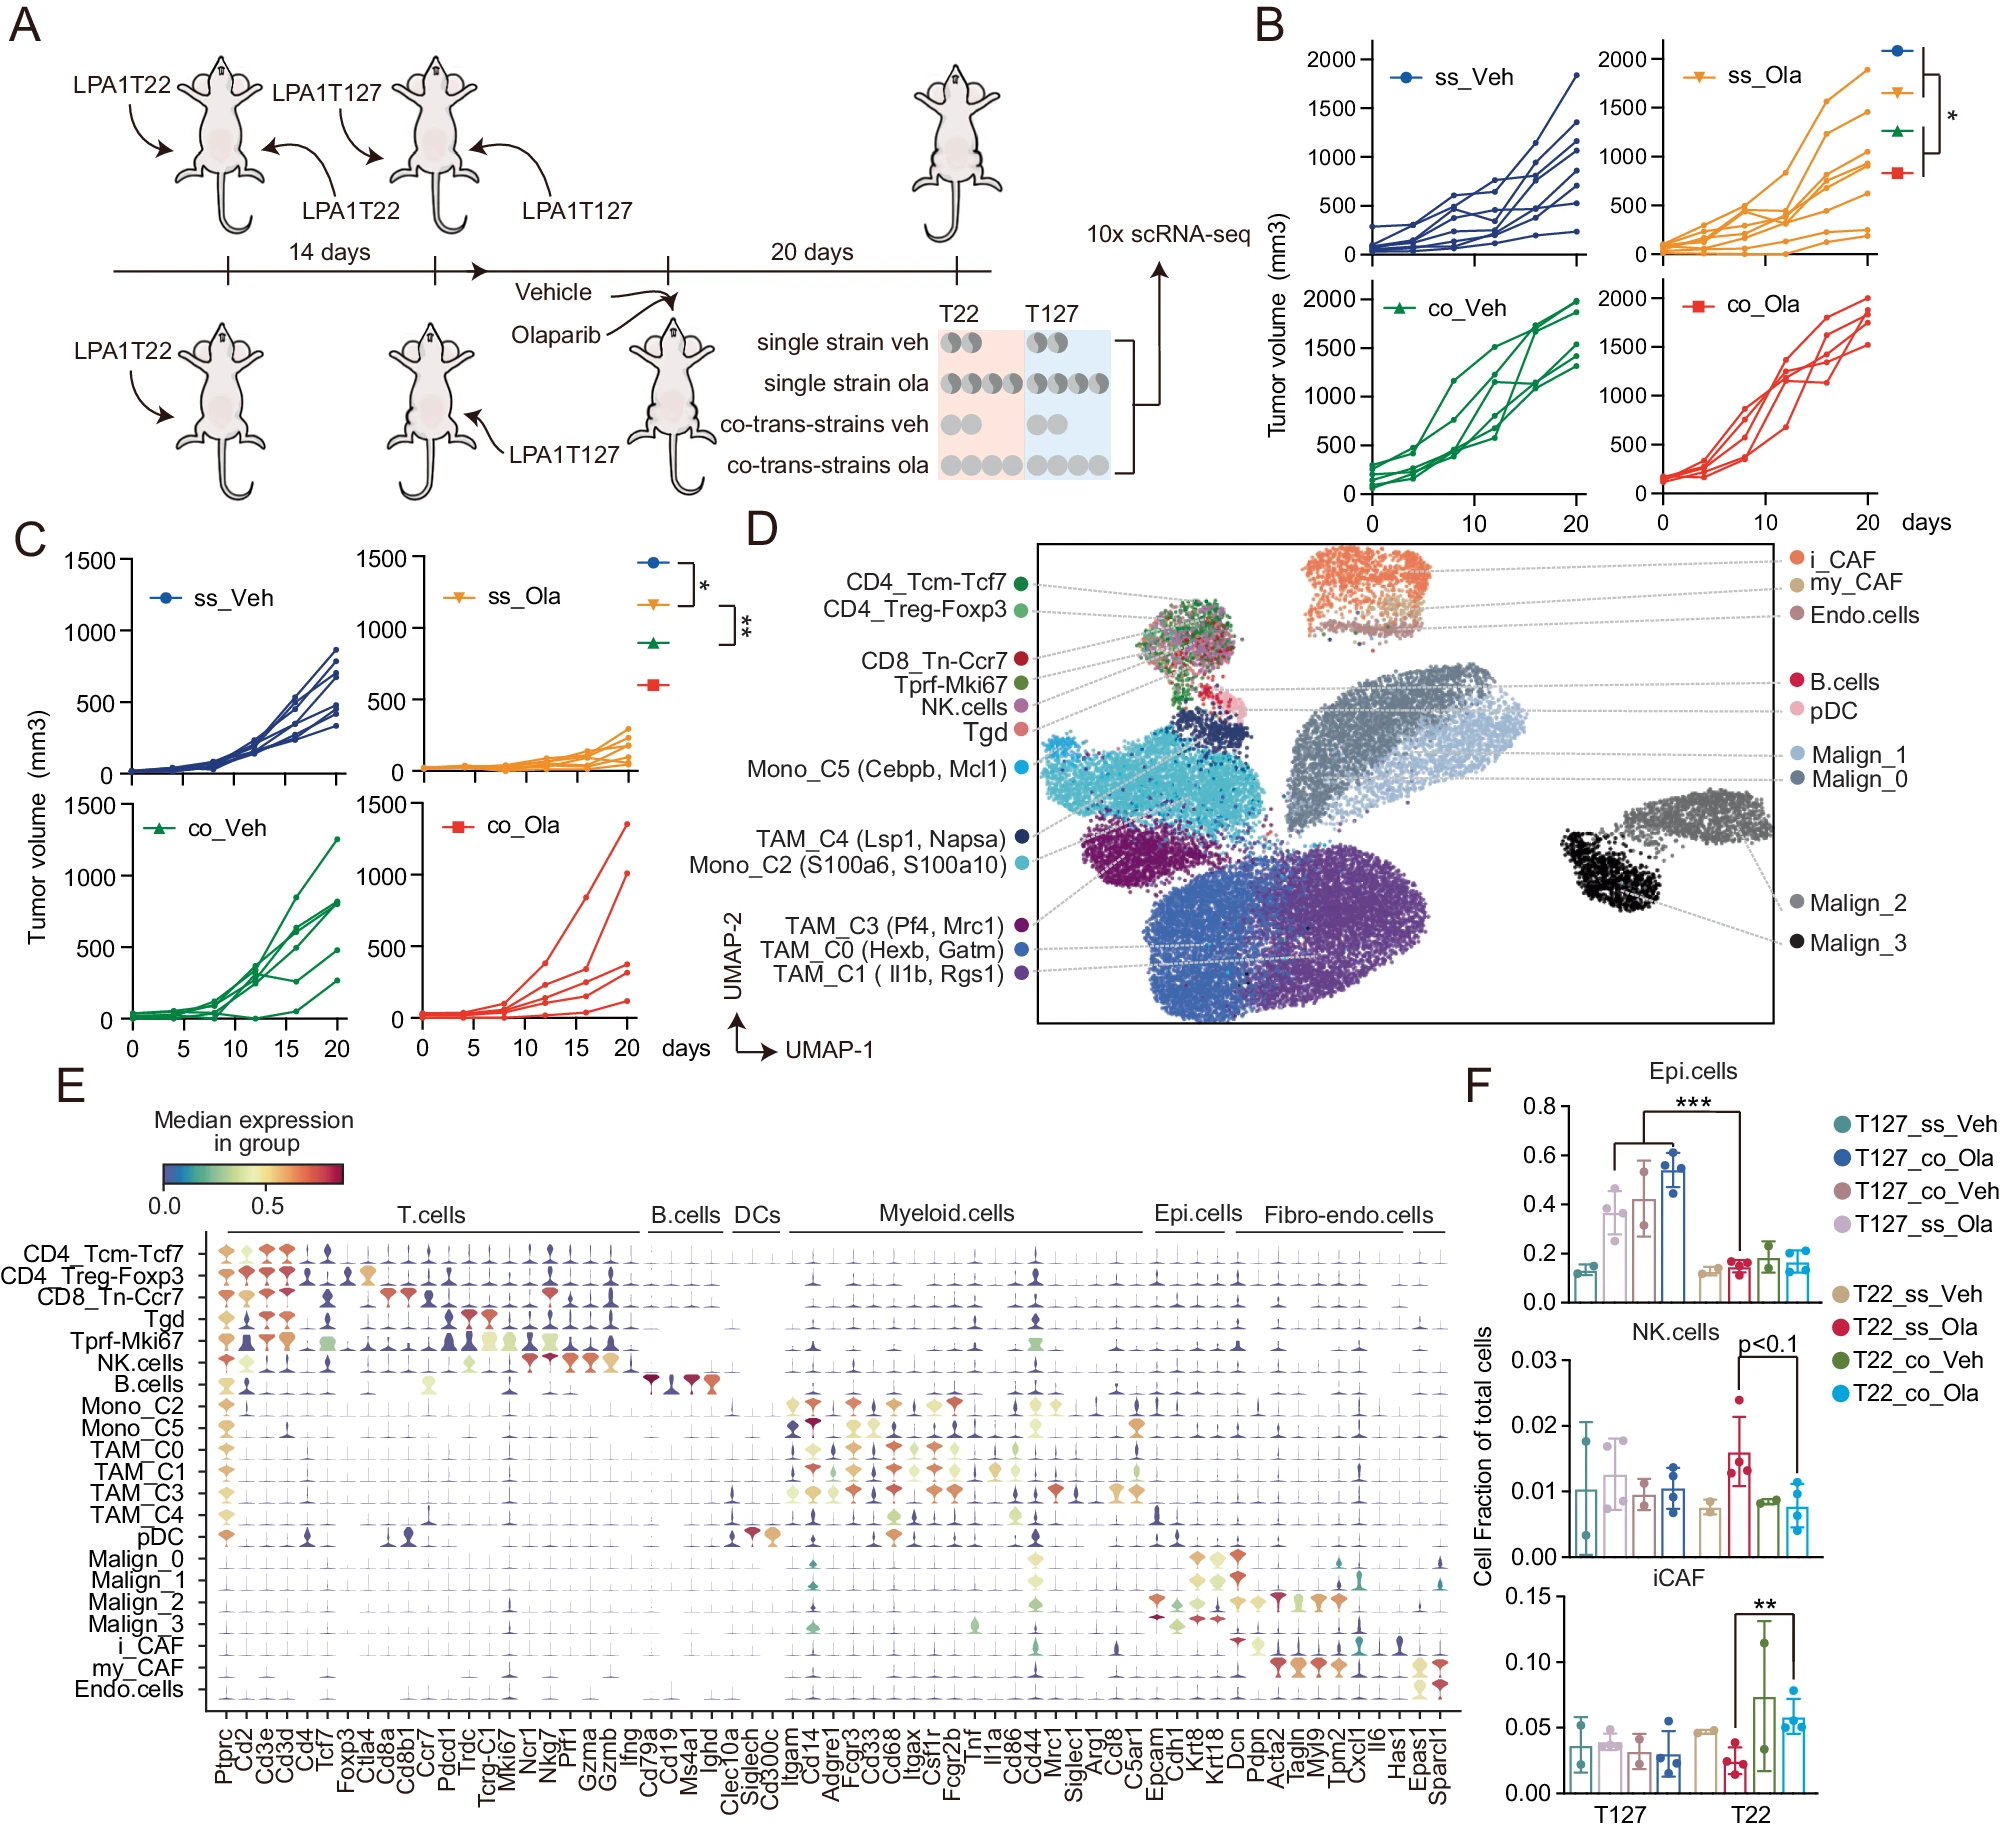
A Design of the study in T127 and T22 single strain (upper) and co-transplanted T22 and T127 (lower) MDST models receiving olaparib for 20 days. Bilateral tumors from a single mouse are represented by dark gray and light gray respectively). B Growth curve of T127 models with olaparib for 20 days. Tumor size of single strain transplantation models represent the average of both sides in a single strain mouse. ss: single strain transplantation models. co: T127 side of co-transplantation models. For single strain models, n = 8, co-transplantation treated with vehicle, n = 6 and co-transplantation treated with olaparib, n = 5. C Growth curve of T22 models with olaparib for 20 days. Tumor size of single strain transplantation models represent the average of both sides in a single strain mouse. ss: single strain transplantation models. co: T22 side of co-transplantation model. For single strain treated with vehicle, n = 8, single strain treated with olaparib, n = 7; co-transplantation treated with vehicle, n = 6 and co-transplantation treated with olaparib, n = 5. D Stratification and cell-type identification of T22 and T127 tumors from single strain and co-transplantation tumors. Malignant cells from T127 (Malign_0, Malign_1) and T22 (Malign_2, Malign_3) show distinct cell clusters. Tcm: central memory T cells, Treg: regulator T cells, Tn: naive T cells, Tgd: γδT cells, Tprf: proliferative T cells, my_CAF: myofibroblastic cancer associated fibroblast cells, i_CAF: inflammatory cancer associated fibroblast cells, pDC: plasmacytoid dendritic cells. For vehicle treated, n = 2 and olaparib treated, n = 4. E Violin plot of markers representing each cell lineage in Fig. 1D. F Bar plot showing relative numbers of epithelial (high CNV cells), NK cells and i_CAF (in %) defined by cell lineage markers listed in E of each model. For vehicle treated, n = 2 and olaparib treated, n = 4. Statistical significance was assessed only among olaparib treated groups. All data are presented as mean values ± SD. p values are from one-way ANOVA. * p < 0.05, ** P < 0.01, *** p < 0.001. Source data and exact p values are provided as a Source Data file. Source data are provided as a Source Data file. Veh: vehicle. Ola: olaparib.
