
Fig. 5: C5aR1 antagonist treated macrophages activate T cell cytotoxicity ex vivo.
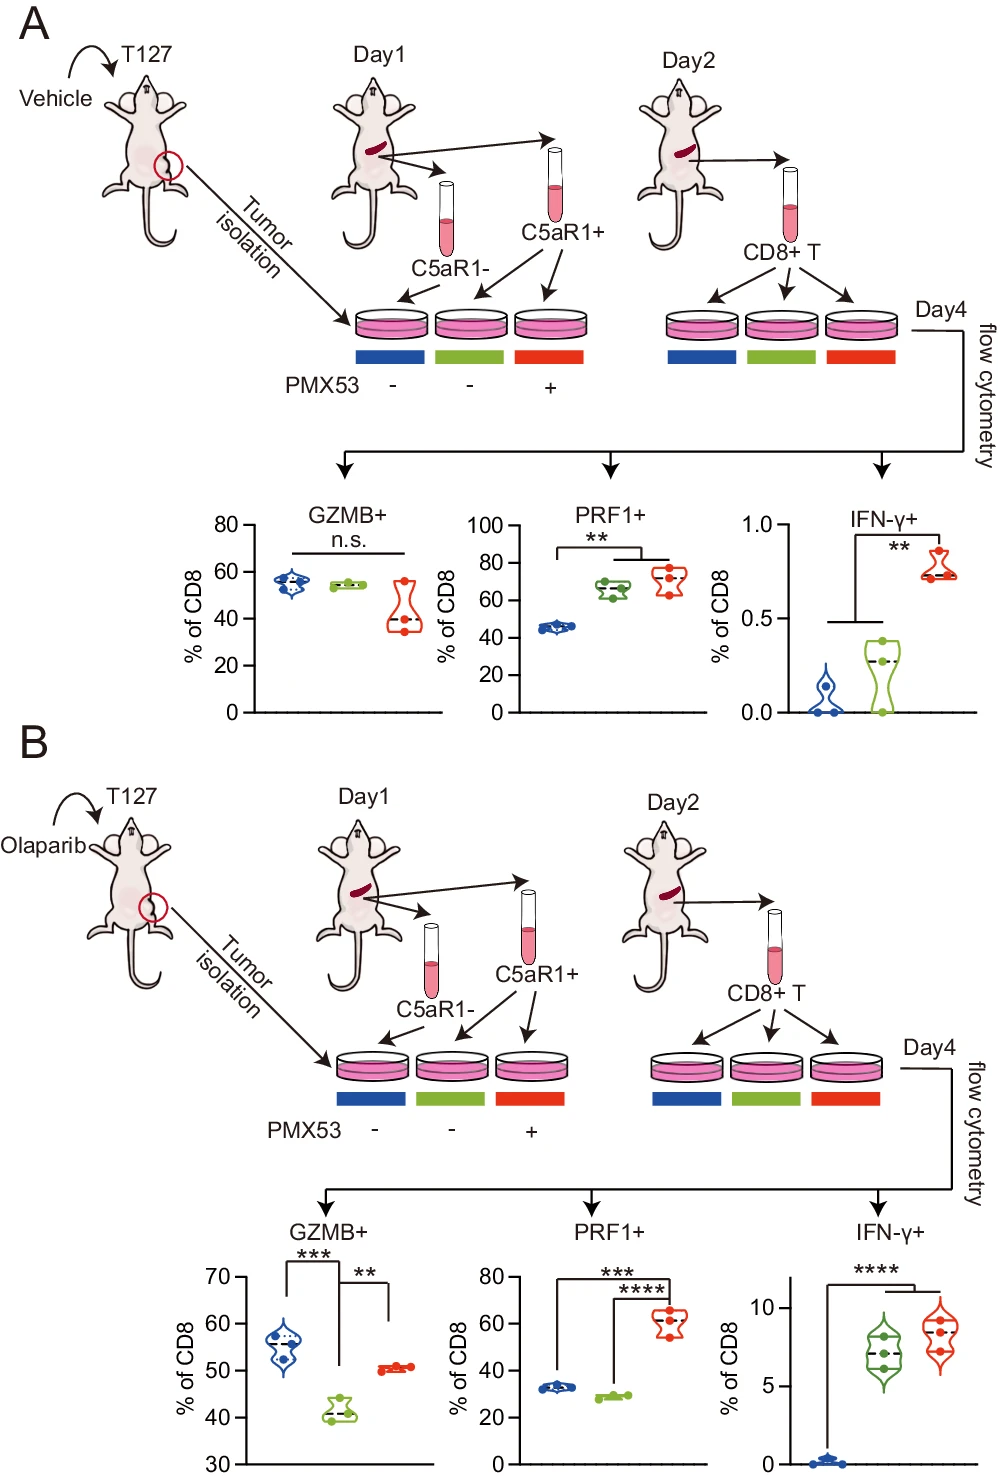
A Work flow of T127 tumor cells purified from vehicle control mice as described in Fig. 1, CD11b+C5aR1−/+ macrophages isolated from tumor naive mice and T cells from tumor naive mice ex vivo co-culture assay (see Methods for details). Briefly, on day 1, 1 × 10⁶ T127 tumor cells from vehicle treated mice were co-cultured with 5 × 10⁵ CD11b+C5aR1−/+ macrophages with and without PMX53 (40 nM). On day 2, CD11b+C5aR1−/+ macrophages were isolated and then co-cultured with 5 × 10⁵ isolated CD8 T cells. CD11b+C5aR1−/+ macrophages were isolated from CD11b+ positive splenocytes as described in Methods. Fraction of GZMB+, PRF1+, IFNγ+ CD8+ T cells in each indicated group from left assessed by flow cytometry. n = 3. Data are presented as mean values±SD. Comparison was done by one-way ANNOVA. * p < 0.05, ** P < 0.01, *** p < 0.001, **** p < 0.0001. B Work flow of T127 tumor cells purified from mice treated with olaparib as described in Fig. 1, CD11b+C5aR1−/+ macrophages isolated from tumor naive mice and T cells from tumor naïve mice ex vivo co-culture assay (see Methods for details). Briefly, on day 1, 1 × 10⁶ T127 tumor cells from olaparib treated mice were co-cultured with 5 × 10⁵ CD11b+C5aR1−/+ macrophages. On day 2, CD11b+C5aR1−/+ macrophages were isolated and then co-cultured with 5 × 10⁵ isolated CD8 T cells. CD11b+C5aR1−/+ macrophages were isolated from CD11b+ positive splenocytes. Fraction of GZMB+, PRF1+, IFNγ+ cells of CD8+ T cells in each indicated group from left assessed by flow cytometry. n = 3. Data are presented as mean values ± SD. Comparison was done by one-way ANNOVA. * p < 0.05, ** P < 0.01, *** p < 0.001, **** p < 0.0001. Source data and exact p values are provided as a Source Data file. Source data are provided as a Source Data file.
