
Fig. 1: Single-cell transcriptomics reveal the heterogeneity of NSCLC.
From: Single-cell and spatial transcriptomics analysis of non-small cell lung cancer
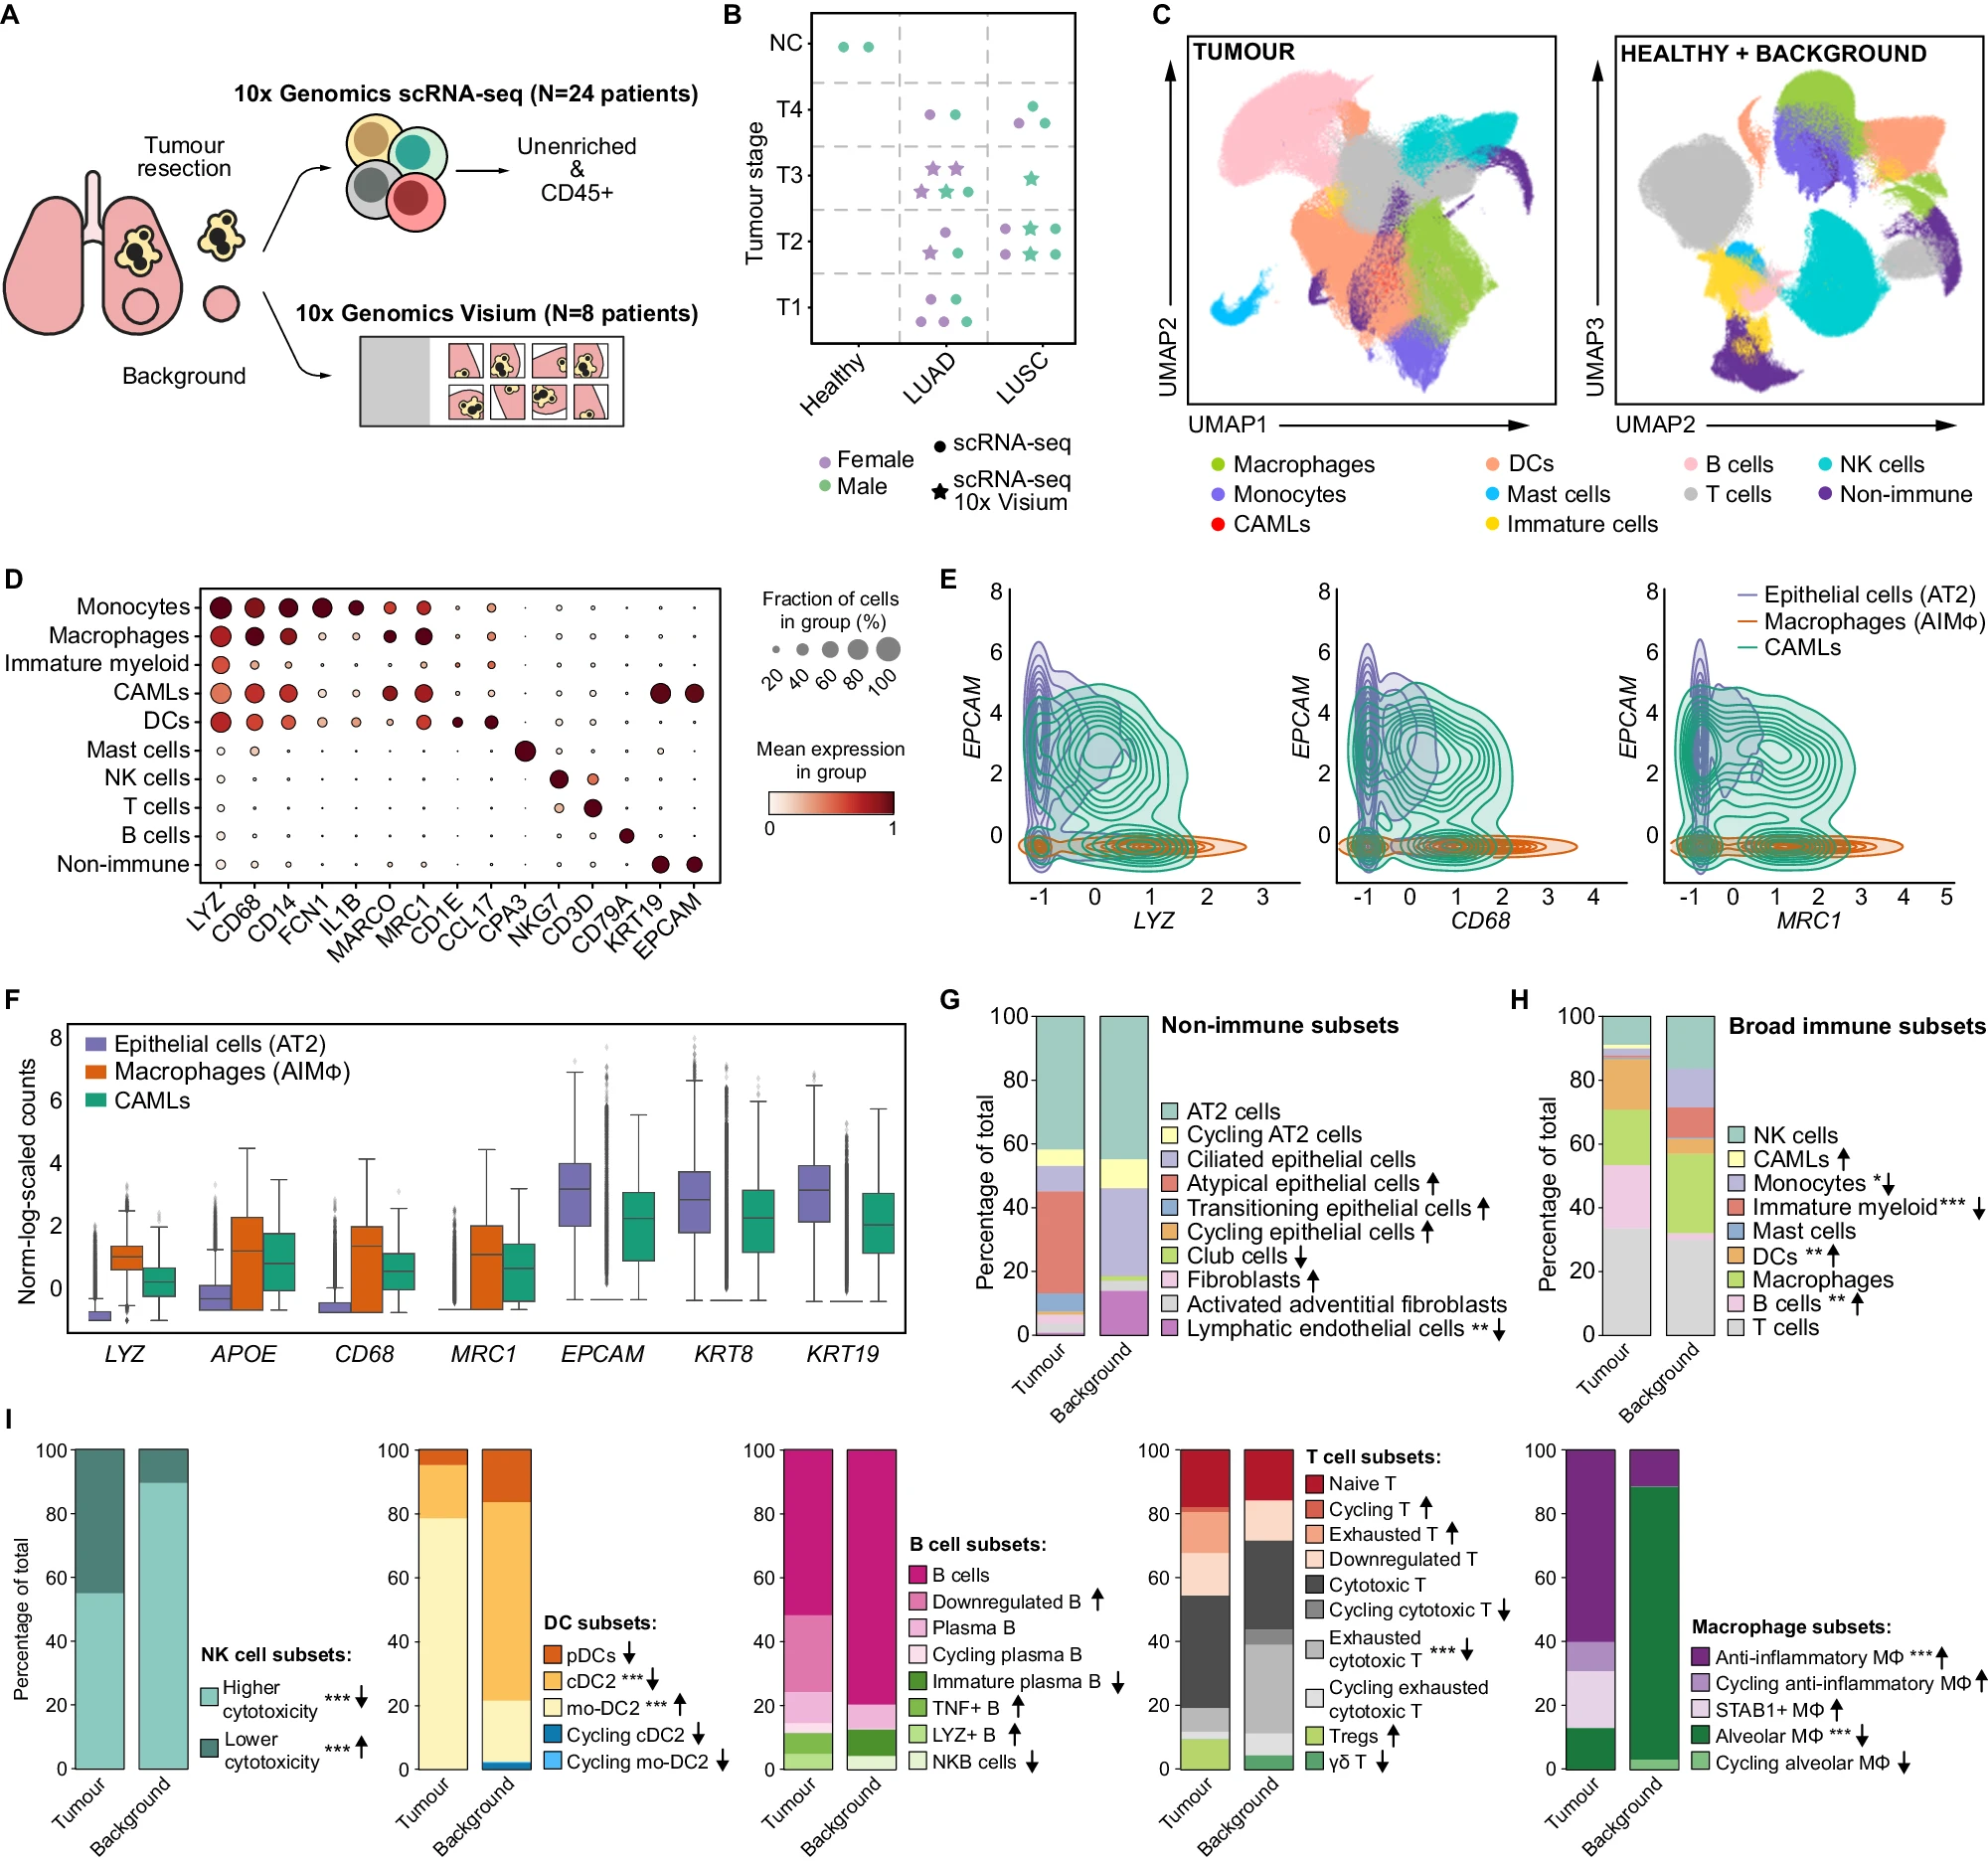
A Study overview. Single-cell suspensions of resected tumour tissue, adjacent non-involved tissue (background) and healthy lung from deceased donors were enriched for CD45+ or CD235− and subjected to scRNA-seq. Cryosections of fresh, flash-frozen tumour, background and healthy tissues were used for 10x Visium spatial transcriptomics. B Cohort overview. Symbols represent individual patients and performed analyses. C UMAP projection of tumour and combined background+healthy datasets. D Dotplot of representative genes used for broad cell-type annotations in tumour samples. E Contour plot showing the co-expression of myeloid (LYZ, CD68, MRC1) and epithelial (EPCAM) genes in AT2 cells (44,399 cells), CAMLs (2520 cells) and AIMɸ (16,120 cells). Normalised, scaled and log-transformed gene expression. F Boxplot showing normalised, scaled and log-transformed gene expression of myeloid (LYZ, APOE, CD68, MRC1) and epithelial (EPCAM, KRT8, KRT19) genes in AT2 cells, CAMLs and AIMɸ. Boxes: quartiles. Whiskers: 1.5× interquartile range. G Relative proportion of non-immune cell subsets in tumour and background, calculated within the CD235− enrichment. Arrows indicate increase (↑) or decrease (↓) in tumour versus background. Pairwise comparisons by two-sided Wilcoxon rank test and Bonferroni correction for multiple comparisons. **P < 0.01. Arrows without asterisks indicate that the cell type was found only in tumour or background. H Relative proportion of broad immune cells in tumour and background, calculated within all immune cells identified in the CD235- enrichment. Arrows indicate an increase (↑) or decrease (↓) in tumour versus background. Pairwise comparisons by two-sided Wilcoxon rank test and Bonferroni correction for multiple comparisons. *P < 0.05, **P < 0.01, ***P < 0.001. Arrows without asterisks indicate that the cell type was found only in tumour or background. I Relative proportion of NK, DC, B, T and macrophage subsets within the broad annotations in tumour and background, calculated within the CD235- enrichment. Arrows indicate increase (↑) or decrease (↓) in tumour versus background. Pairwise comparisons by two-sided Wilcoxon rank test and Bonferroni correction for multiple comparisons. ***P < 0.001. Arrows without asterisks indicate that the cell type was found only in tumour or background.
