
Fig. 2: Integrated single cell and spatial transcriptomics uncovers different interaction networks in LUAD and LUSC.
From: Single-cell and spatial transcriptomics analysis of non-small cell lung cancer
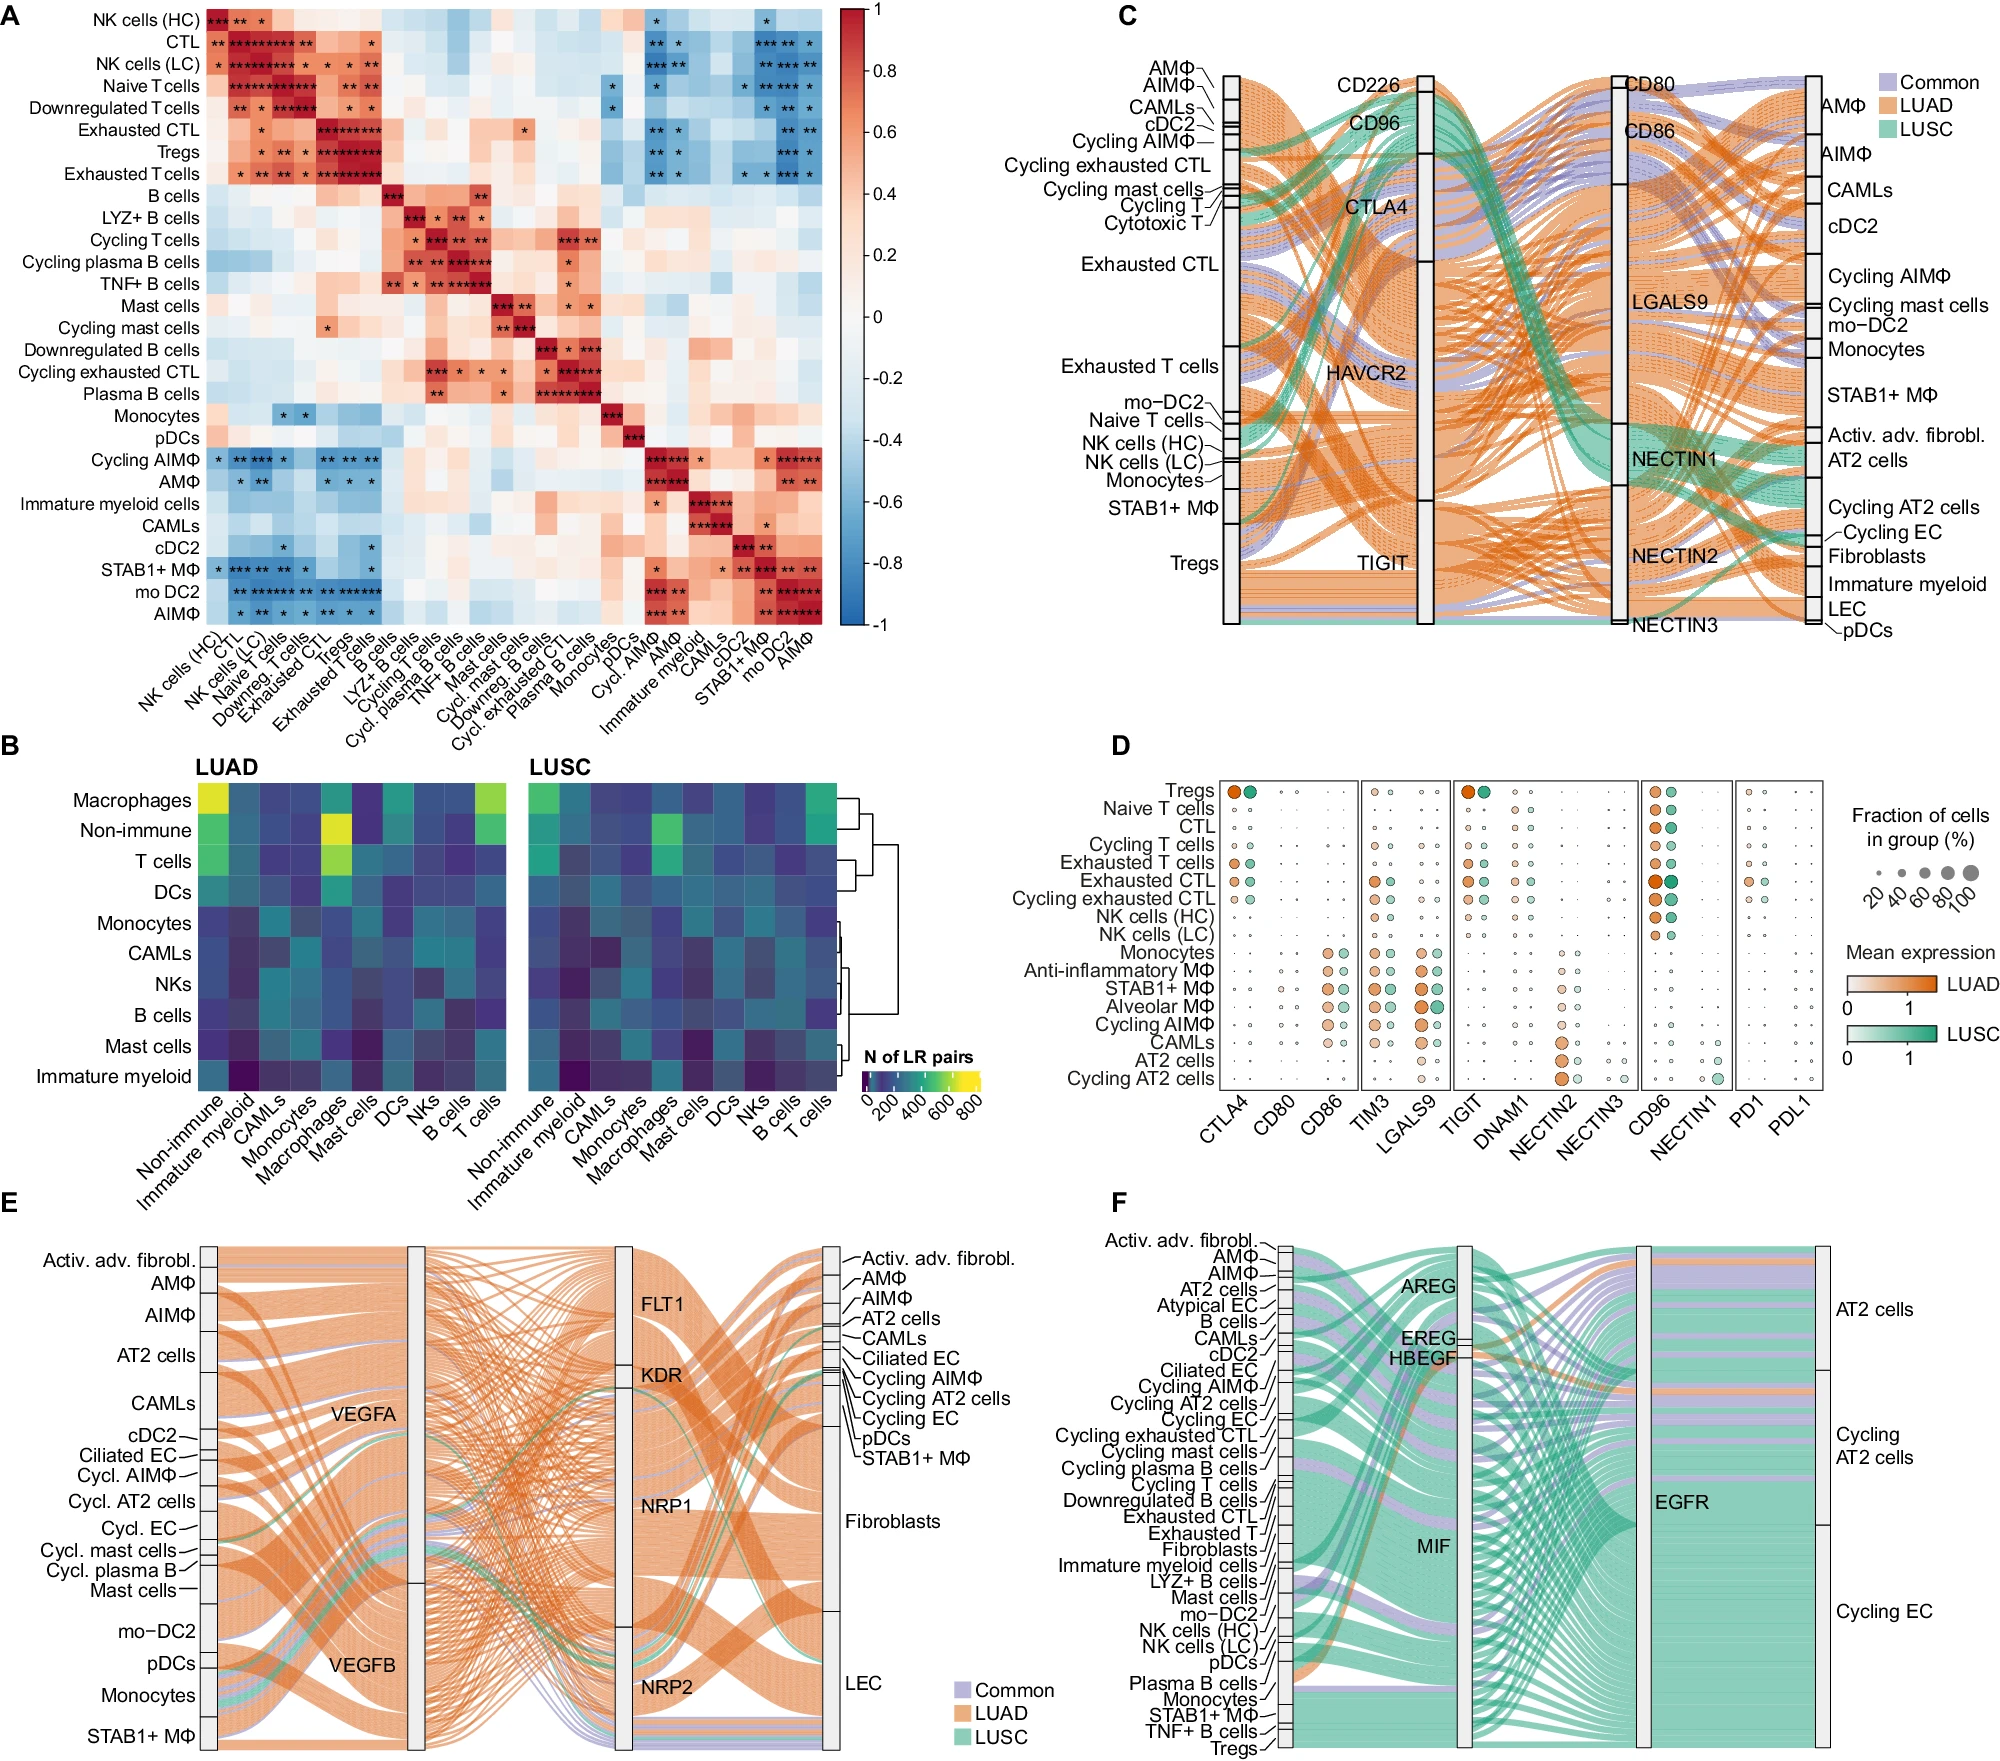
A Heatmap showing the Pearson correlation between the relative cell-type abundance for each immune cell type (calculated within the CD235− enrichment). Colour indicates the Pearson correlation value, asterisks indicate the level of significance of the two-sided association test computed on Pearson’s product-moment correlation coefficients (*P < 0.05, **P < 0.01, ***P < 0.001). B Heatmap showing the number of LR interactions between all cell types summarised by broad cell annotations in LUAD (left) and LUSC (right). Rows were hierarchically clustered using the complete linkage method on euclidean distances. C Sankey diagram showing the tumour-specific interactions in LUAD and LUSC for selected ICIs detected by cellphoneDB. Line colour identifies whether the LR interaction between each cell type was found in LUAD only (orange), in LUSC only (green) or in both tumour types (blue). D Dotplot for the ICI genes and cell types highlighted in (C), split by tumour type. The size of each dot represents the percentage of cells in the cluster expressing the gene, while the colour represents the mean normalised scaled log-transformed expression of each gene in each group. E Sankey diagram showing the tumour-specific interactions in LUAD and LUSC for VEGFA/B interactors detected by cellphoneDB. Line colour identifies whether the LR interaction between each cell type was found in LUAD only (orange), in LUSC only (green) or in both tumours (blue). F Sankey diagram showing the tumour-specific interactions in LUAD and LUSC for EGFR interactors detected by cellphoneDB. Line colour identifies whether the LR interaction between each cell type was found in LUAD only (orange), in LUSC only (green) or in both tumours (blue).
