
Fig. 3: 10x Visium confirms the spatial colocalization of key ligand–receptor pairs.
From: Single-cell and spatial transcriptomics analysis of non-small cell lung cancer
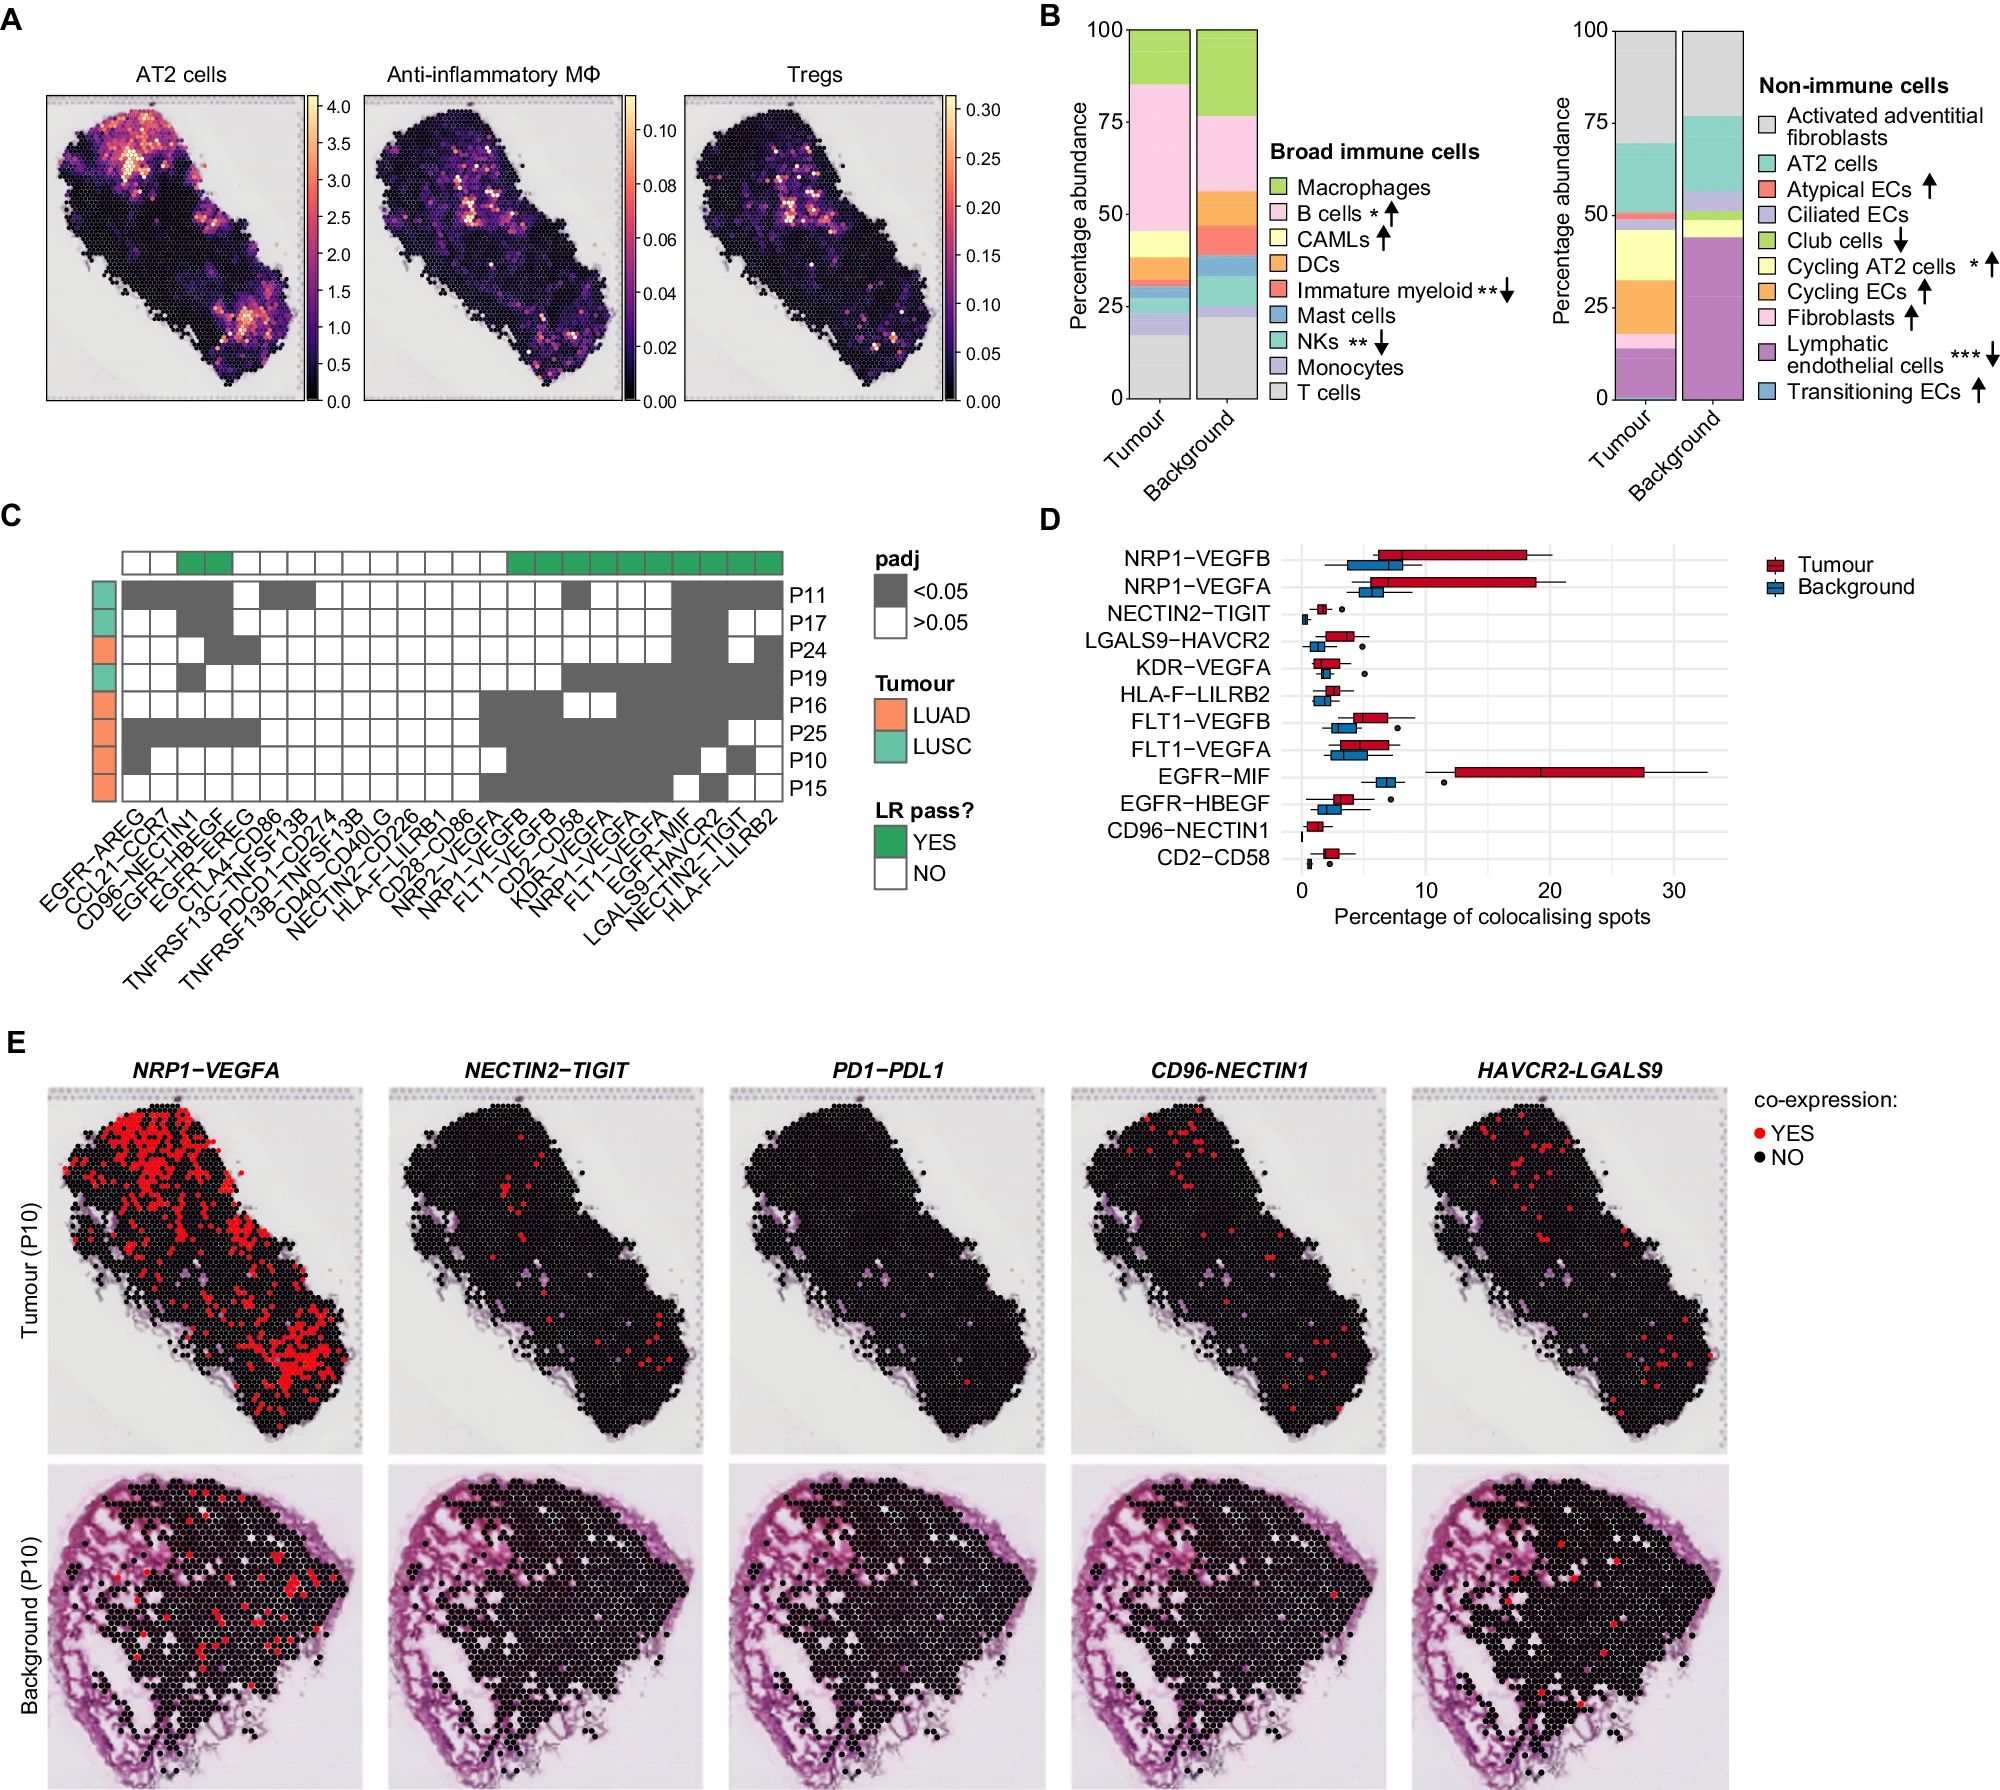
A Spatial images depicting the cell abundance estimated by cell2location for AT2 cells, AIMɸ and Tregs on a representative tumour section. B Relative proportion of immune (left) and non-immune (right) cell types calculated on the cell abundance estimations by cell2location in tumour and background sections. Immune cells were grouped according to their broad annotations. Arrows indicate an increase (↑) or a decrease (↓) in the tumour, compared to the background. Pairwise comparisons were performed with a two-sided Wilcoxon rank test and Bonferroni correction for multiple comparisons. *P < 0.05, **P < 0.01, ***P < 0.001. Arrows without asterisks indicate that the cell type was found only in the tumour or background. Please refer to Supplementary Data 13 and 14 for the exact P values. C Heatmap of spatial LR colocalization. LR gene pair co-expression was estimated in each spot for all sections, and the frequency of colocalising vs. non-colocalising spots in the tumour and background was compared using a χ2 test followed by Bonferroni multiple comparison correction. Dark-grey tiles indicate that the frequency of colocalising gene pairs was significantly different in tumour and background sections. Green column annotations indicate the LR pairs which were significant in at least four out of eight patients. Row annotations indicate tumour type. D Boxplot showing the frequency of colocalising LR pairs significantly different in tumour vs background in each section analysed. N = 8 patients. Boxes are plotted with default settings in the Python Seaborn package, i.e., boxes show quartiles with whisker length being 1.5 times the interquartile range. Source data is provided as a Source Data file. E Spatial images depicting the location of spots in which the LR pair was found co-expressed in tumour (top) and background (bottom), for NRP1-VEGFA, NECTIN2-TIGIT, PD1-PDL1, CD96-NECTIN1 and HAVCR2-LGALS9. Representative sections from one patient.
