
Fig. 4: CAMLs share tumour CNAs and colocalise with tumour cells.
From: Single-cell and spatial transcriptomics analysis of non-small cell lung cancer
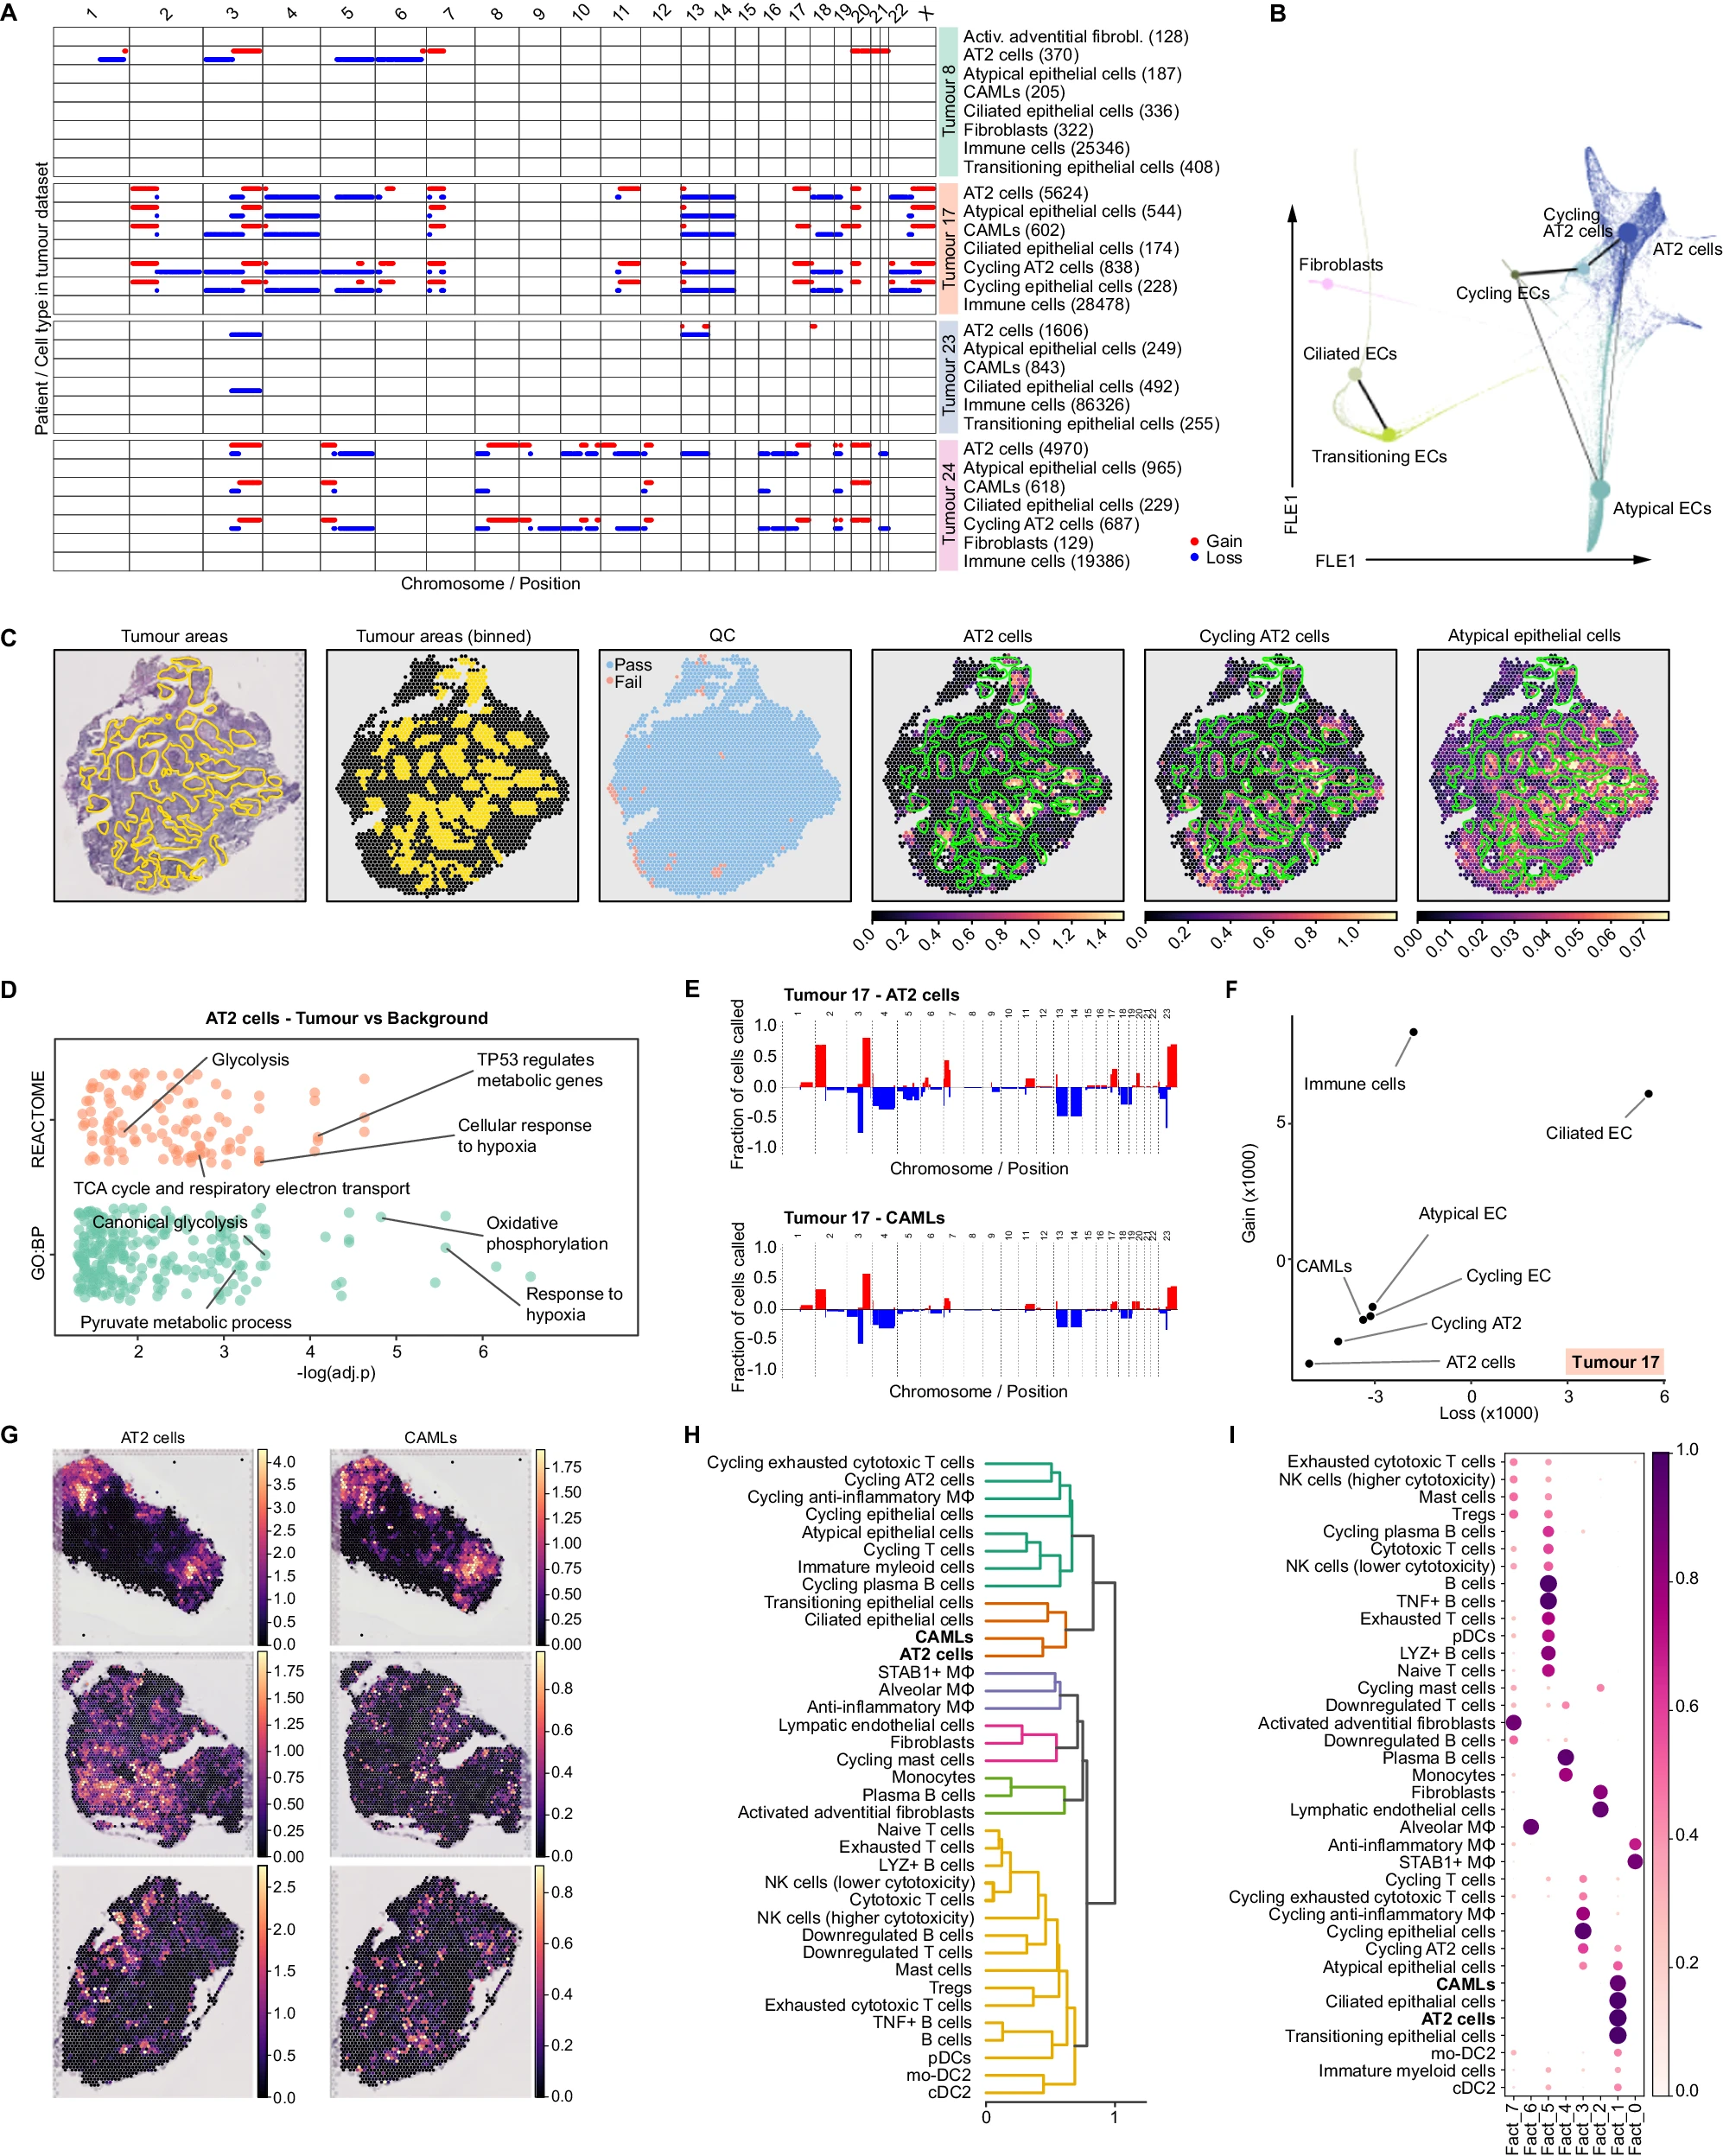
A CNA analysis. The plot shows chromosomal gains (red lines) and losses (blue lines) estimated by CopyKat in each chromosome arm for different cell types and patients in the tumour dataset. All immune cell types were grouped together for plotting purposes. B PAGA graph overlaid on the diffusion maps (force-directed layout—FLE embedding) computed for non-immune cell types in tumour. C First three panels—Representative blind annotations from a qualified pathologist, indicating the areas of tumour infiltration (left), binning of the tumour area on the Visium spots (centre) and the spots that passed QC (right). The last three panels—cell2location estimation for AT2 cells (left), Cycling AT2 cells (centre) and Atypical epithelial cells (right) on the same sections, overlaid with the pathologist’s annotation for the tumour infiltration (green contour). D Overrepresentation analysis on gene ontology—biological processes (GO:BP) and REACTOME database by clusterProfiler R package, using DEGs upregulated by AT2 cells in tumour vs background. Source data is provided as a Source Data file. E Detailed overview of CNAs in AT2 and CAMLs from the tumour of one representative patient. Bars indicate the frequency of cells harbouring chromosomal gains (red bar) or losses (blue bars) in specific chromosomal regions. F Scatterplot of the KL divergence for losses (x axis) and gains (y axis) between each cell type in the tumour dataset calculated using their gain and loss distribution. All immune cell types were grouped together for plotting purposes. G Spatial images depicting the cell abundance estimated by cell2location for AT2 cells and CAMLs on three representative tumour sections. H Hierarchical clustering of the correlation distance calculated on cell-type composition (as estimated by cell2location) across spots that passed QC in all tumour sections. I Non-negative matrix factorisation built on the q05 estimation of cell-type abundance across spots that passed QC (as estimated by cell2location) in all tumour sections.
