
Fig. 5: Tumour macrophages undergo oncofoetal reprogramming.
From: Single-cell and spatial transcriptomics analysis of non-small cell lung cancer
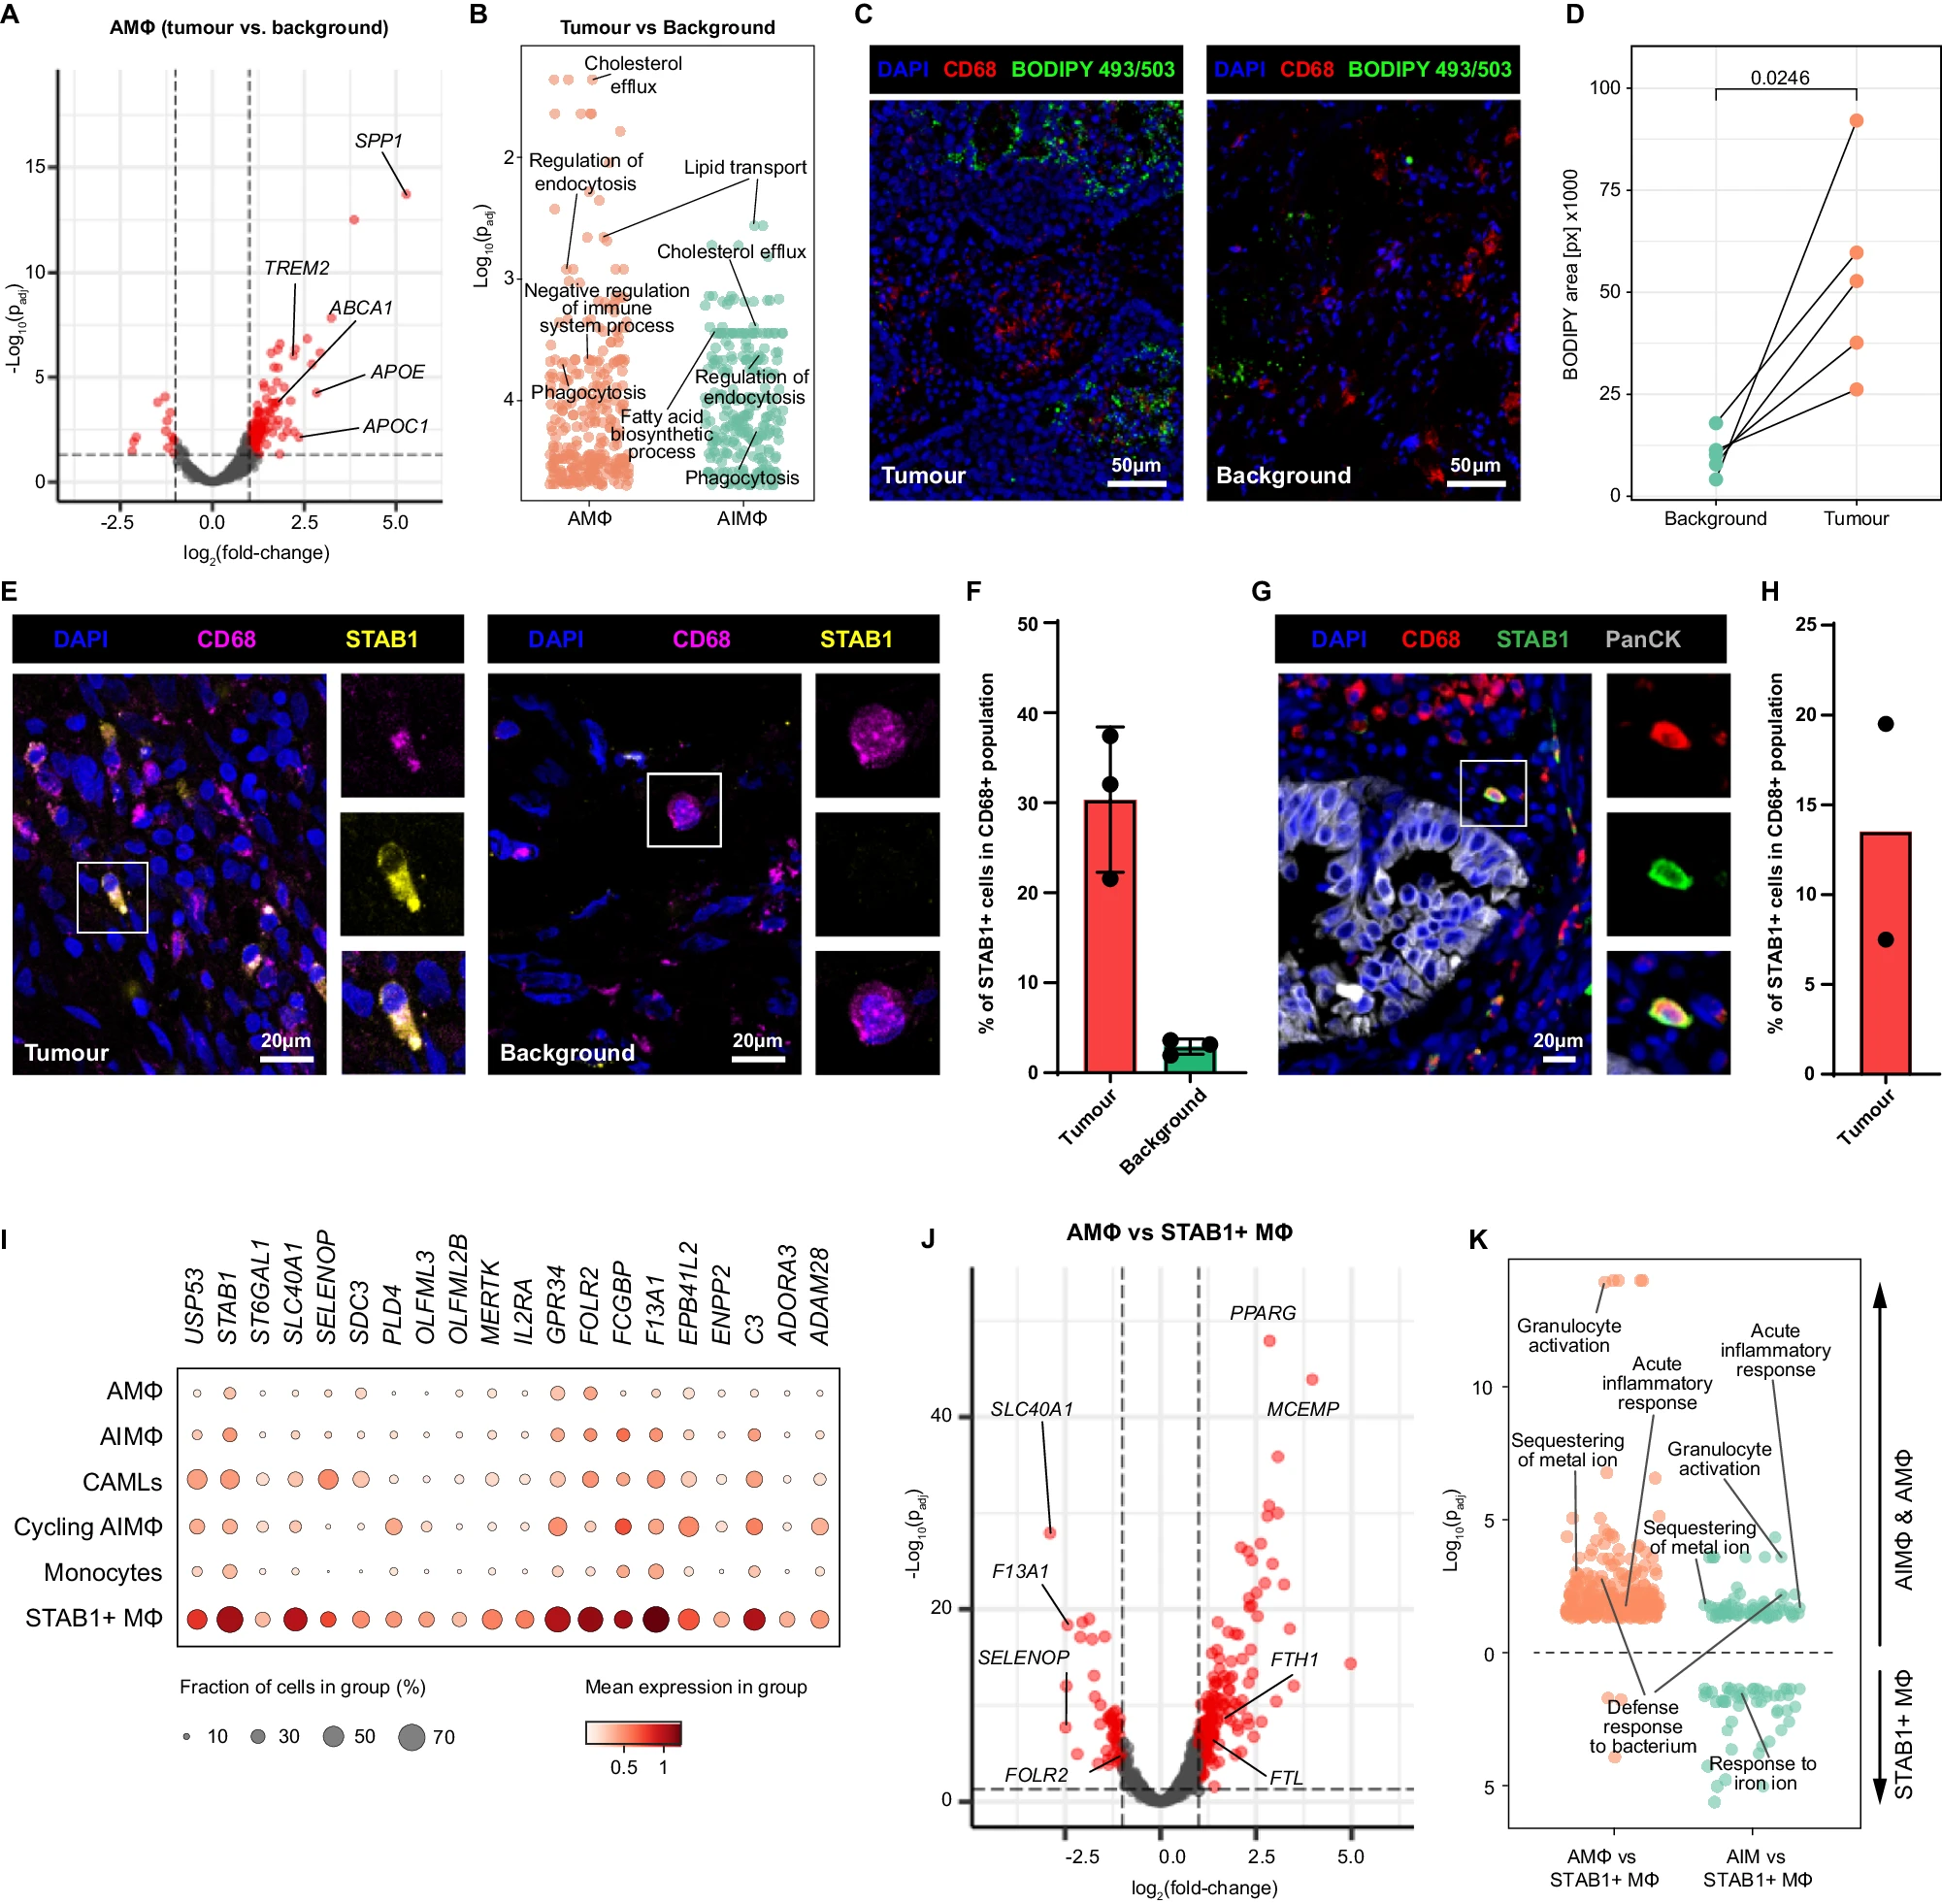
A Volcano plot of DEGs (red) for AIMɸ in tumour vs background, extracted using the py_DESeq2 package. B Overrepresentation analysis on gene ontology—biological processes database by clusterProfiler R package, using the DEGs upregulated by Alveolar Mɸ and AIMɸ in tumour vs background. Source data is provided as a Source Data file. C IHC for CD68 and neutral lipids (BODIPY 493/503) on tumour and background tissue sections. Maximum intensity projection of Z-stacks. Scale bar 50 µm. D Area covered by the BODIPY signal in tumour and background section. The difference in BODIPY area coverage was determined with a paired, two-sided t test, matching tumour and background sections from the same patients. N = 5 patients. Source data is provided as a Source Data file. E IHC for CD68 and STAB1 on tumour (left) and background (right) tissue sections. Maximum intensity projection of Z-stacks. Inlets show a detailed magnification on a single cell. Scale bar 20 µm. F Quantification of STAB1+ cells within the CD68+ macrophage population. The fraction of the STAB1 + CD68+ area is shown as a percentage of the total CD68+ area. Data are presented as mean value and standard deviation (n = 3 biological replicates). Source data is provided as a Source Data file. G Staining for CD68, STAB1 and PanCK on tumour tissue sections. Maximum intensity projection of Z-stacks. Inlets show a detailed magnification on a single cell. Scale bar 20 µm. H Quantification of STAB1 + CD68+ cells within the CD68+ macrophage population in NSCLC. Data are presented as mean value and individual data points (n = 2 biological replicates). Source data is provided as a Source Data file. I Dotplot showing the expression of the “STAB1 signature genes” across all macrophage subsets and CAMLs in tumour. J Volcano plot of DEGs identified by py_DESeq2 (red) for Alveolar Mɸ vs STAB1 Mɸ in tumour. K Overrepresentation analysis on gene ontology— biological processes database by clusterProfiler R package, using the DEGs from Alveolar Mɸ vs STAB1 Mɸ (top) and AIMɸ vs STAB1 Mɸ (bottom) in tumour (left—upregulated by STAB1 Mɸ; right—upregulated by Alveolar Mɸ or AIMɸ). Source data is provided as a Source Data file.
