
Fig. 6: STAB1 + Mɸ undergo oncofoetal reprogramming.
From: Single-cell and spatial transcriptomics analysis of non-small cell lung cancer
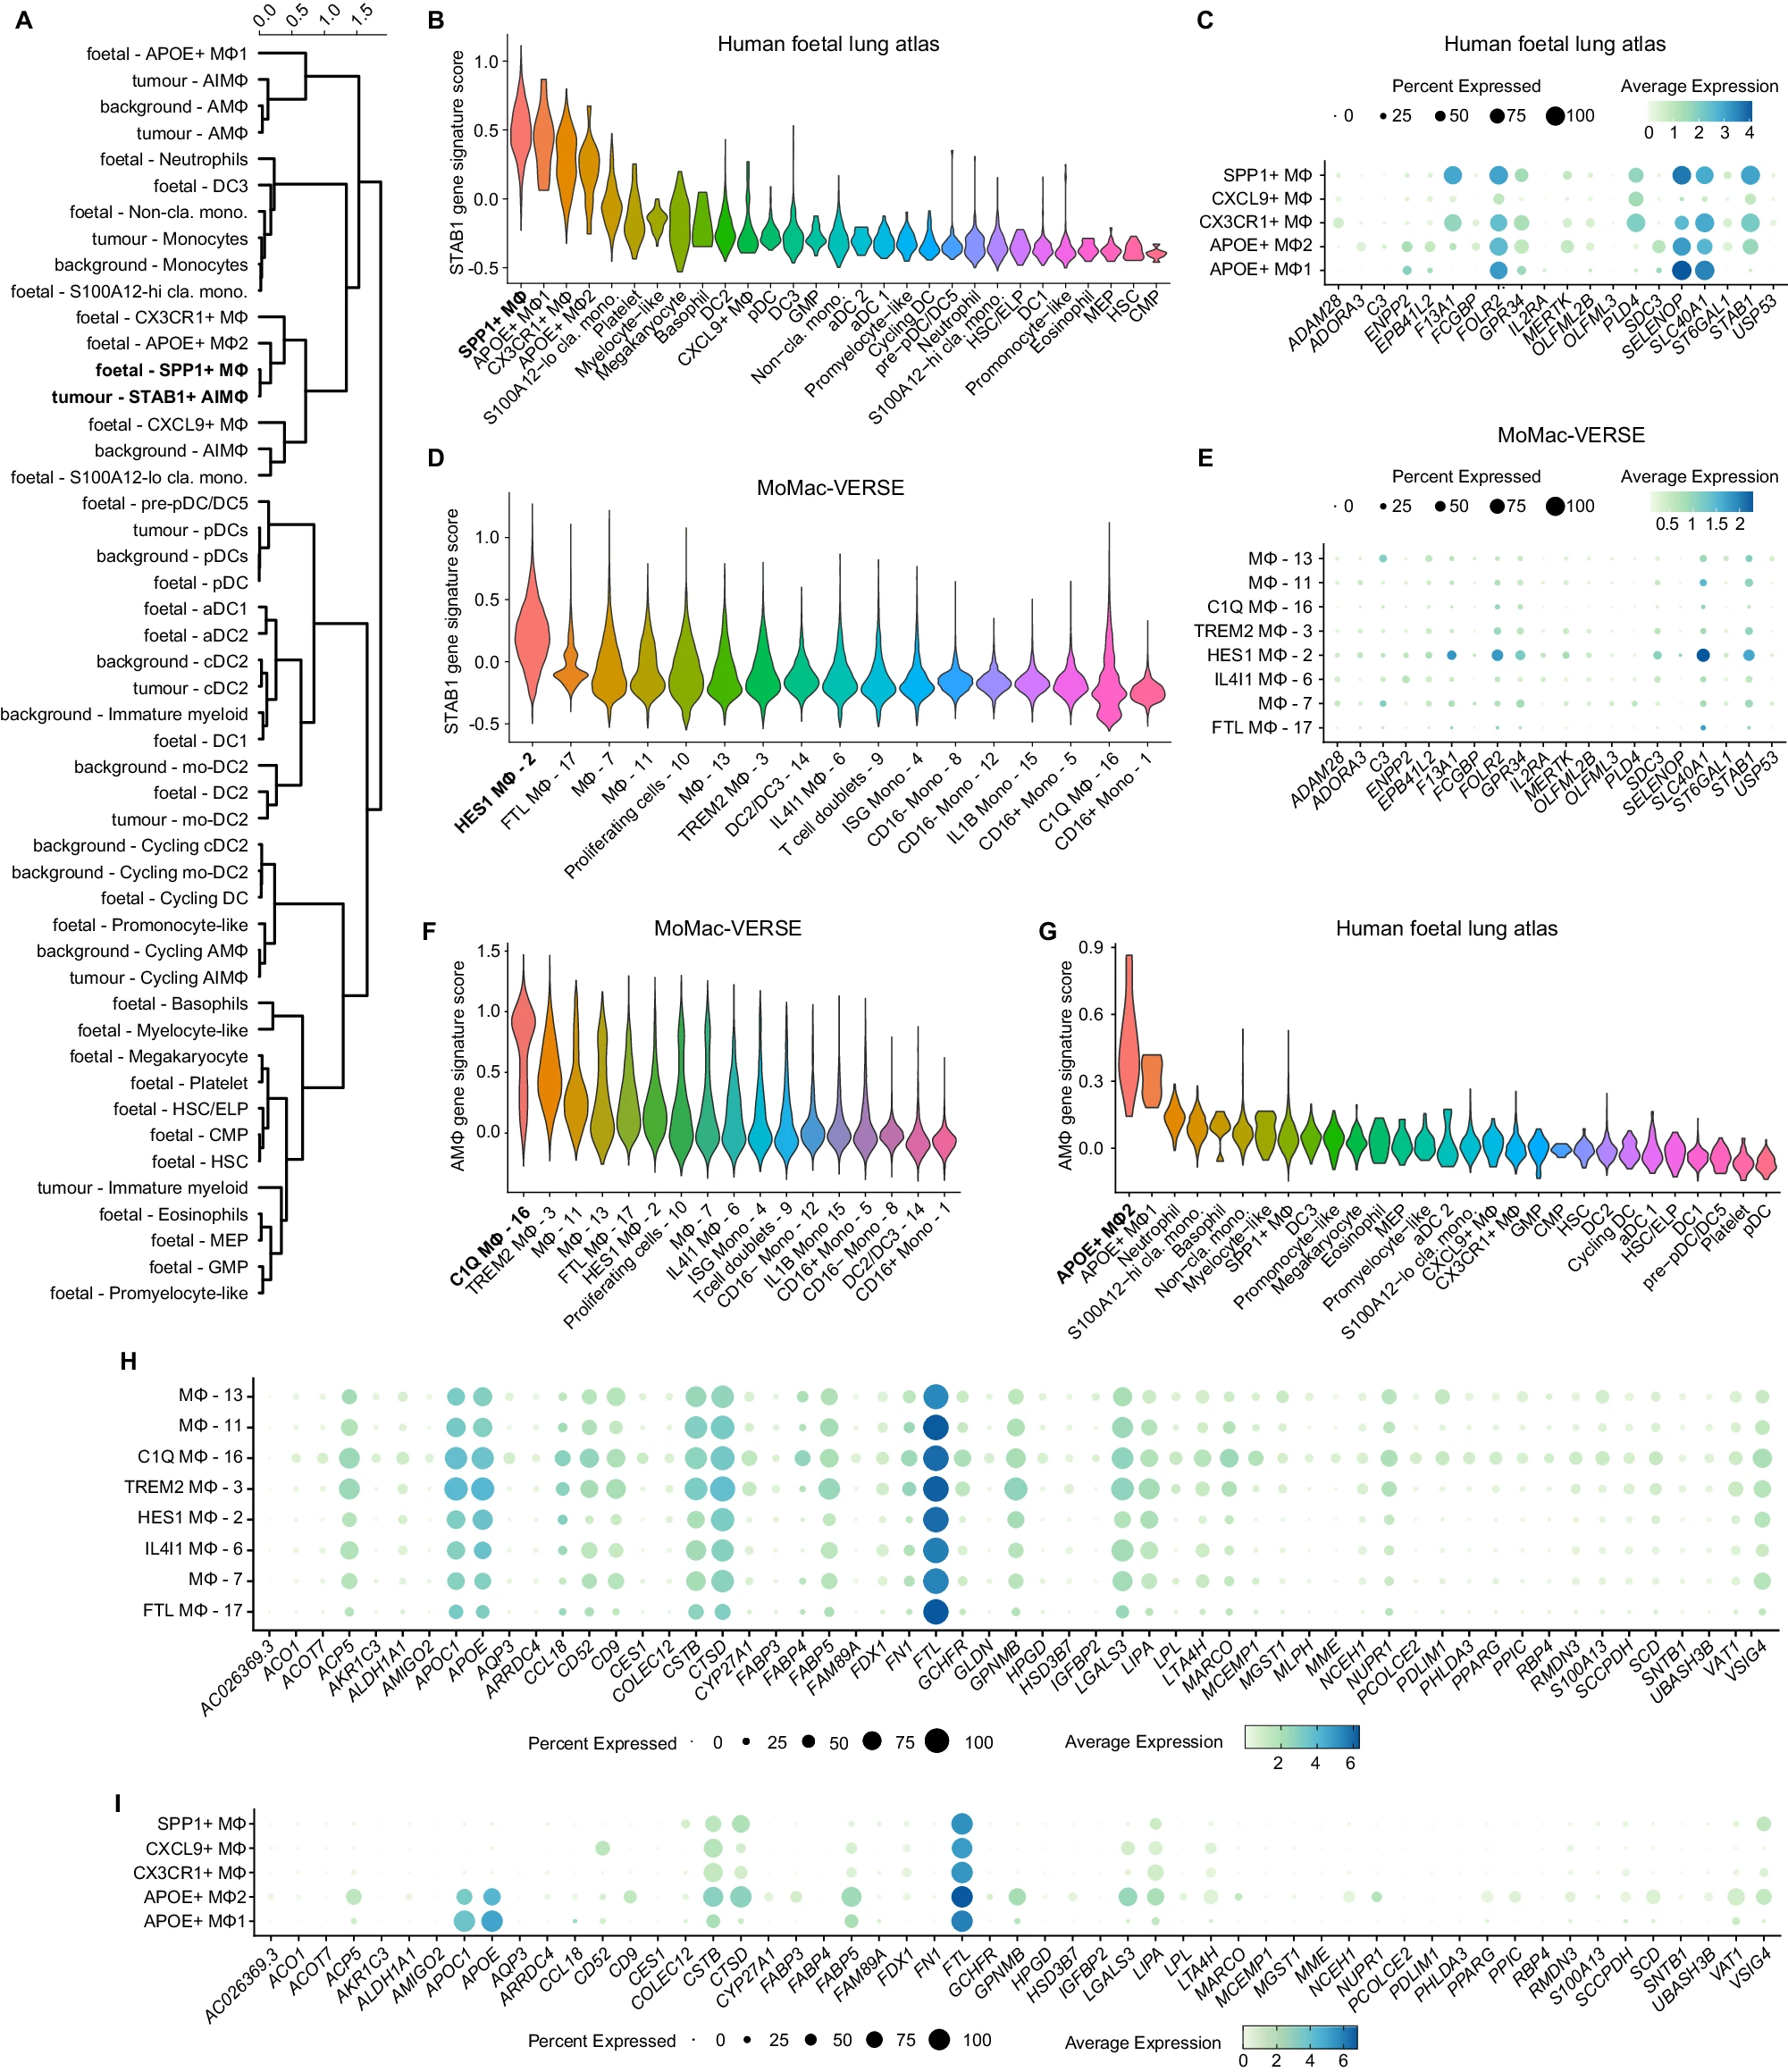
A Hierarchical clustering of the correlation distance calculated on each cell in the harmonised (tumour myeloid + background myeloid + foetal lung myeloid) PC space. B Violin plot showing the expression level of the “STAB1 gene signature” across myeloid cell and progenitor populations identified in a publicly available human foetal lung atlas. C Dotplot of the expression of each gene in the “STAB1 gene signature” in selected foetal lung macrophage populations. The size of each dot represents the percentage of cells in the cluster expressing the gene, while the colour represents the mean expression of each gene in each cluster. D Violin plot showing the expression level of the “STAB1 gene signature” across the clusters identified in the publicly available MoMac-VERSE dataset. E Dotplot of the expression of each gene in the “STAB1 gene signature” in selected macrophage populations from the MoMac-VERSE. The size of each dot represents the percentage of cells in the cluster expressing the gene, while the colour represents the mean expression of each gene in each cluster. F Violin plot showing the expression level of the “AMɸ gene signature” across myeloid cell and progenitor populations identified in the publicly available “MoMac-VERSE” dataset. G Violin plot showing the expression level of the “AMɸ gene signature” across myeloid cell and progenitor populations identified in a publicly available human foetal lung atlas. H Dotplot of the expression of each gene in the “AMɸ gene signature” in selected macrophages populations identified in the “MoMac-VERSE” dataset. The size of each dot represents the percentage of cells in the cluster expressing the gene, while the colour represents the mean expression of each gene in each cluster. I Dotplot of the expression of each gene in the “AMɸ gene signature” in selected foetal lung macrophage populations. The size of each dot represents the percentage of cells in the cluster expressing the gene, while the colour represents the mean expression of each gene in each cluster.
