
Fig. 2: The descriptions of different stromal subsets in the neonatal uterus.
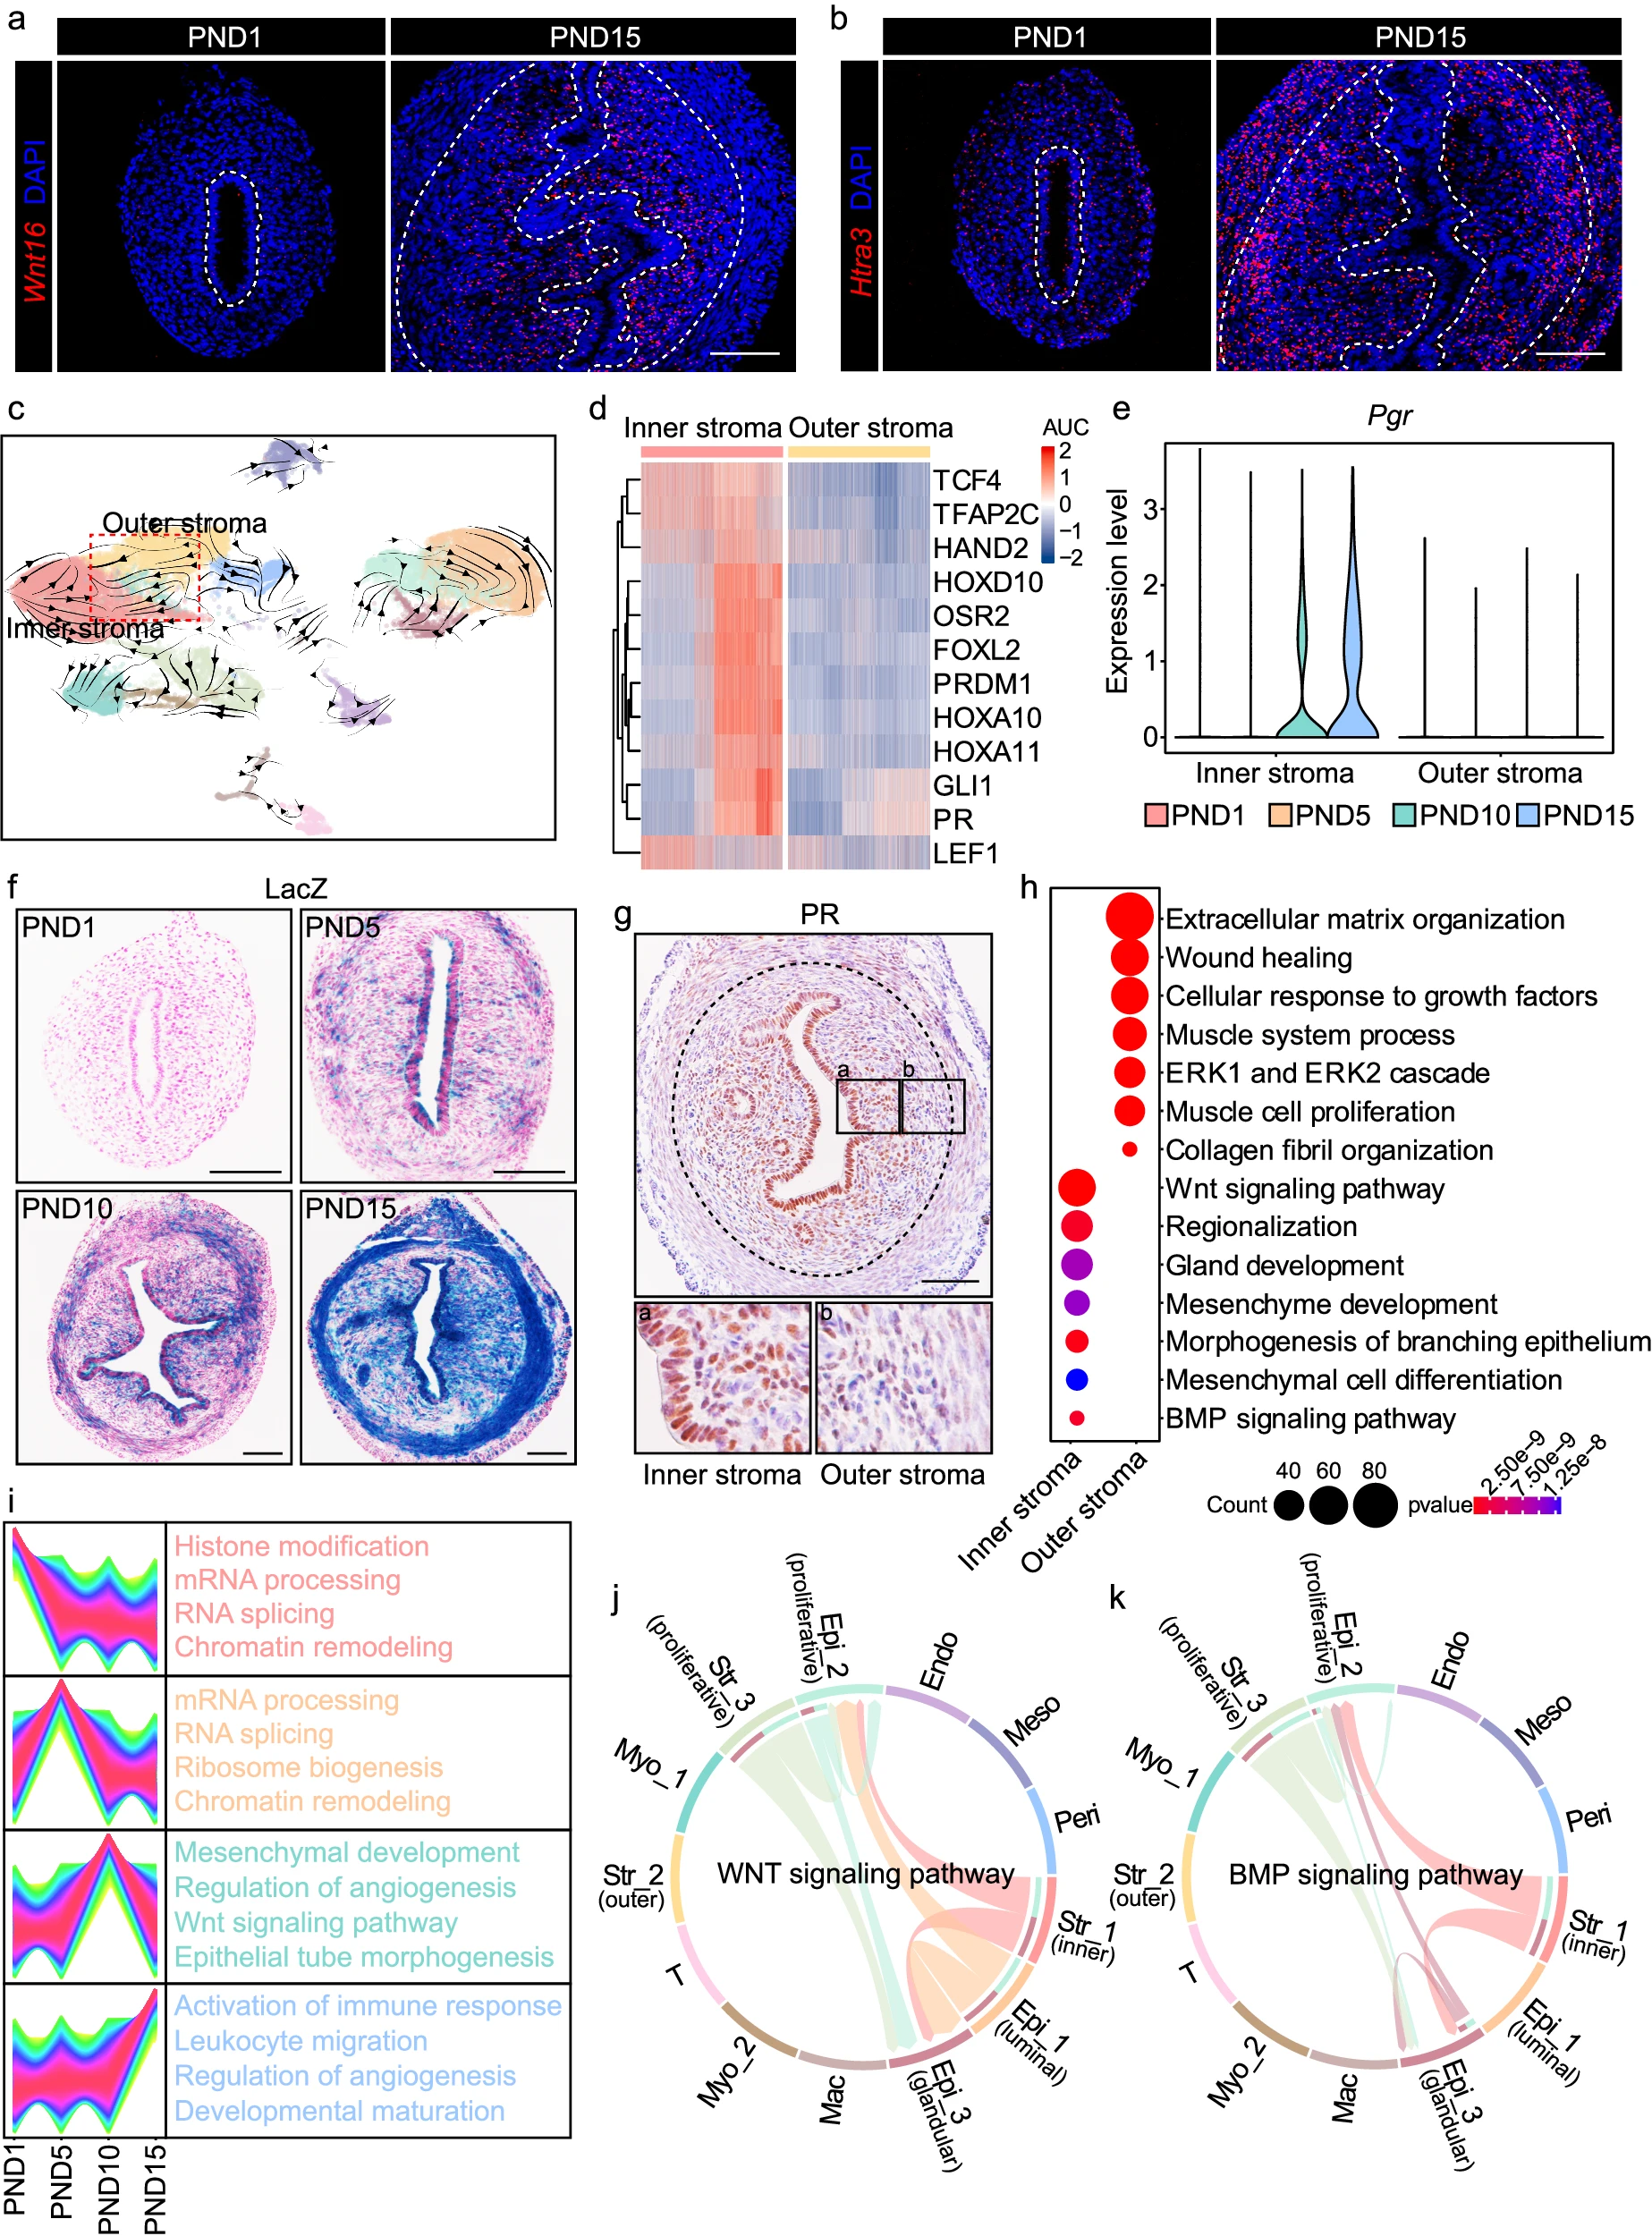
a, b SCRINSHOT analysis of Wnt16 (a) and Htra3 (b) in the uteri on PND1 and PND15. Dash lines represent the boundary between the epithelium and the stroma, as well as the stroma and the myometrium. Scale bar: 100 μm. c Visualization of RNA velocity analysis. d Heatmap showing the top-ranked regulons in inner stromal cells according to SCENIC analysis. e Violin plot displaying the expression level of Pgr in the inner and outer stroma throughout postnatal uterine development. f LacZ staining showing the expression pattern of Pgr in the uteri on PND1, PND5, PND10, and PND15. Scale bar: 100 μm. g IHC analysis of PR in the uteri on PND15. Dash lines represent the boundary between the stroma and the myometrium. Scale bar: 100 μm. h GO enrichment analysis of the highly expressed genes in the inner and outer stroma. Significance is based on over-representation analysis with clusterProfiler. i Gene expression clustering analysis and GO analysis of inner stromal cells at different time points. j, k CellChat analysis indicating the WNT (j) and BMP (k) signaling pathways among stromal cells and epithelial cells.
