
Fig. 3: Uterine-specific ablation of Pr-set7 resulted in hampered stromal growth due to massive cell death.
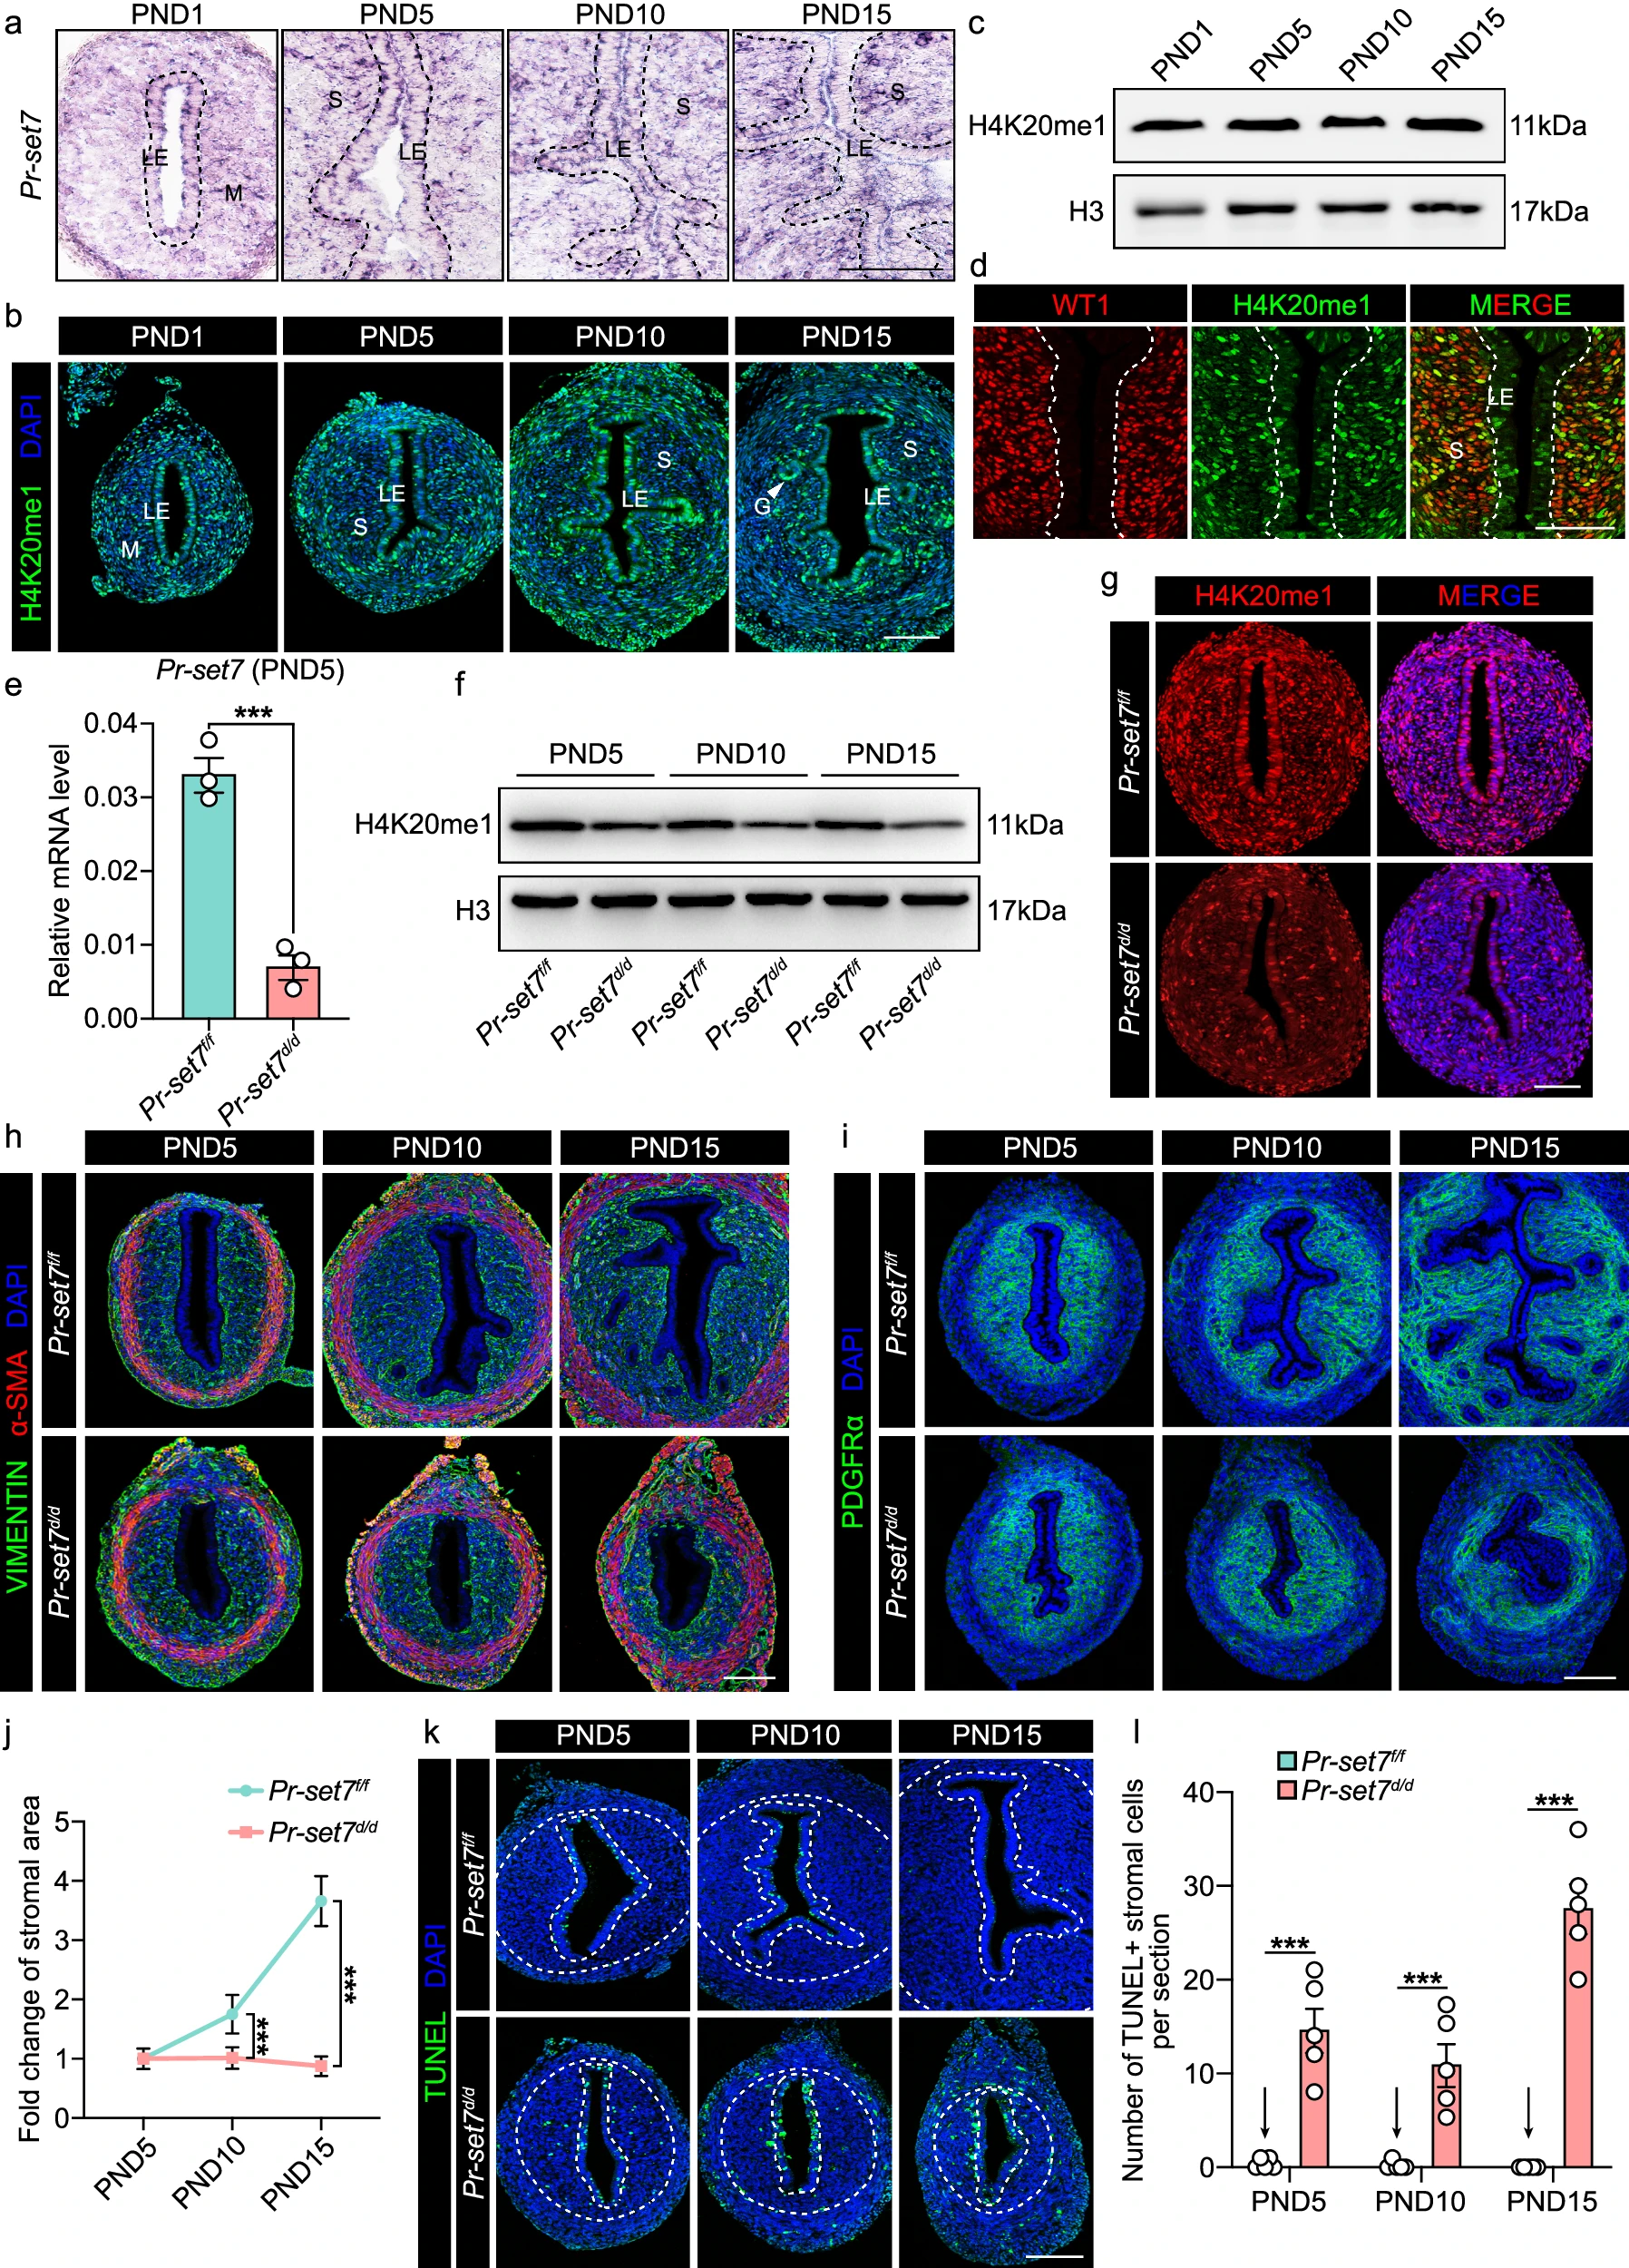
a ISH analysis of Pr-set7 in the uteri on PND1, PND5, PND10, and PND15. Dash lines represent the boundary between the epithelium and the stroma. LE luminal epithelium, M mesenchyme, S stroma. Scale bar: 100 μm. b IF analysis of H4K20me1 in the uteri on PND1, PND5, PND10, and PND15. LE luminal epithelium, M mesenchyme, S stroma, GE glandular epithelium. Scale bar: 100 μm. c WB analysis of H4K20me1 in the uteri on PND1, PND5, PND10, and PND15. H3 served as a loading control. d Co-staining of H4K20me1 and WT1 in the uterus. LE luminal epithelium, S stroma. Dash lines represent the boundary between the epithelium and the stroma. Scale bar: 100 μm. e QRT-PCR analysis of Pr-set7 mRNA level in Pr-set7f/f (n = 3 mice) and Pr-set7d/d (n = 3 mice) uteri on PND5. The values were normalized to the Gapdh level. Data are presented as mean ± SEM. Two-tailed unpaired Student’s t-test. ***p = 0.0008. f WB analysis of H4K20me1 in Pr-set7f/f and Pr-set7d/d uteri on PND5, PND10 and PND15. H3 was used as a loading control. g IF analysis of H4K20me1 in Pr-set7f/f and Pr-set7d/d uteri on PND5. Scale bar: 100 μm. h IF analysis of VIMENTIN and α-SMA in Pr-set7f/f and Pr-set7d/d uteri on PND5, PND10 and PND15. Scale bar: 100 μm. i IF analysis of PDGFRα in Pr-set7f/f and Pr-set7d/d uteri on PND5, PND10 and PND15. Scale bar: 100 μm. j Fold change of stromal area in Pr-set7f/f (n = 5 mice) and Pr-set7d/d (n = 5 mice) uteri on PND5, PND10, and PND15. Data are presented as mean ± SEM. Two-tailed unpaired Student’s t-test. ***p = 0.0001 (PND10), ***p = 4e-15 (PND15). k TUNEL analysis of the Pr-set7f/f and Pr-set7d/d uteri on PND5, PND10 and PND15. Dash lines represent the boundary between the epithelium and the stroma, as well as the stroma and the myometrium. Scale bar: 100 μm. l Number of TUNEL+ stromal cells per section in the Pr-set7f/f (n = 5 mice) and Pr-set7d/d (n = 5 mice) uteri on PND5, PND10 and PND15. Data are presented as mean ± SEM. Two-tailed unpaired Student’s t-test. ***p = 4e-6 (PND5), ***p = 0.0002 (PND10), ***p = 5e-11 (PND15). Source data are provided as a Source Data file.
