
Fig. 6: H4K20me1 repressed the expression of ISGs in both direct and indirect manners.
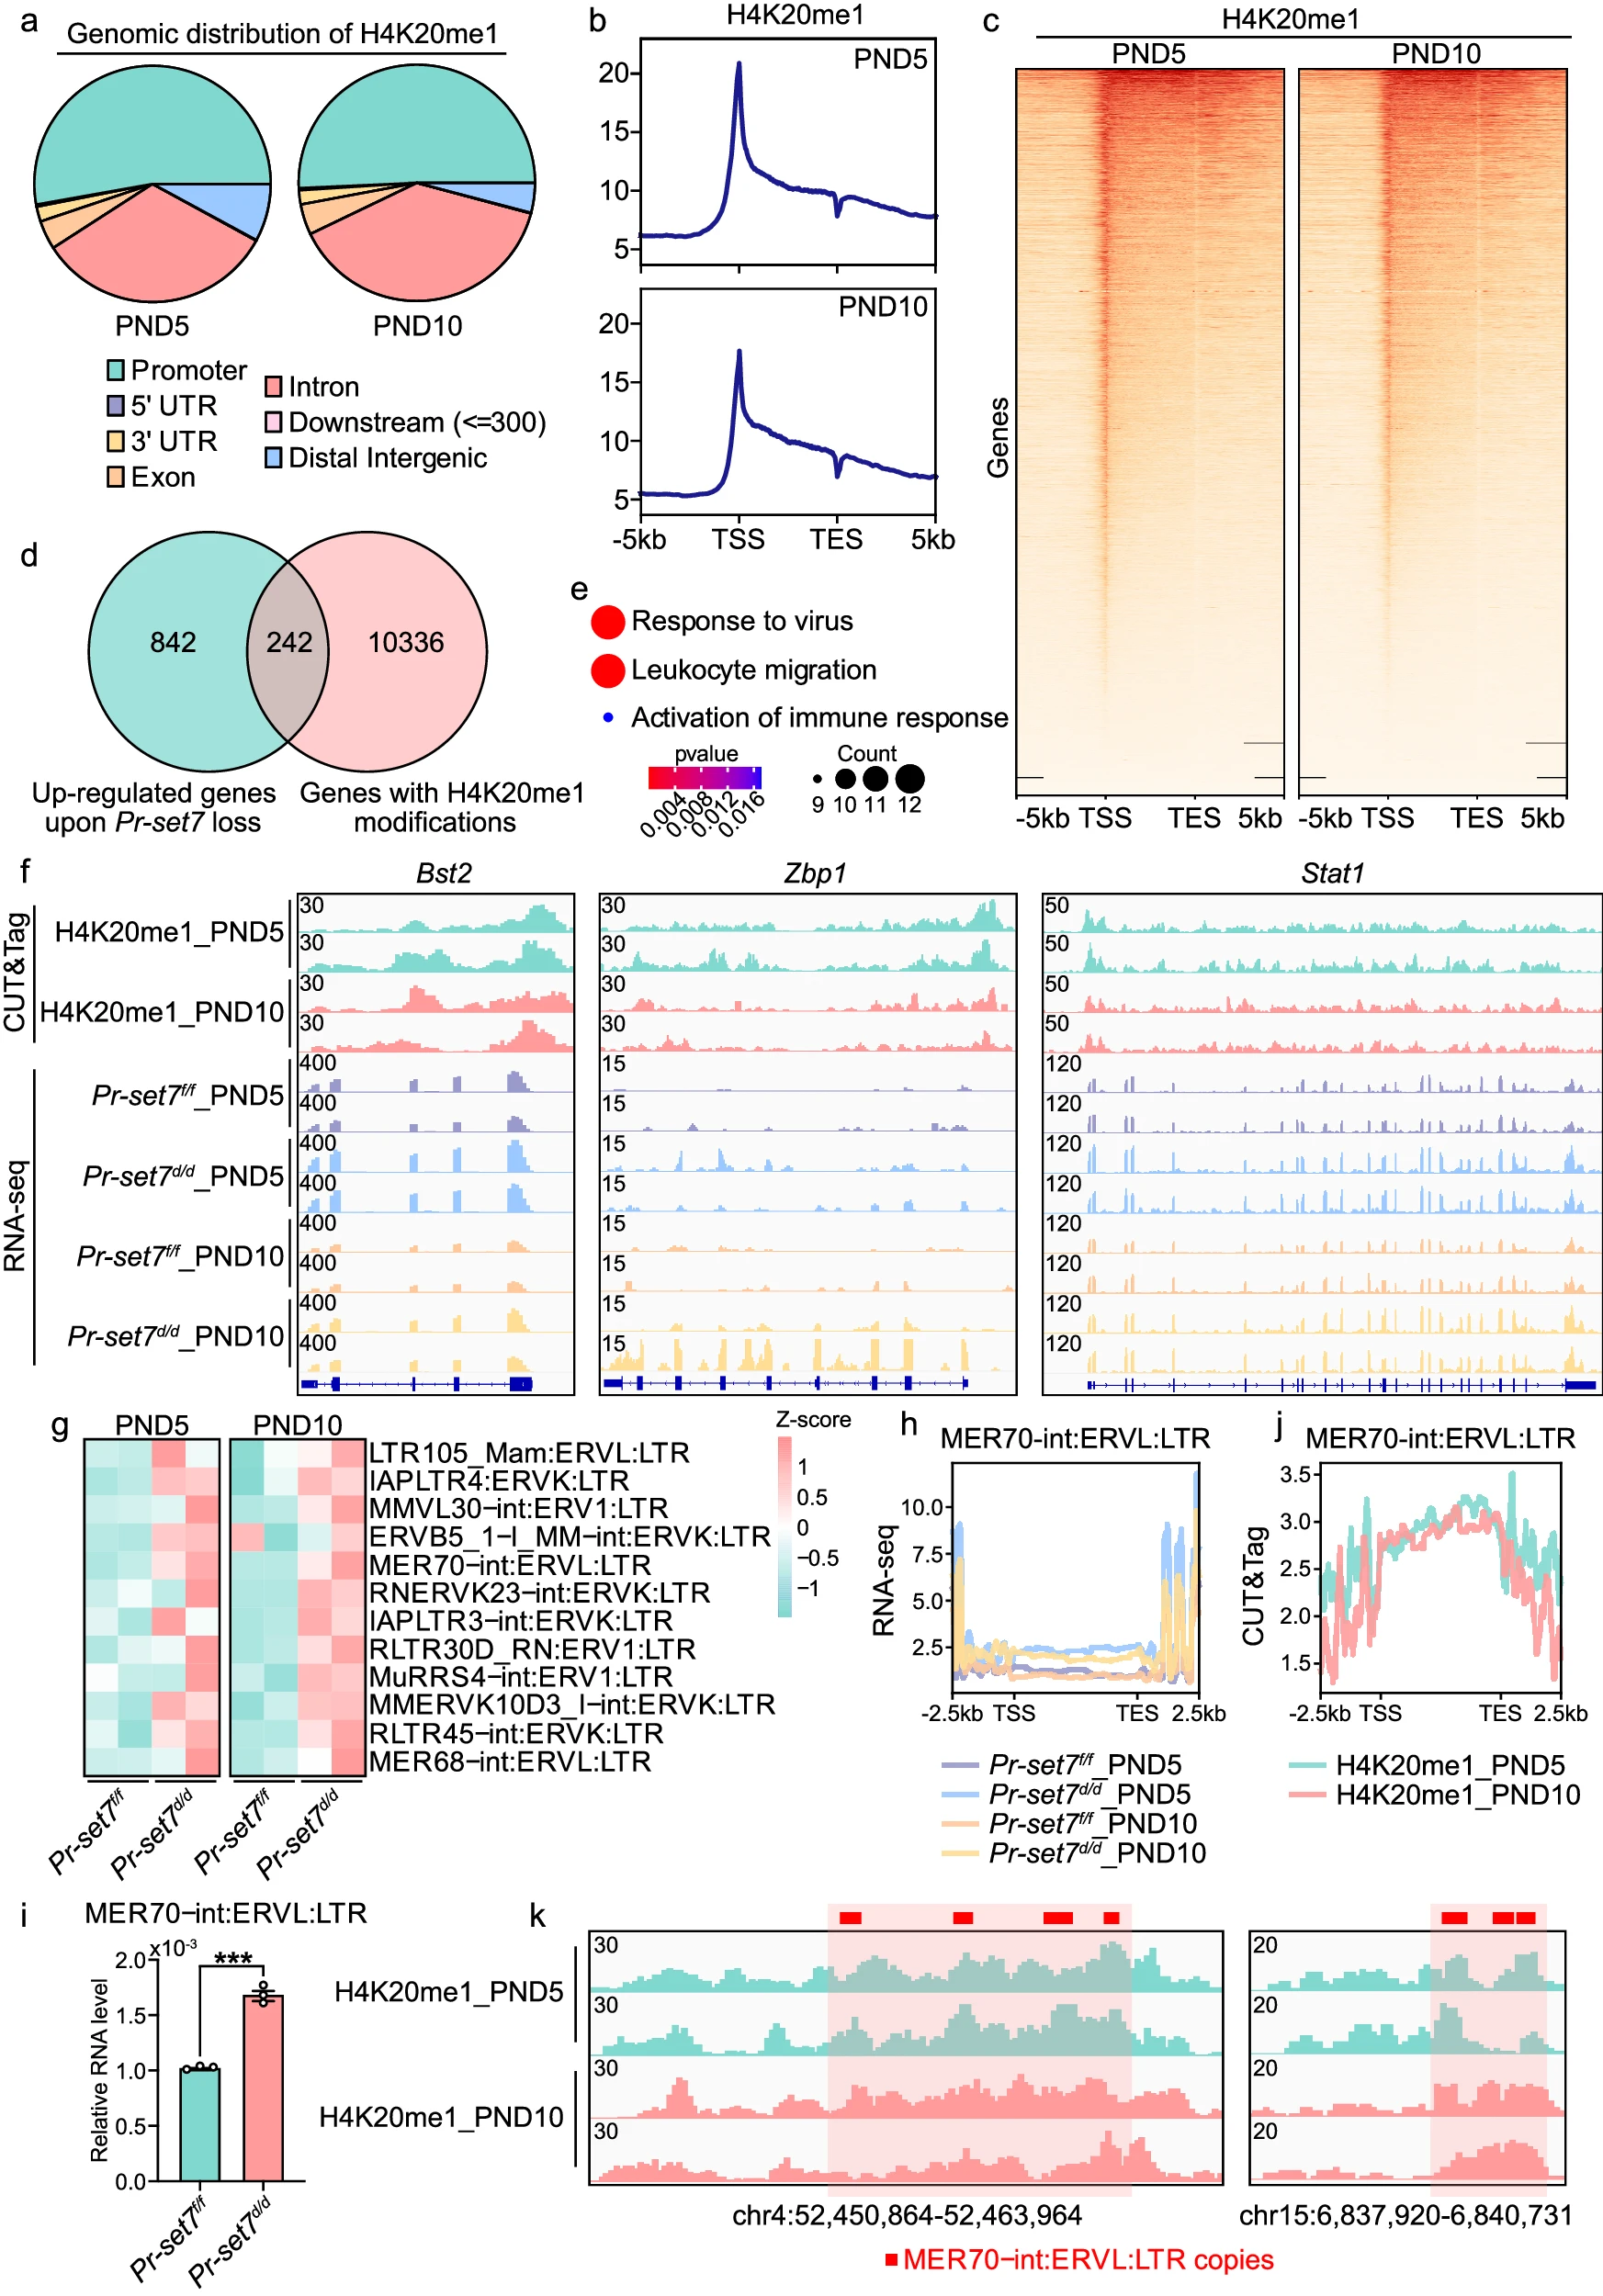
a Pie chart displaying the genomic distribution of H4K20me1. b Profile plot showing the distribution of normalized H4K20me1 CUT&Tag signals. TSS, transcription start site; TES, transcription end site. c Heatmap indicating the distribution of normalized H4K20me1 CUT&Tag signals. TSS, transcription start site; TES, transcription end site. d Venn diagram showing the upregulated genes upon PR-SET7 loss (n = 1084) and genes with H4K20me1 modifications (n = 10578). e GO enrichment analysis of genes that were directly suppressed by H4K20me1. Significance is based on over-representation analysis with clusterProfiler. f Genome browser view of normalized H4K20me1 CUT&Tag signals as well as Pr-set7f/f and Pr-set7d/d RNA-seq signals on a portion of ISGs that were upregulated upon Pr-set7 ablation and possessed H4K20me1 occupancy. g Heatmap indicating the abnormally upregulated ERVs due to PR-SET7 abrogation on PND5 and PND10. h Profile plot showing Pr-set7f/f and Pr-set7d/d RNA-seq signals on the body region of MER70-int:ERVL:LTR. TSS, transcription start site; TES, transcription end site. i QRT-PCR analysis of MER70-int:ERVL:LTR level in Pr-set7f/f (n = 3 mice) and Pr-set7d/d (n = 3 mice) uteri on PND5. The values were normalized to Gapdh level. Data are presented as mean +/- SEM. Two-tailed unpaired Student’s t-test. ***p = 0.0002. j Profile plot showing normalized H4K20me1 CUT&Tag signals on the body region of MER70-int:ERVL:LTR. TSS, transcription start site; TES, transcription end site. k Genome browser view of normalized H4K20me1 CUT&Tag signals on MER70-int:ERVL:LTR copies. Source data are provided as a Source Data file.
