
Fig. 1: Trends in winter mean and extreme temperatures.
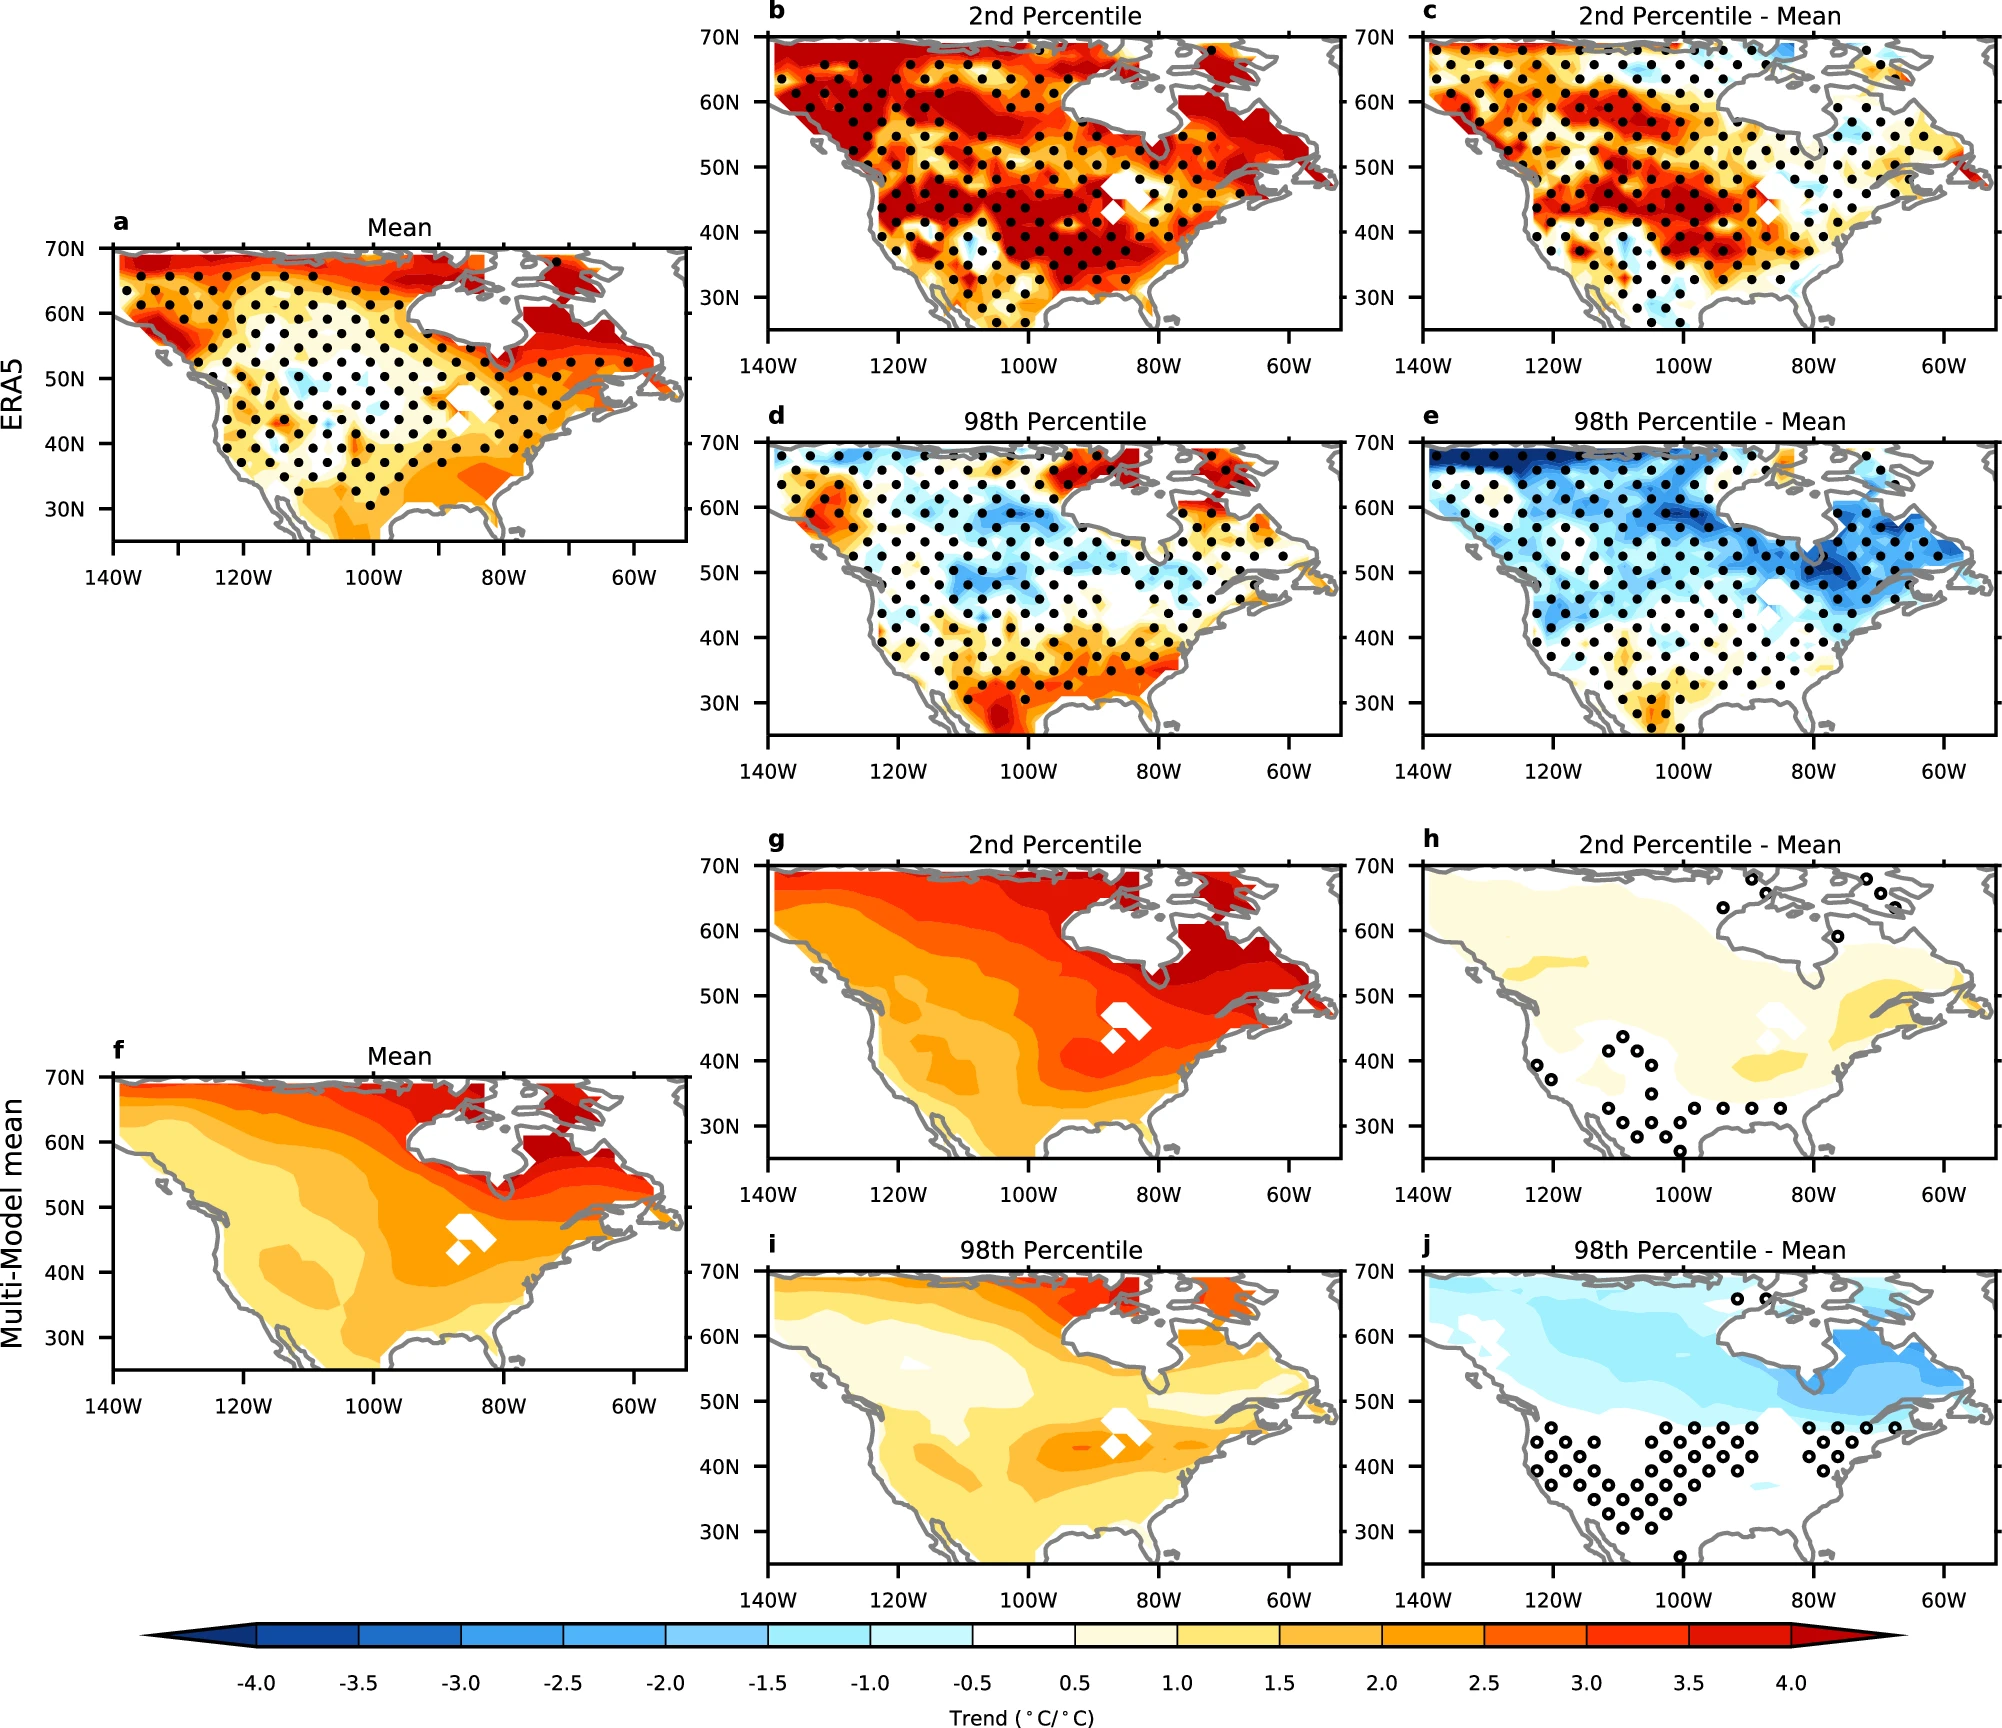
a–e The 1980–2022 winter near-surface temperature trends in ERA5 reanalysis for the mean (a), 2nd percentile (b), the difference between the 2nd percentile and the mean (c), 98th percentile (d) and the difference between the 98th percentile and the mean (e). f–j As in (a–e), but for the multi-model mean. All trends are divided by the corresponding global, annual, and mean temperature trends so that the units of the trends are °C per °C of global warming. The stippling in (a–e) represents where the ERA5 trends are not statistically significant using a bootstrap approach after controlling for the false discovery rate of 0.1. The stippling in (f–j) indicates where more than one of the models disagrees with the sign of the trend in the ensemble mean.
