
Fig. 3: Density functional theory (DFT) calculations of CO2 hydrogenation on the FeS and Mn-doped FeS (100) surfaces.
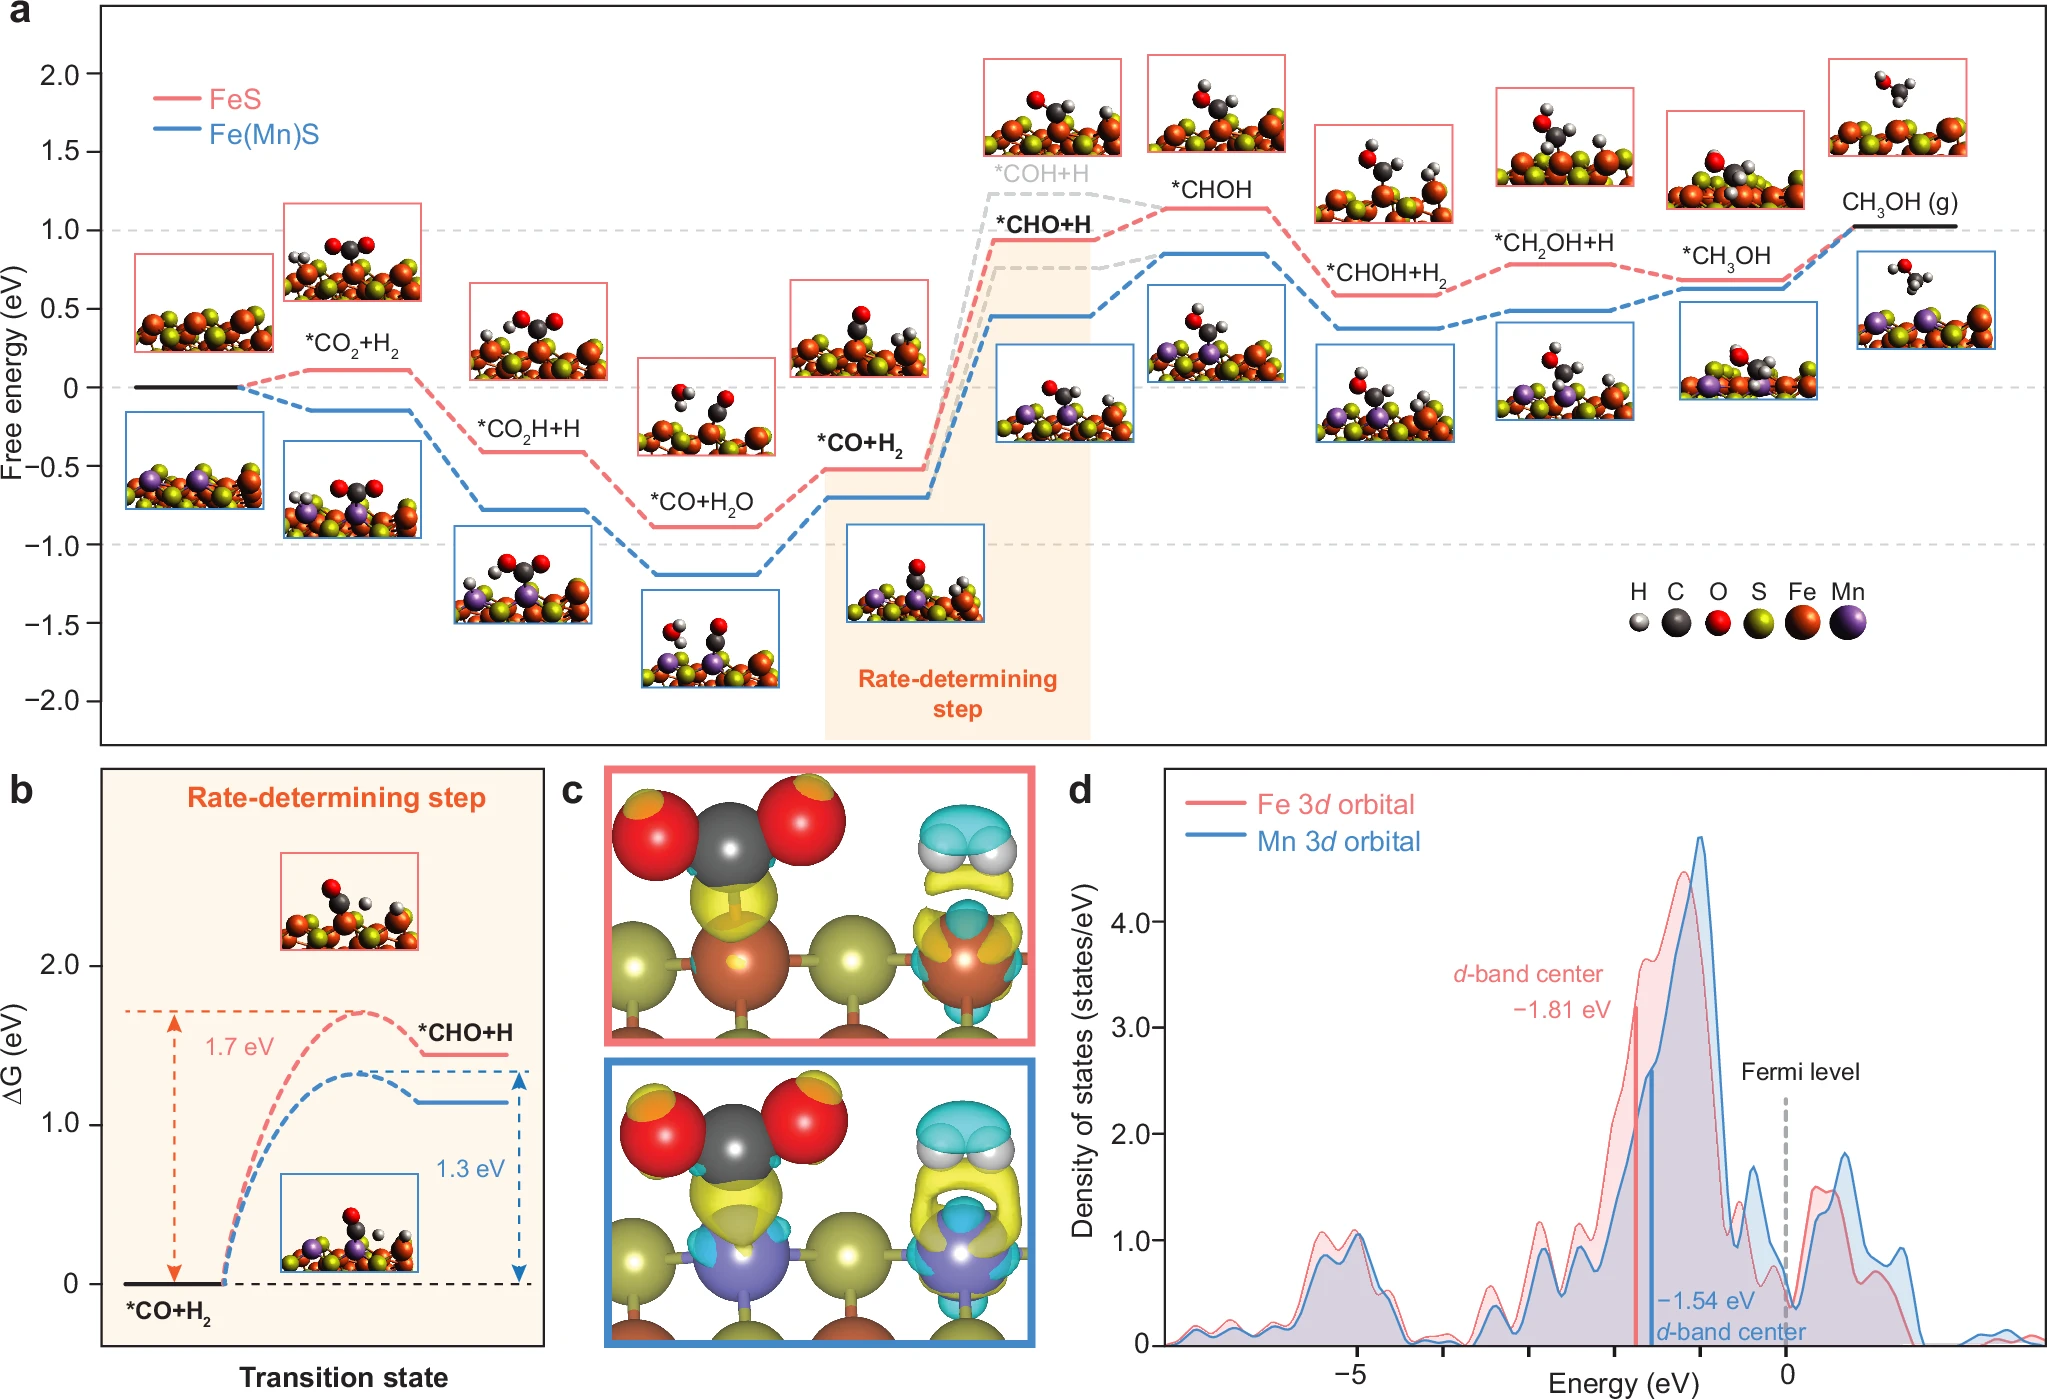
a Gibbs free energy diagram of the reaction steps and corresponding optimized structures. b Transition states of the rate-determining step. c Calculated charge density differences (CDD) between pure FeS (upper) and Mn-doped FeS (lower) upon adsorption of CO2 and H2. Yellow represents electron accumulation, and cyan denotes electron depletion. d Calculated density of states (DOS) of Fe and Mn sites in FeS.
