
Fig. 5: Explainability analysis.
From: Generating crossmodal gene expression from cancer histopathology improves multimodal AI predictions
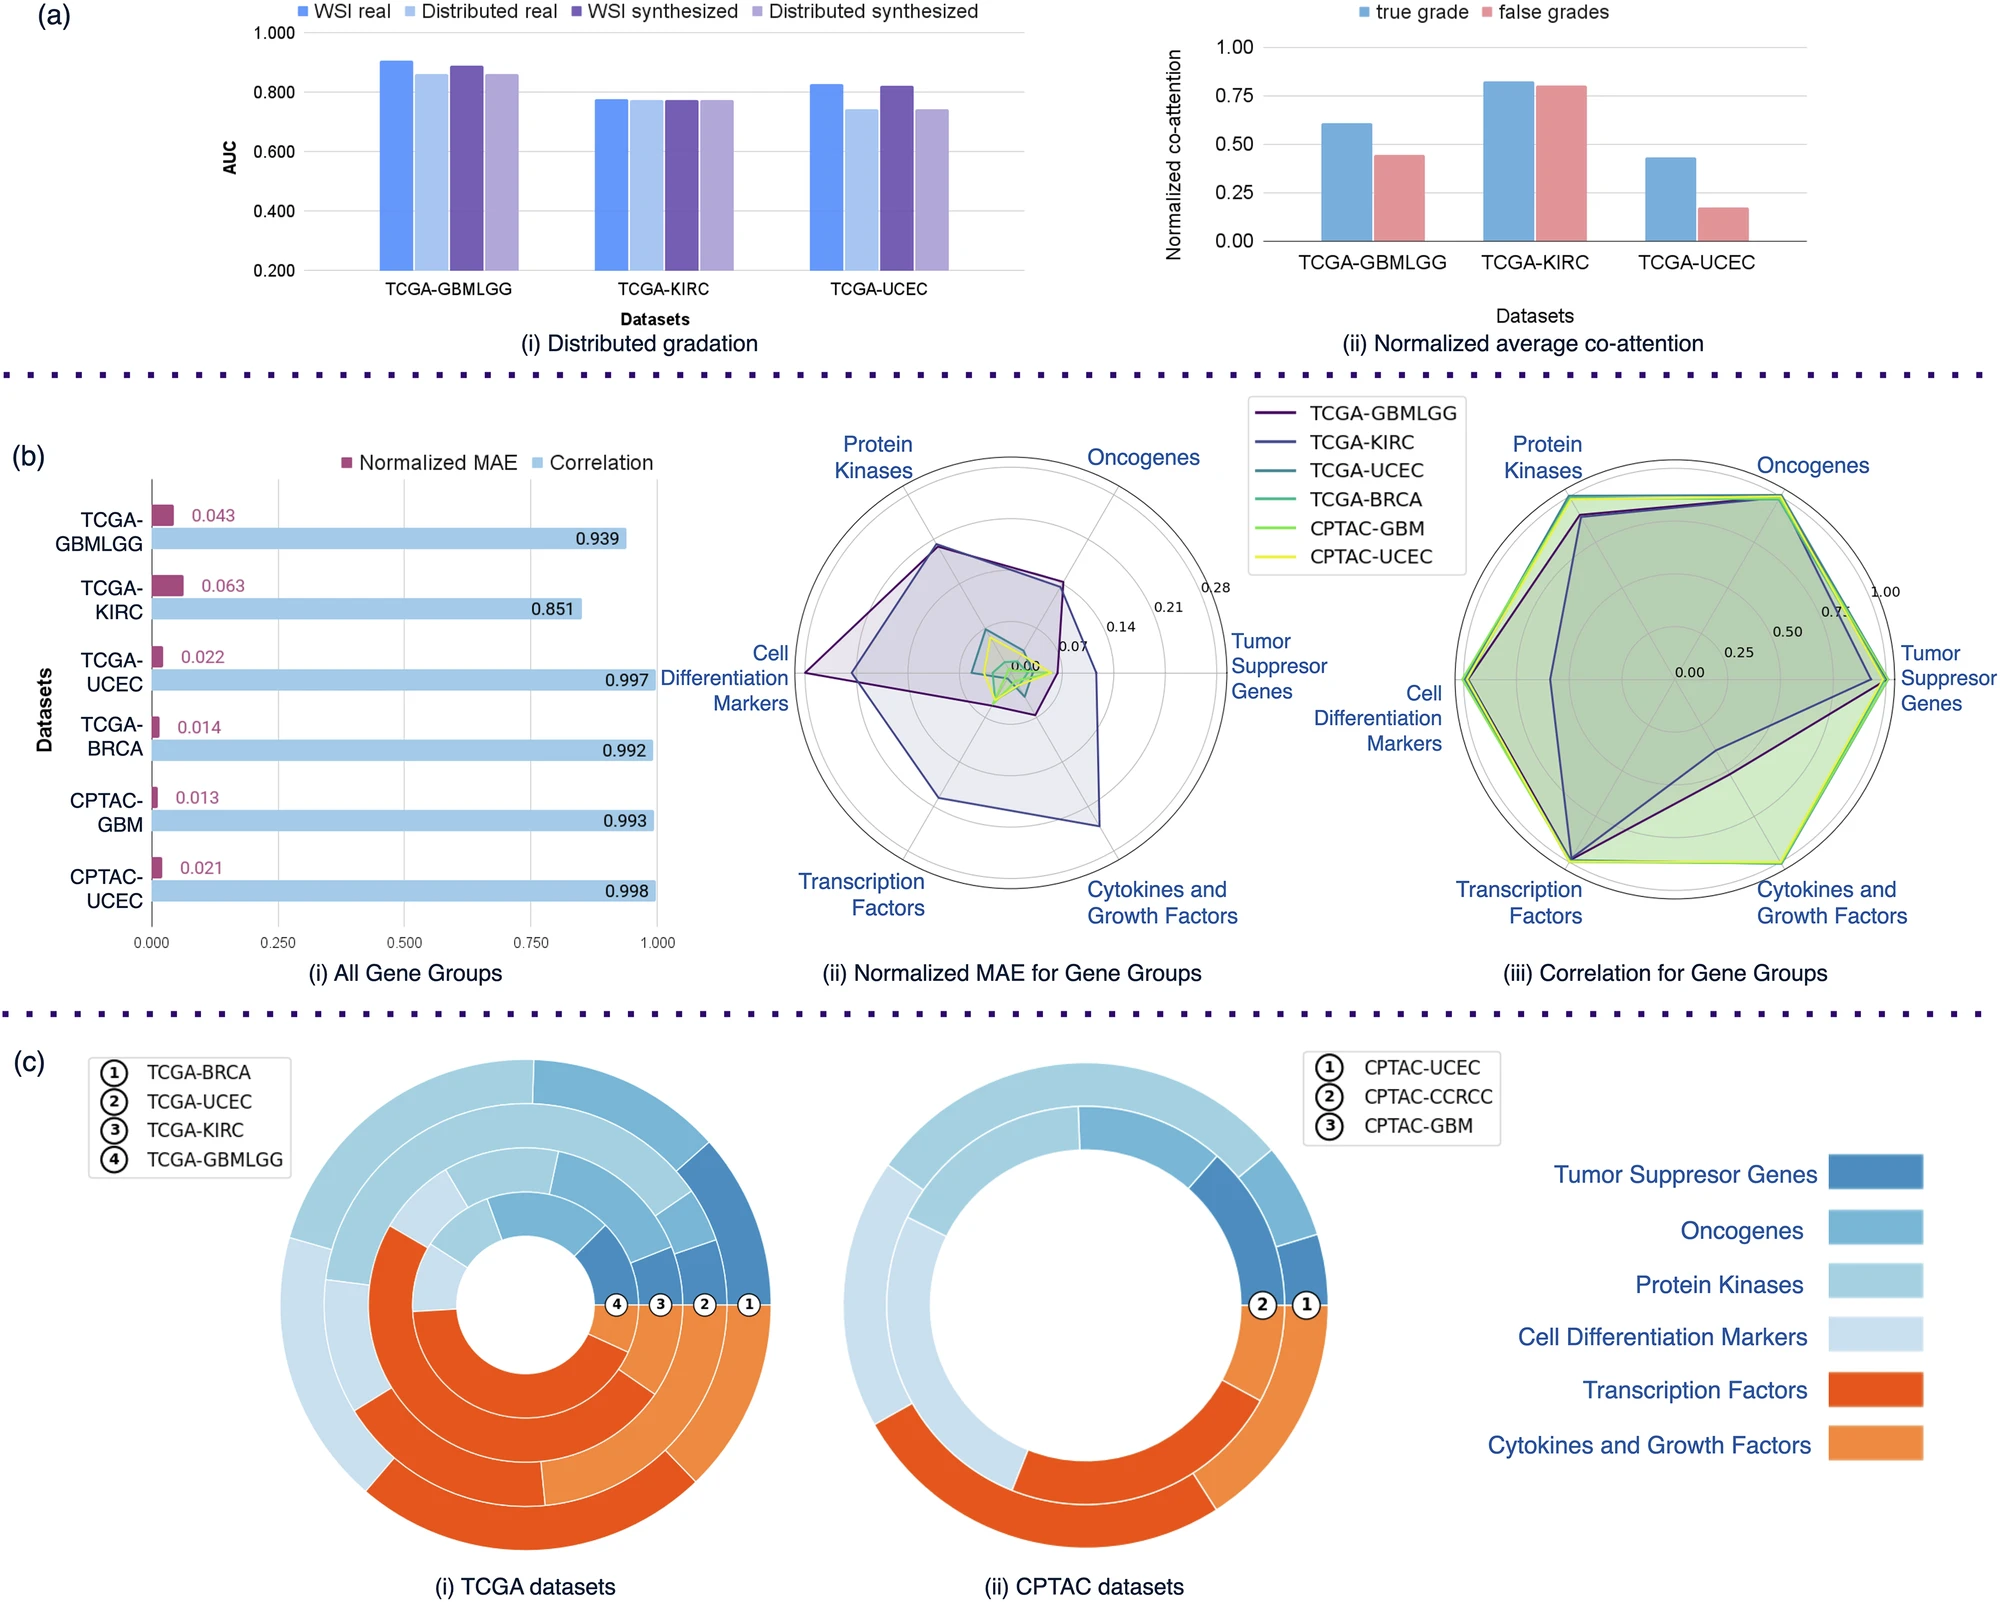
a (i) Plot for comparison between distributed and non-distributed WSI predictions for gradation using both real and synthesized transcriptomic data. (ii) Plot showing normalized average co-attention value for the true grade is higher than that of false grades. b Comparison between co-attention maps obtained using real and synthesized transcriptomic data over all genes and for different gene groups. c Plot illustrating the percentage contribution of the gene groups in co-attention for different TCGA and CPTAC data cohorts. Source data are provided as a Source Data file.
