
Fig. 3: CTS DE for PASC symptoms.
From: Molecular states during acute COVID-19 reveal distinct etiologies of long-term sequelae
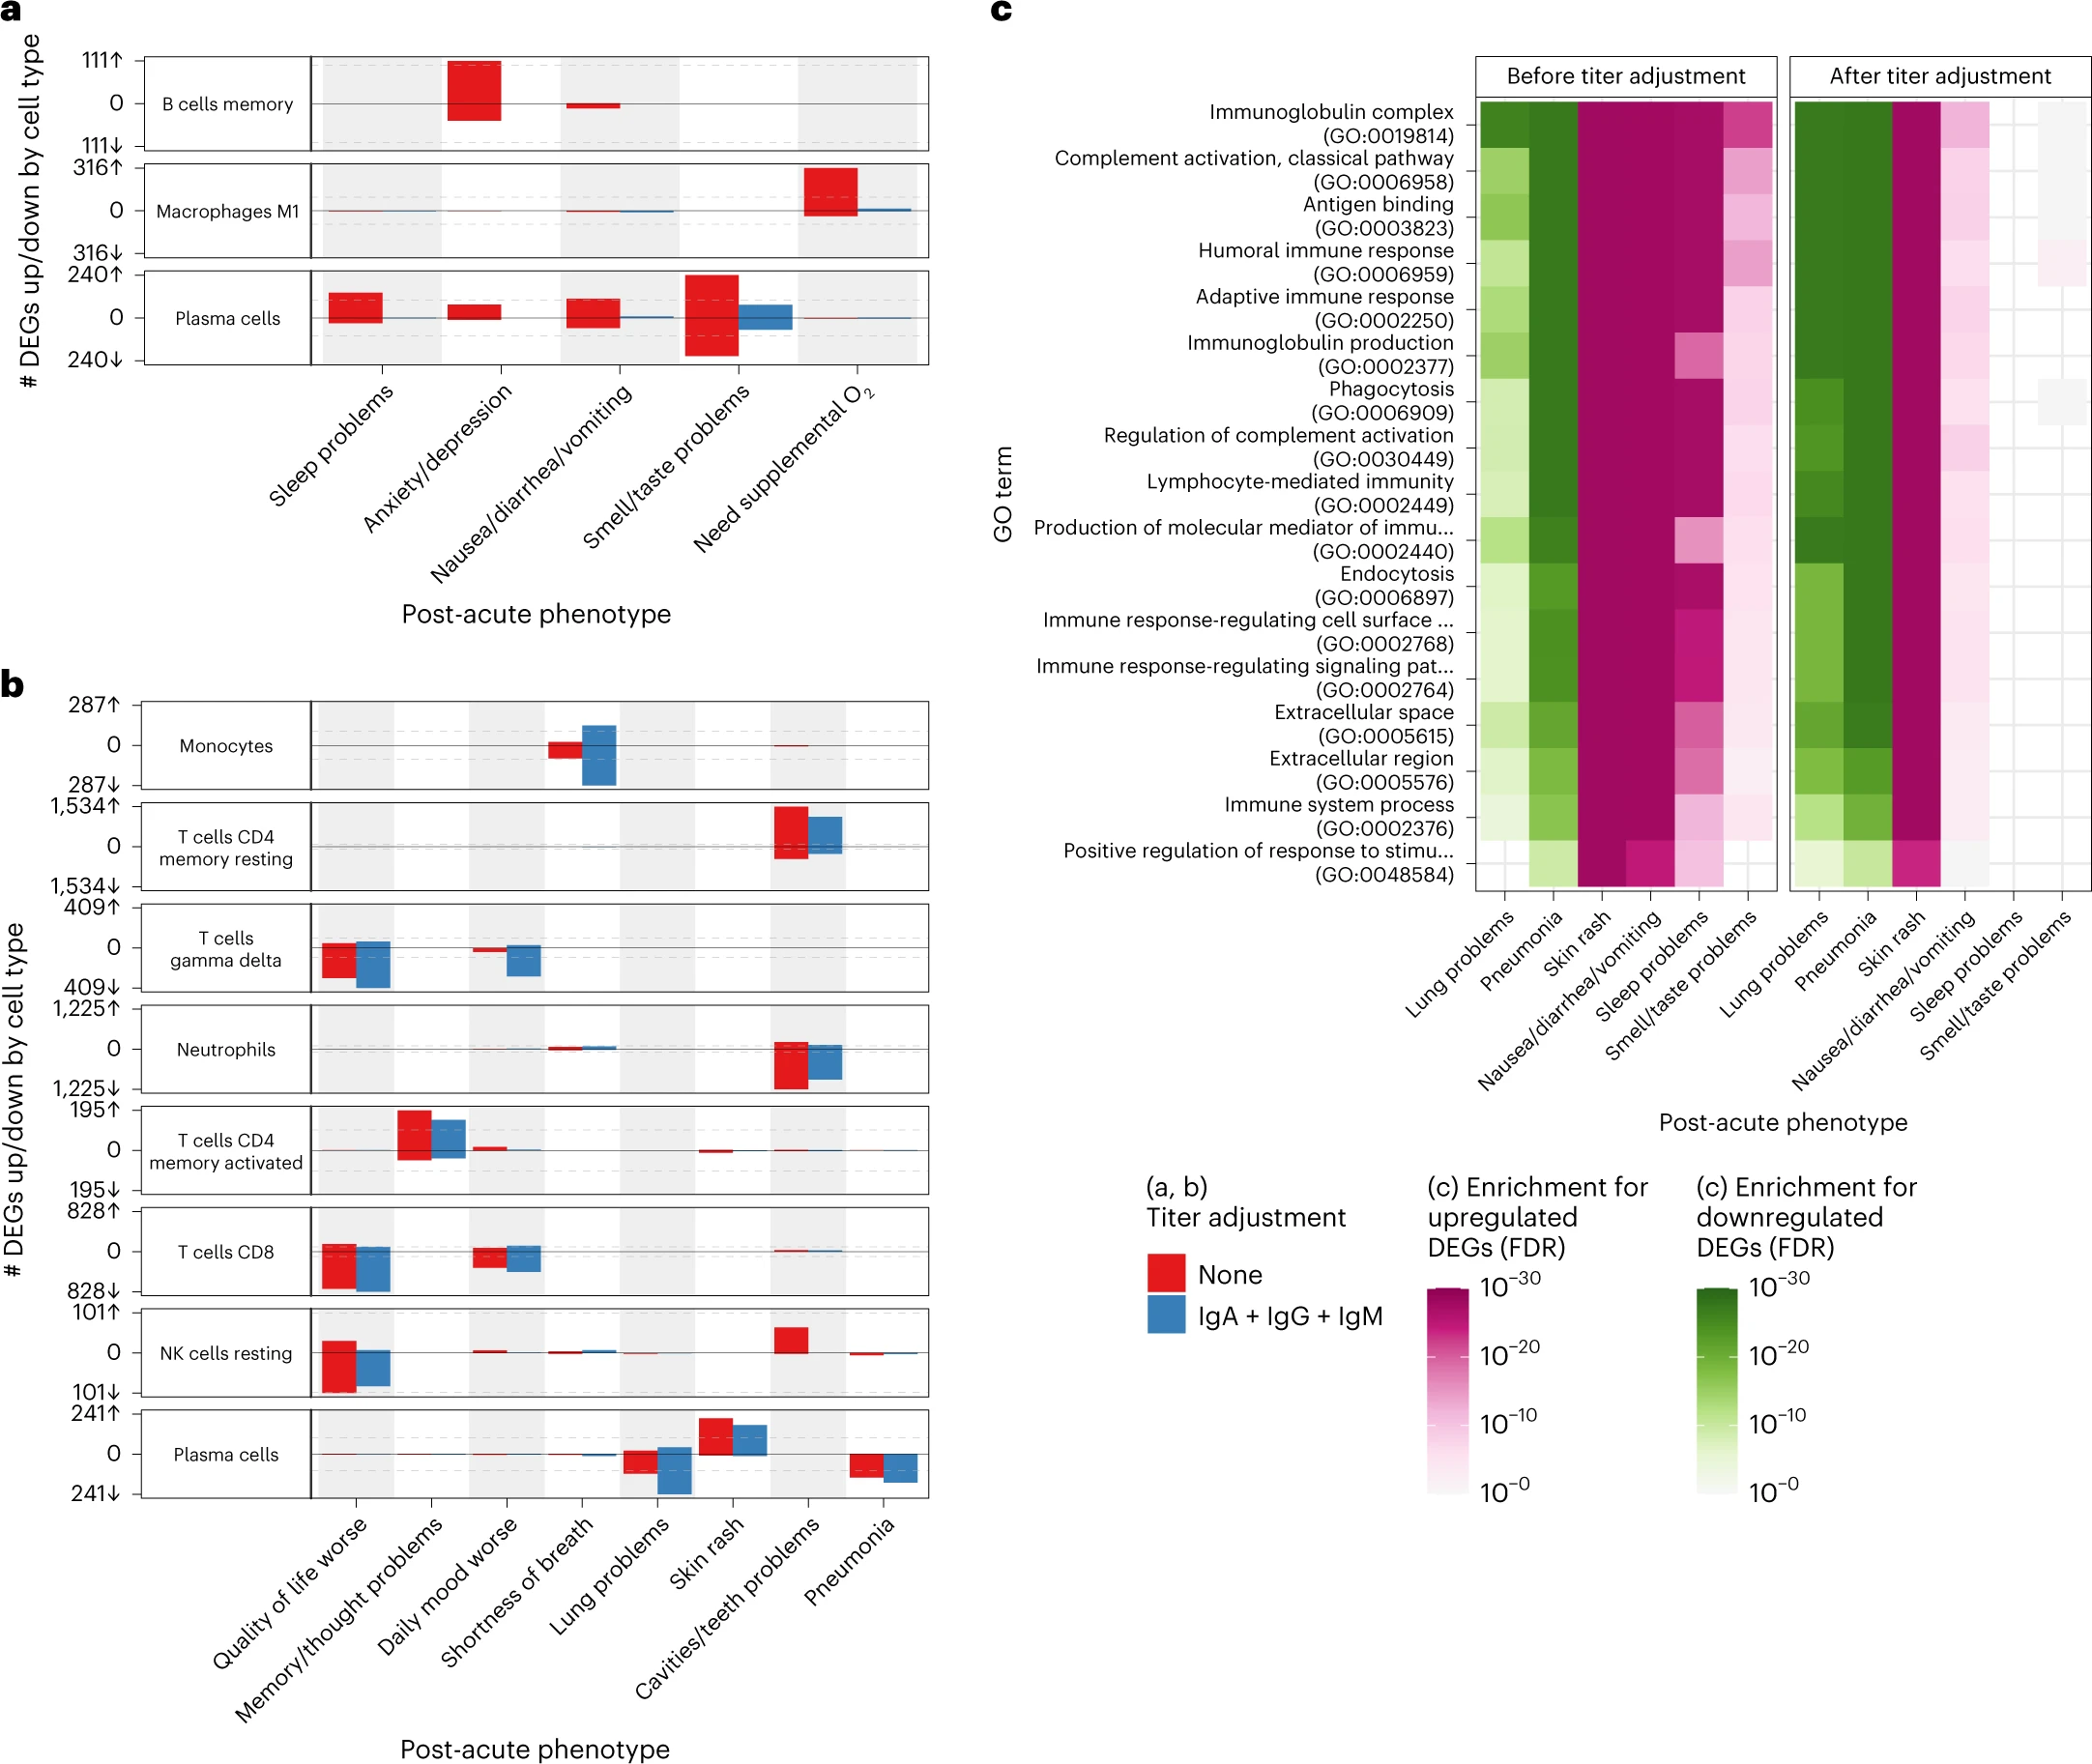
a,b, Anti-spike antibody titer-dependent (a) and titer-independent (b) CTS expression signatures. The x axes are PASC symptoms, and the y axes are the number of upregulated (up arrow) and downregulated (down arrow) DEGs at Benjamini–Hochberg FDR < 0.05. Symptoms are arranged in order of descending prevalence. Each facet presents DE results for the indicated cell type. The dashed gray lines provide a visual reference for the 100 DEG mark. The color of the bars indicates whether the signatures have been adjusted for anti-spike antibody titers. Only cell types and symptoms with more than 100 dependent/independent DEGs, respectively, are shown. c, GO term enrichments for plasma cell DEGs (one-sided Fisher’s exact tests, Benjamini–Hochberg adjustment for multiple testing). The x and y axes are the symptoms with more than 100 DEGs and GO terms, respectively. The union of the top three GO terms for all selected symptoms are shown. The color indicates the direction of the DEGs enriched for that term. Shading of color is representative of the FDR, and only FDRs < 0.05 are colored. The facets represent before (left) and after (right) controlling for anti-spike antibody titers. NK, natural killer.
