
Fig. 2: Evaluation of the impact of corticosteroid treatment on the 28-day mortality rates of patients classified as CTSs.
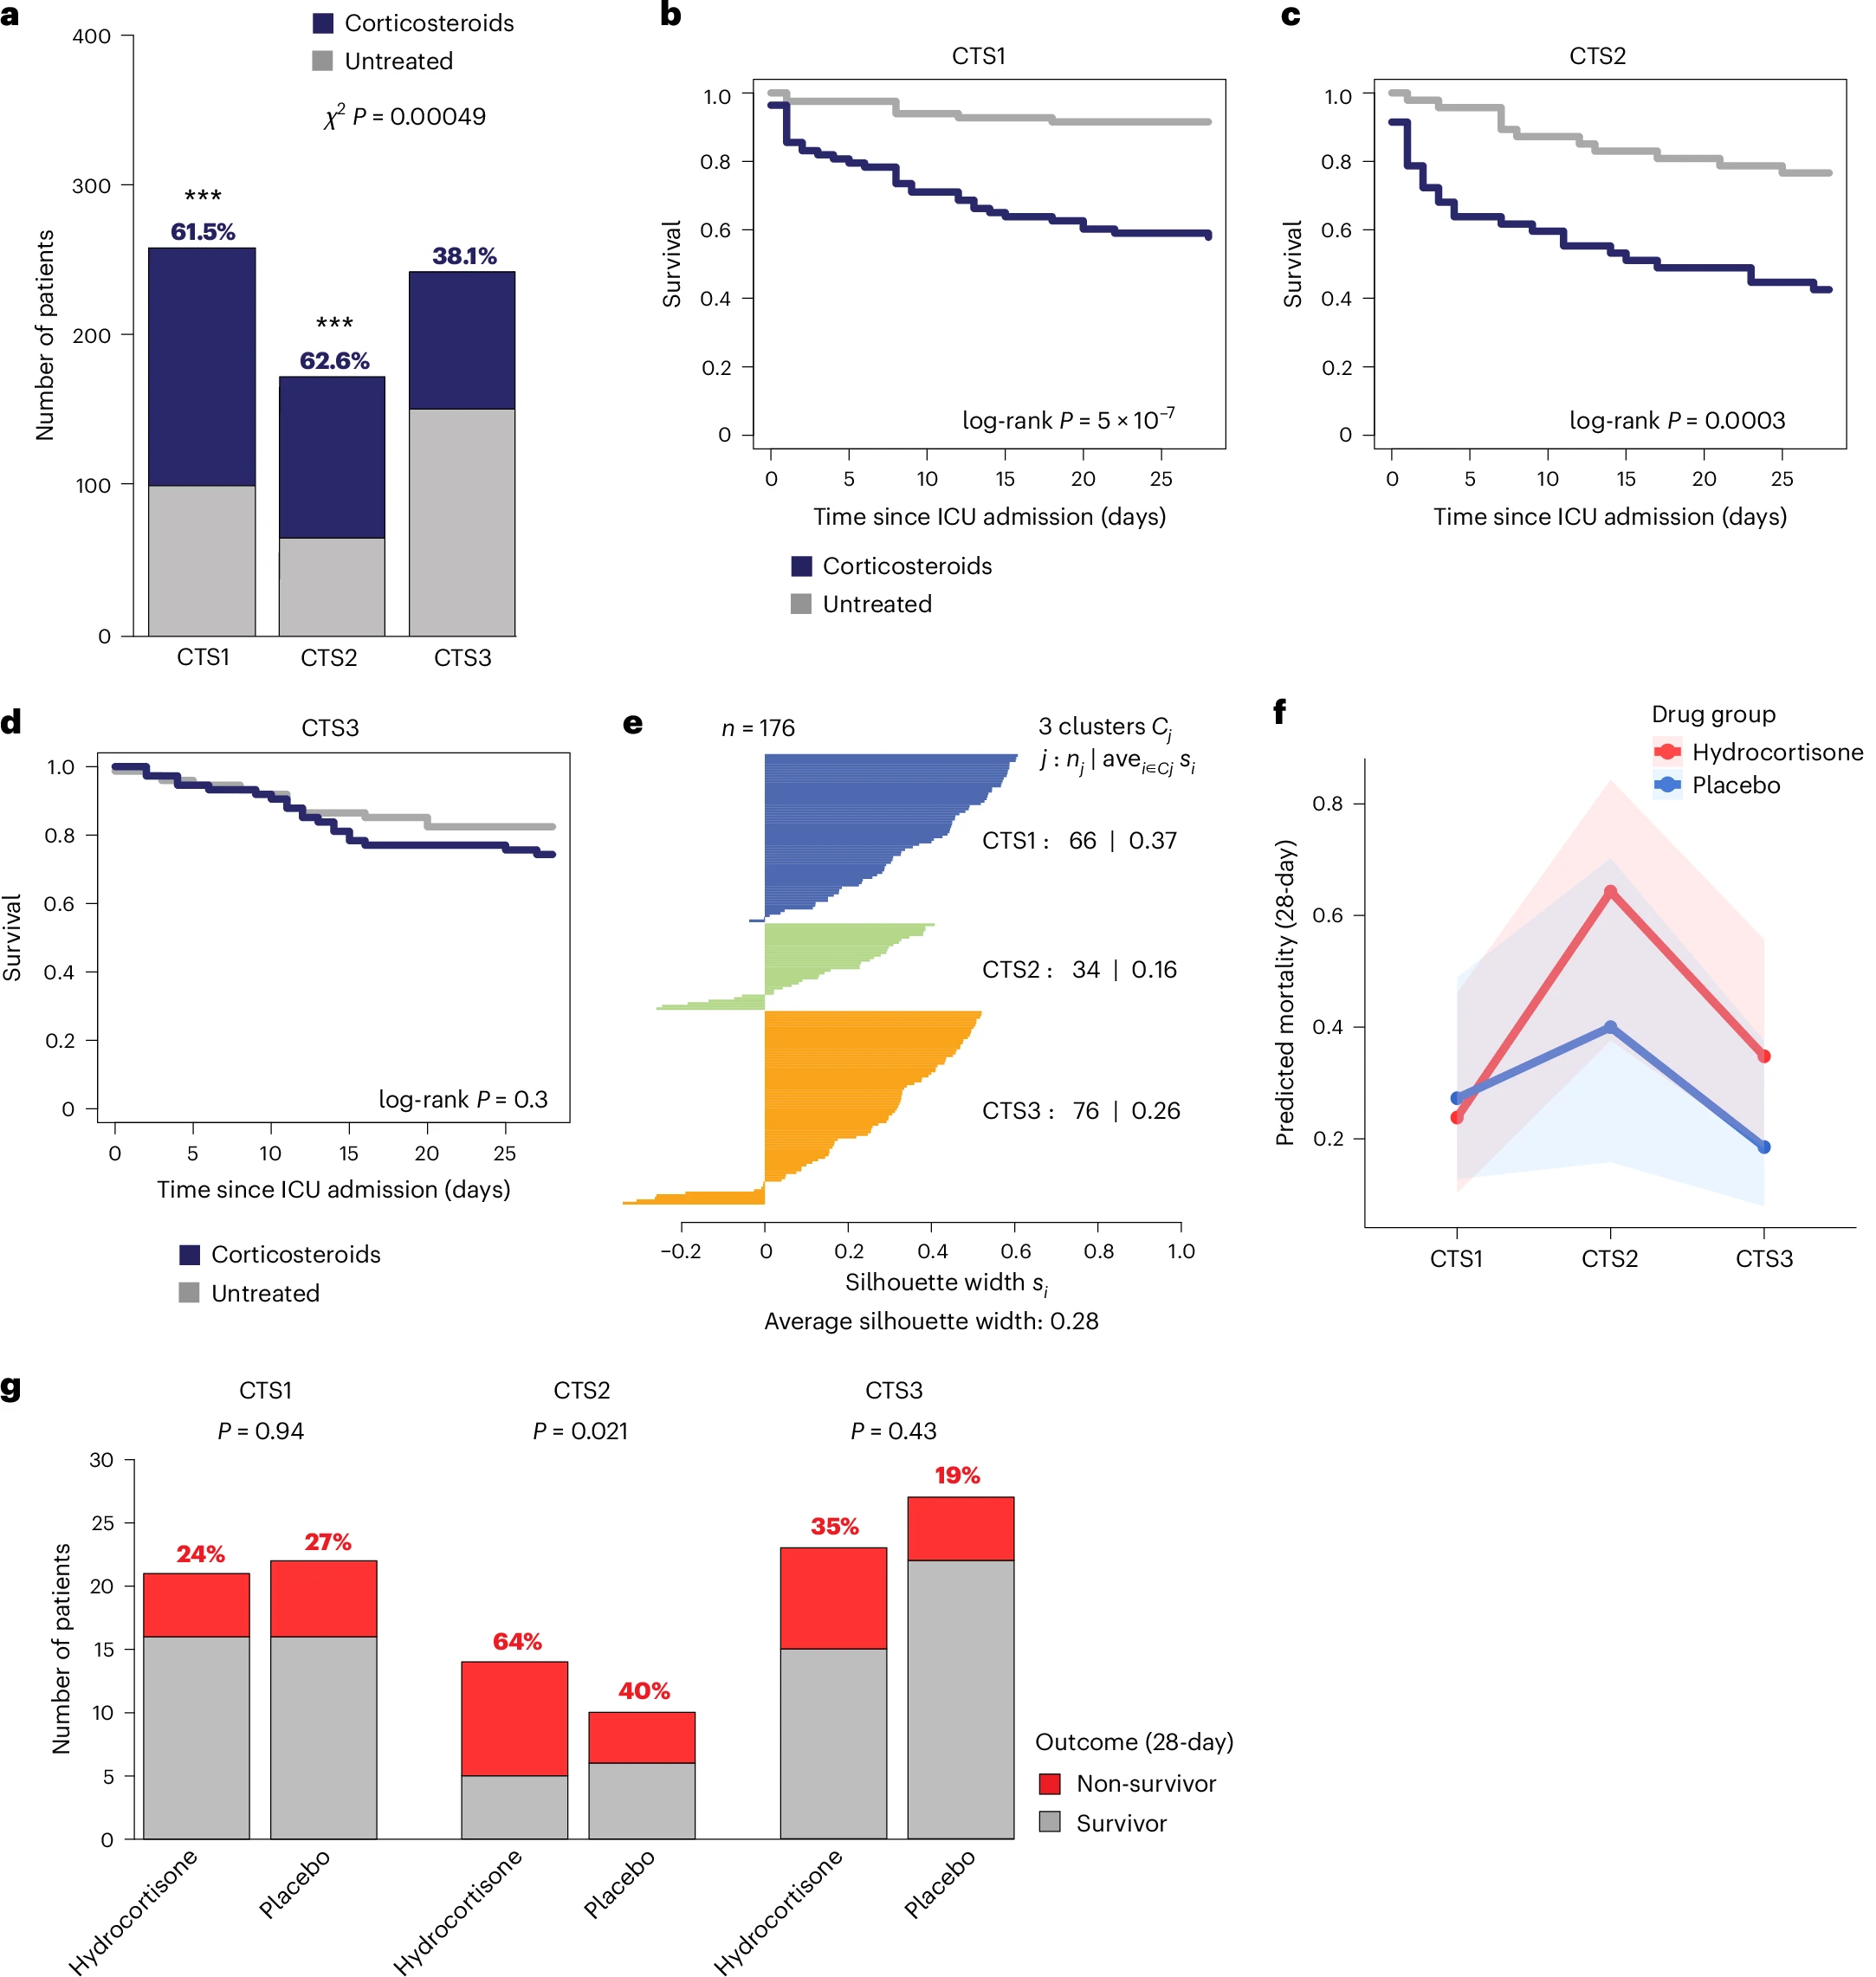
a, Bar plot depicting corticosteroid-treated and untreated patients in the MARS cohort (n = 617) assigned to CTS1, CTS2 or CTS3, and analyzed using pairwise chi-squared tests with Bonferroni correction. b–d, Kaplan–Meier survival analysis of corticosteroid-treated or untreated subgroups in CTS1-assigned (b), CTS2-assigned (c) and CTS3-assigned (d) MARS patients. e, Silhouette width analysis of the 176 unique patient samples from the VANISH randomized clinical trial assigned to CTS1, CTS2 or CTS3, illustrating overall model fit and cluster stability. Cj is cluster index (j = 1, 2, 3); nj denotes number of observations (points) in cluster j; avei∈Cj denotes the mean silhouette width of all points in that cluster. f, Line plot depicting predicted 28-day mortality as the outcome variable in hydrocortisone-treated or untreated patients stratified into CTS1–3. The lines indicate the mean predicted mortality; the shaded areas denote the 95% CIs. g, Bar plots of VANISH study patients stratified into CTS1–3 illustrating the main effect outcome (28-day mortality) with and without hydrocortisone treatment. A chi-squared post hoc test was used. ***P < 0.01 relative to CTS3.
