
Fig. 3: Characterization of biological pathways and cell-type-specific patterns of the CTSs.
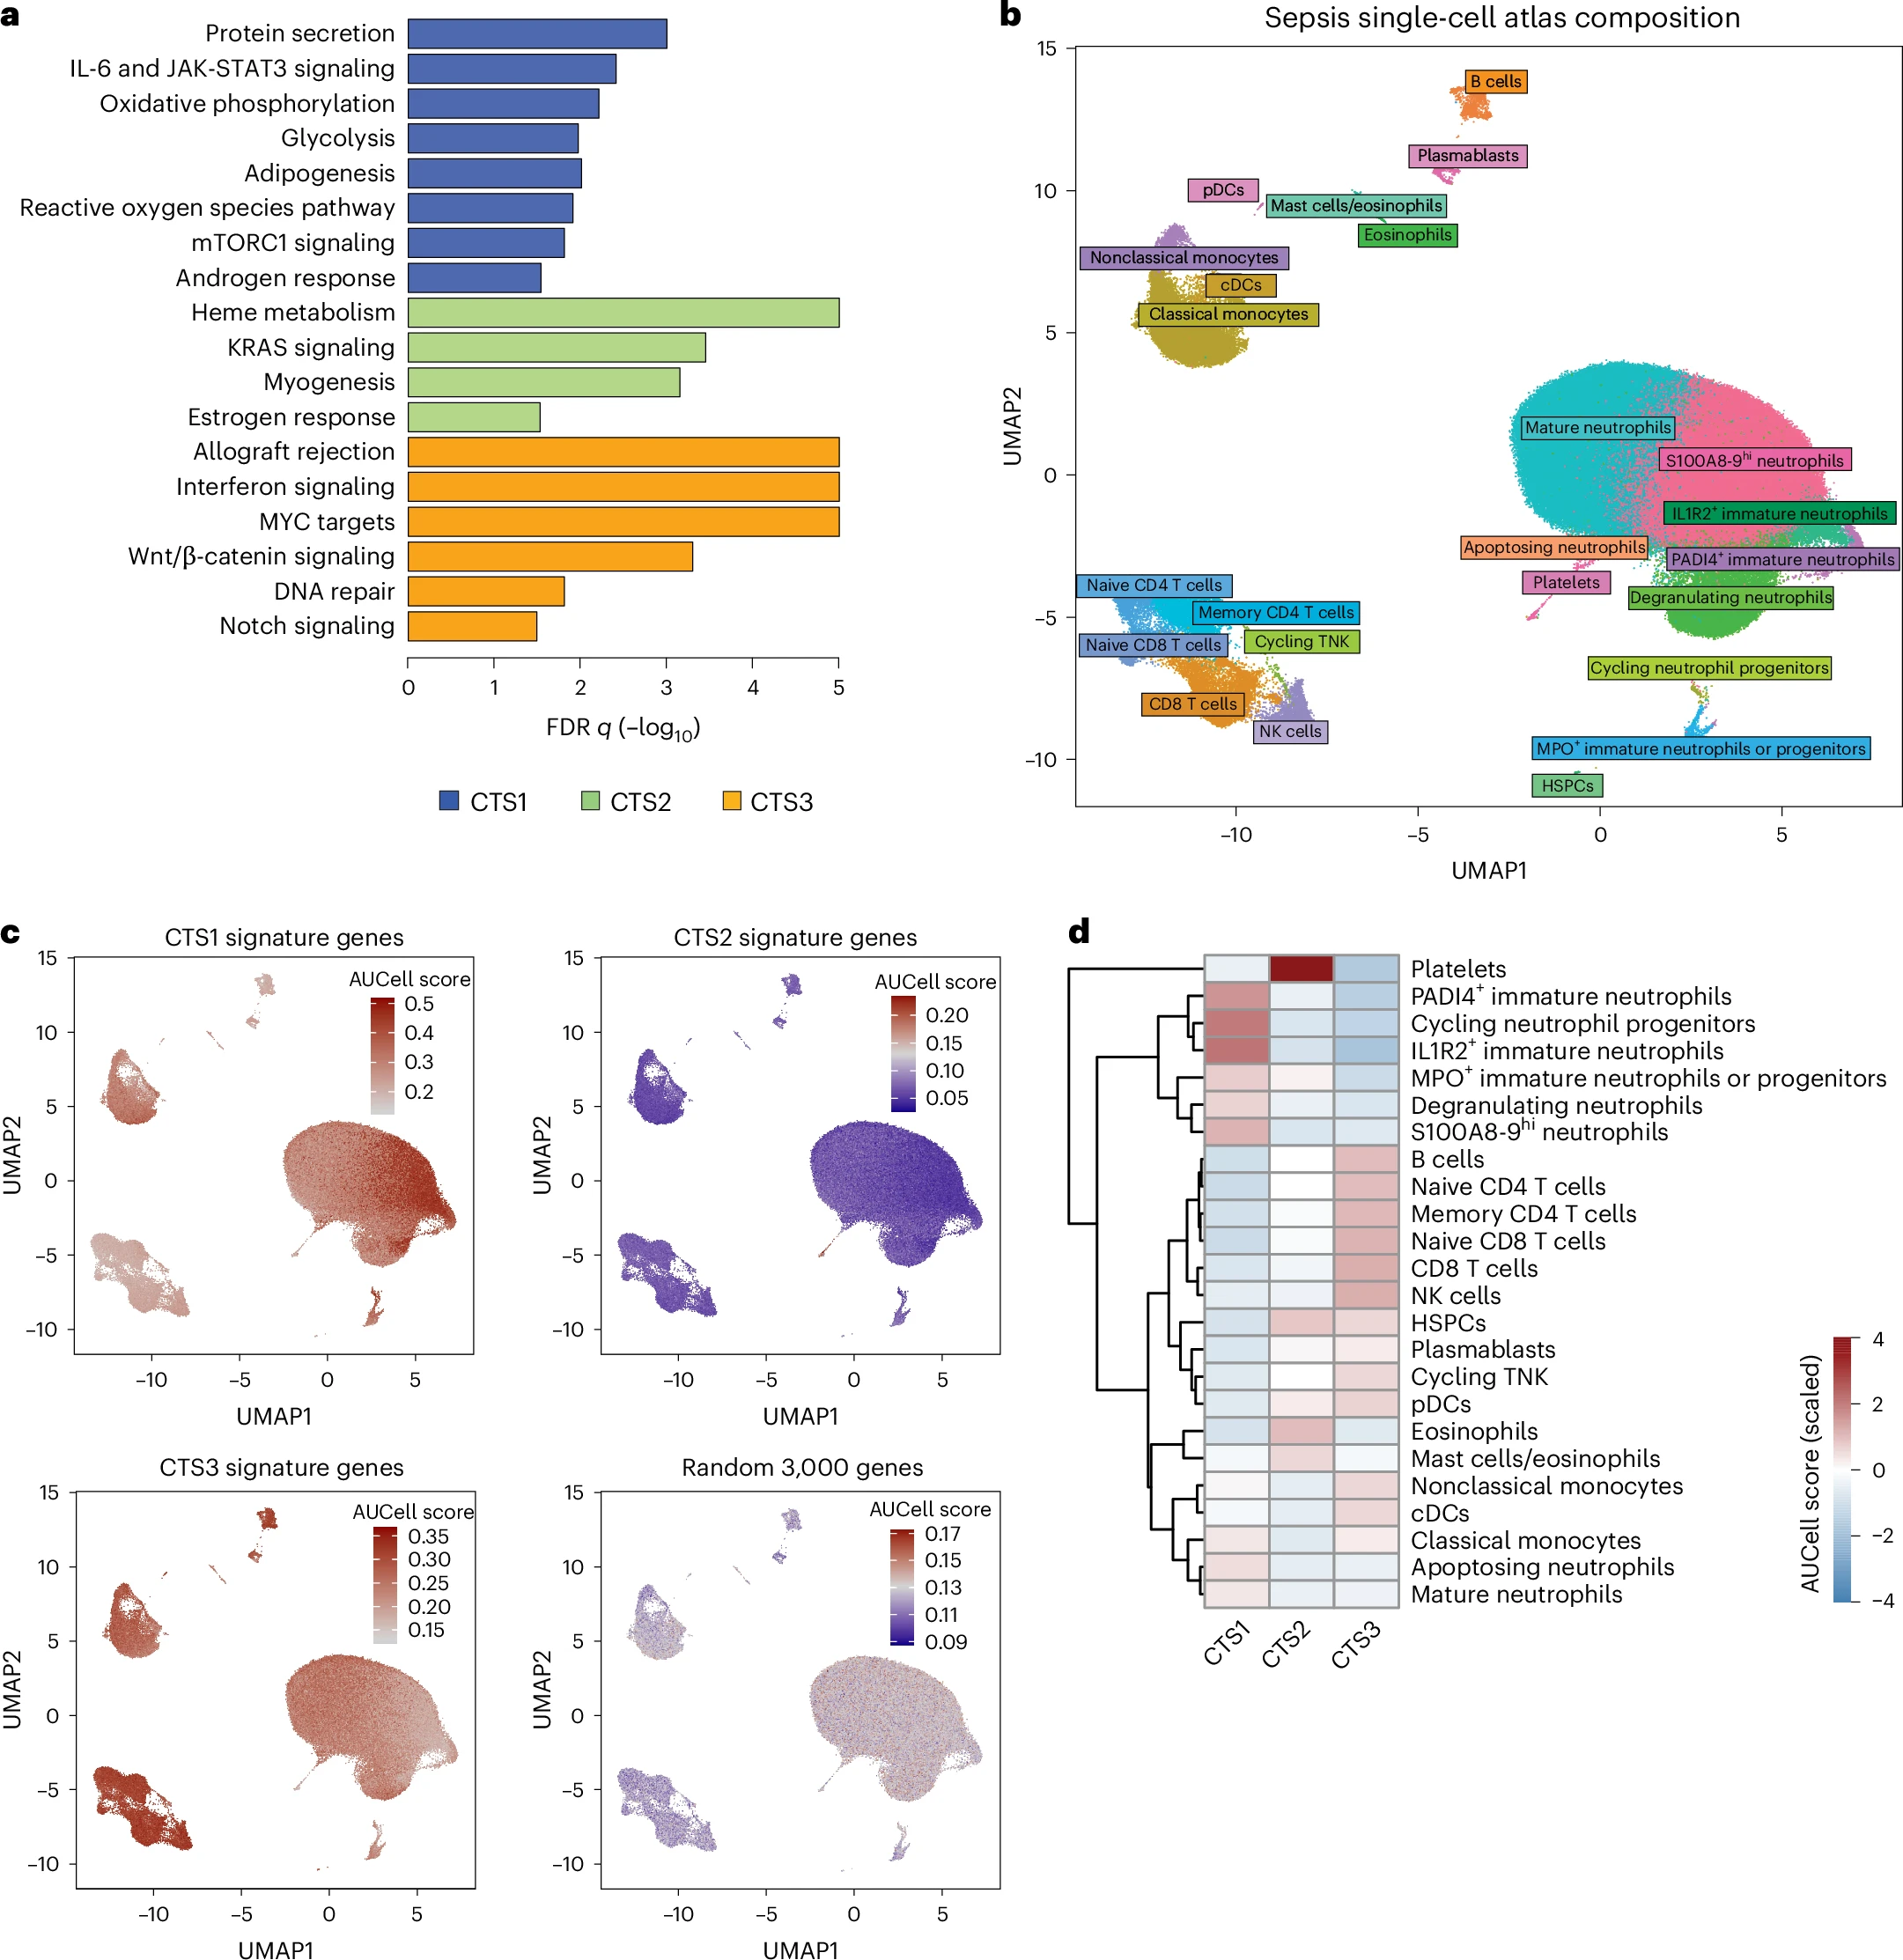
a, GSEA of CTSs using the ‘hallmarks’ molecular signatures database. b, Dimensionality reduction of scRNA-seq (scdata using uniform manifold approximation and projection (UMAP) and cell-type-specific annotations in the single-cell atlas27). c, Projection of the AUCell-determined CTS scores to the single-cell atlas UMAP and differential gene expression levels. d, Heatmap representation of AUCell scores per cell population in the sepsis single-cell atlas. cDC, conventional dendritic cell; FDR, false discovery rate; MPO, myeloperoxidase; pDC, plasmacytoid dendritic cell; TNK, thymic natural killer cells.
