
Fig. 4: Host response biomarker profiles across CTSs of sepsis.
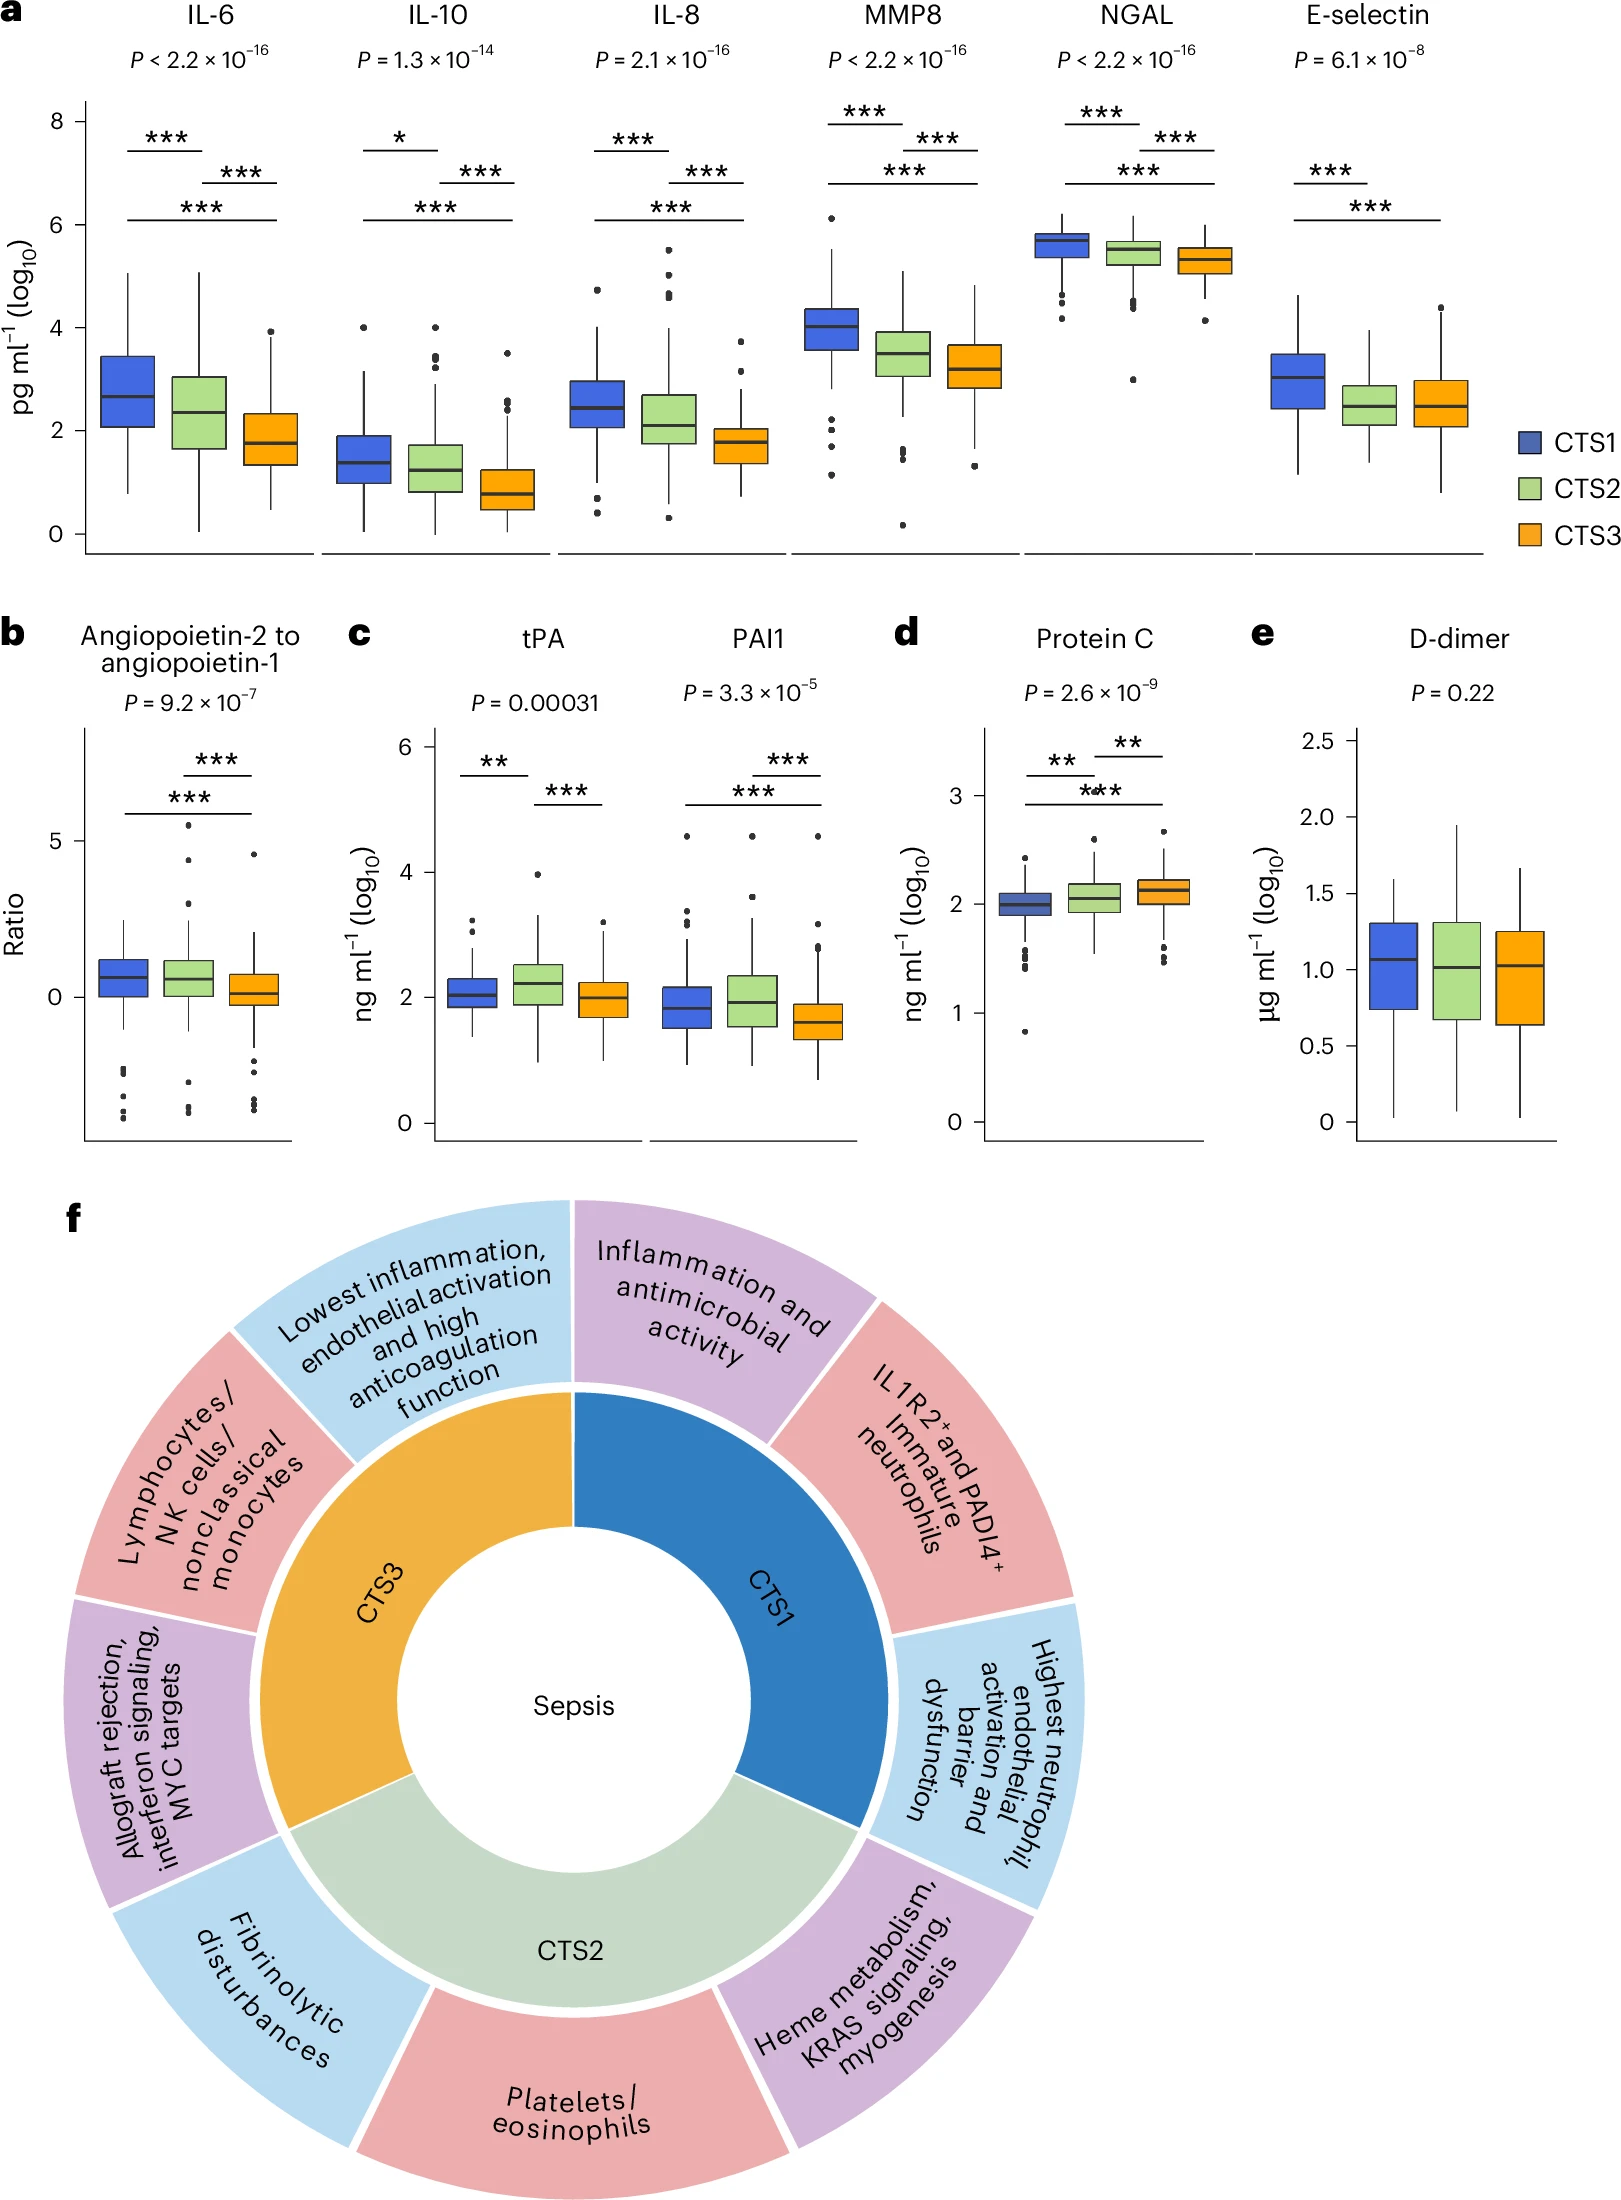
a–e, Box plots depicting the levels of soluble mediators of inflammation and endothelial function (a), endothelial barrier integrity (b), fibrinolysis (c), anticoagulation (d) and clot breakdown (e), measured in CTS1-classified (n = 157), CTS2-classified (n = 138) and CTS3-classified (n = 121) patients from the MARS cohort, and analyzed using a Dunn’s post hoc test. Kruskal–Wallis exact P values are reported. Dunn’s post hoc test: *P < 0.05, **P < 0.01, ***P < 0.001 relative to CTS3. The box plots illustrate the distribution of each biomarker from individual patients (the unit of the study), stratified according to CTS, where the central line marks the median, the box defines the interquartile range and the whiskers extend to 1.5 times the interquartile range. f, Proposed taxonomy of the CTSs of sepsis, reflecting cell types that probably drive each CTS endotype (light red slices), the top-most significant cellular biological pathways (purple slices) and the host response biomarker profiles (light blue slices). Graphic in f created using BioRender.com.
