
Abstract
Abstract intestinal microbiota is becoming a significant marker that reflects differences between health and disease status also in terms of gut-brain axis communication. Studies show that children with autism spectrum disorder (ASD) often have a mix of gut microbes that is distinct from the neurotypical children. Various assays are being used for microbiota investigation and were considered to be universal. However, newer studies showed that protocol for preparing DNA sequencing libraries is a key factor influencing results of microbiota investigation. The choice of DNA amplification primers seems to be the crucial for the outcome of analysis. In our study, we have tested 3 primer sets to investigate differences in outcome of sequencing analysis of microbiota in children with ASD. We found out that primers detected different portion of bacteria in samples especially at phylum level; significantly higher abundance of Bacteroides and lower Firmicutes were detected using 515f/806r compared to 27f/1492r and 27f*/1495f primers. So, the question is whether a gold standard of Firmicutes/Bacteroidetes ratio is a valuable and reliable universal marker, since two primer sets towards 16S rRNA can provide opposite information. Moreover, significantly higher relative abundance of Proteobacteria was detected using 27f/1492r. The beta diversity of sample groups differed remarkably and so the number of observed bacterial genera.
Introduction
An advent of massively parallel sequencing (MPS) technologies has revolutionized an investigating of human microbiota1. MPS platforms has enabled unrevealing of the microbiota composition and bacterial identification in complex microbial samples which was not feasible before2. Relatively easily accessible results tempted to excitement for revealing yet unknown. However, the procedure is very complex. Obtaining the results truly reflecting the real microbiota state may require tedious optimization. All steps in DNA library preparation including sample collection and storage3 or DNA isolation4 may influence the results of analysis. Suitable protocol for DNA libraries preparation have to be chosen with regards to sequencing platform5,6 as well as type of specimen origin7,8. In this respect, primer selection seems to be the most crucial task in preparation of DNA sequencing libraries9 and so bacterial composition discovery. Via selection of specific amplification primers, investigating of more less any location and length of bacterial genes is enabled. Despite the fact that MPS technologies allow analysis of whole bacterial genomes, sequencing of 16S rRNA has become a gold standard in microbiota studies10. These genes are of suitable length and structure for phylogenetic analysis11. Huge advantage for 16S sequencing and subsequent bacterial identification are easily accessible and rapidly expanding databases of their sequences in specific organisms12,13,14.Various primer sets are being used for amplification of 16R rRNA genes and were considered to be universal. However, primers may differ in specificity and sensitivity. Moreover, amplification primer sets need to be chosen depending on type of biological sample as different type of microbiota can be present across various biological specimen, such as blood, saliva or stool samples15. New studies showed that amplification of different variable regions of 16S rRNA genes may result in different outcome and that results may be highly variable depending on primer set used. It is well-known that full length 16S rRNA gene sequence can provide the most specific phylogenetic analysis. On the other hand, due fact that currently used MPS platforms are producing much shorter reads than the length of 16S rRNA genes, as well as due to economic aspect, shorter fragments of 16S are often chosen for analysis. These may include one or more specific variable regions. However, short amplicons may reduce specificity and sensitivity of taxonomic classification16. In silico study comparing several hypervariable regions of 16S rRNA genes indicates that V4-V6 region reflect full length sequences of 16S rRNA genes the best, while V2 and V8 are the least reliable regions17. Sequencing analysis with results that truly mirror the real microbiota condition are of high importance as they may help to uncover connection between microbiota changes and various diseases. Recently, a lot of associations between changed microbiota conditions and health impairment such as allergic disease and asthma18,19,20,21, development of diabetes mellitus 122, necrotizing enterocolitis23, inflammatory bowel disease24 or obesity25,26 have been revealed. Other studies indicate that specific microbiota composition may be associated with neurodevelopmental disorders, as ASD27 and schizophrenia28, depression28 or neurodegenrative disorders as Parkinson’s29 and Alzheimer’s disease30. Many studies revealed behaviour31 and autism spectrum disorder (ASD) particularly32 are linked with microbiota changes via gut-brain axis connection. According to Ho et al.33, there are 26 published studies regarding the microbiome composition of paediatric ASD patients. Most of them found that children with ASD have distinct gut microbiota from that in children without the condition. Unfortunately, many of these studies showed inconsistent results crosslinking only in certain taxa, including Firmicutes at the phylum level, Clostridiales clusters including Clostridium perfringens, Bifdobacterium and Prevotella. Also, often used marker Firmicutes/Bacteroidetes (F/B) ratio provides opposed results. The studies of Strati et al.34 and Williams et al.35 declare a significant increase in the F/B ratio in ASD subjects, some studies declare no significant changes between ASD patients and controls36,37,38. There are also studies that mention Bacteroides/Firmicutes ratio27,34,39,40 being increased. One of the reasons for discordances could be, different approaches applied for the ASD microbiome characterization, including 16S rRNA V3-V4 primer pair41, individual variable regions of 16S rRNA42, combined with short-read sequencing or also pyrosequencing43. Differences in high-throughput techniques can also implement significant changes in microbiome composition coming from the methodological approach itself.
In our study, we tested 3 different primer sets for investigating microbiota of ASD patients. For this purpose, stool was chosen as a suitable biological sample, as easily accessible in the children with ASD. The primer sets were chosen as these are standardly used for faecal microbiota investigation. Here we present the differences in microbial composition in stool samples of paediatric ASD patients that can be implemented only by using a specific primer set towards 16S rRNA. We show diametrically different low-abundance bacterial genera detected by either of the primer set. Differences in bacterial composition can be observed even within the analysis of the same 16S rRNA variable regions with alternative primer set. Furthermore, not only the quality but also the quantity of the detected bacterial genera differed between three primer sets.
Methods
Ethical approval
This study was approved by the Ethical committee of the Comenius University Faculty of Medicine, and the University hospital in Bratislava, Slovakia and it is consistent with the 1964 Helsinki declaration and its later amendments. Parents were aware of whole design of the study and the informed consent form was signed by both (or at least one if both are not available) parents or caregivers of the corresponding child.
The authors confirm that all methods and experimental protocols were performed in accordance with the relevant guidelines and regulations and were approved by the of the committee of the Ministry of Health of the Slovak republic.
Experimental design
In this experiment, intestinal microbiota composition of 10 children with ASD was examined (samples A-J), while 3 different ways of sample processing were used and compared. This study was approved by the Ethical committee of the Comenius University Faculty of Medicine, and the University hospital in Bratislava, Slovakia and it is consistent with the 1964 Helsinki declaration and its later amendments. Parents were aware of whole design of the study and the informed consent form was signed by both (or at least one if both are not available) parents or caregivers of the corresponding child.
Faecal samples
In the study, 10 boys with ASD in age 5.00 ± 0.20 (mean ± SEM), ranging from 2.8 to 9.2 years, were included. All subjects were medication–free. The diagnosis of ASD was determined by a clinical psychologist or a psychiatrist according to ICD-10 and DSM-5. The children also underwent behavioural testing by trained examiners at the Academic Research Centre for Autism, Institute of Physiology, Faculty of Medicine, Comenius University. The diagnostic tools involved: observation of a child by the Autism Diagnostic Observation Schedule- second revision (ADOS-2)44 and the Autism Diagnostic Interview-Revised (ADI-R)45, a comprehensive interview administered to parents that provides a thorough assessment of individuals with ASD. All children enrolled in the study had to meet the criteria for ASD within both autism scales.
Stool specimens were collected by parents into sterile containers, after being given a detailed explanation of the procedure and kept at 4 °C and delivered to the laboratory within 4 h. Subsamples of 200 mg of each specimen were frozen at − 80 °C until DNA extraction.
DNA isolation
Total DNA was extracted from 200 mg of stool by QIAamp DNA Stool Mini Kit, (Qiagen, Hilden, Germany), according to the manufacturer's instructions with the final elution volume 100 μl of nuclease-free water. Isolated DNA was stored at − 80 °C until analysis.
16S rRNA amplification
In the study, 3 different primer sets (Table 1) were used for the amplification and further sequence analysis of 16S rRNA. For amplification by PCR, 3–50 ng of template DNA was used. The PCR was performed in final volume 20ul, while 4ul of 5 × HOT FIREPol Blend Master Mix (Solis BioDyne, Tartu, Estonia), 0.4 ul of 10 µM both forward and reverse primers (each in final concentration 0.2 µM). PCR conditions were optimized for primer set#1 as follows: initial denaturation 95 °C/15 min, followed by 25 cycles of denaturation 95 °C/20 s, aneling 62 °C/30 s and polymerization 72 °C/2 min. After that, final polymerization was carried out at 72 °C/10 min. For primer sets 2 and 3 annealing at 60 °C for 30 s was performed. PCR products were purified using DNA Clean &Concentrator (Zymo Research, Irvine, USA).
DNA sequencing library preparation
Short fragments (amplified by set#1 primers) were used directly for indexing PCR using Nextera XT Index Kit (Illumina, San Diego, California, USA) and Agilent SureSelect QXT Library Prep Kit (Agilent Technologies, Santa Clara, USA) and amplified according to the original protocol.
Long fragments (amplified by primer sets 2 and 3) were transposon-tagmented using Nextera XT DNA Library Preparation Kit (Illumina Inc, San Diego, California, USA) prior the indexing. For indexing, Nextera XT index kit (Illumina Inc, San Diego, California, USA) combined with master-mix from Agilent SureSelect QXT Library Prep Kit (Agilent Technologies, Santa Clara, USA) were used. Extended amplification program using 12 thermal cycles was used for 27f/1492r and 27f*/1495r sets of primer-based PCR product. In all experiments negative controls were included. Protocol evaluation using ZymoBiomics Gut Microbiome Standard (ZymoResearch, Irvine, CA, USA) was performed. DNA profile of sequencing libraries was verified using Agilent 2100 Bioanalyzer (Agilent Technologies, Santa Clara, USA) and High Sensitivity DNA Kit (Agilent Technologies, Santa Clara, USA) and quantified using Qubit 2.0 Fluorometer (Thermo Fisher Scientific, Waltham, USA). DNA libraries were analysed using Illumina MiSeq platform via 150 bp pair-end reads.
Data analysis
The quality of sequencing reads was verified in FastQC tool and analysed in Geneious Prime software (https://www.geneious.com/prime/) (Biomatters, Ltd., Auckland, New Zealand). The paired reads were merged (set as paired reads) and 3´ ends of reads were trimmed (error probability limit: 0.03). Microbial profiles of samples were assessed by comparison with RDP database. Data were statistically analysed using two-way Anova test and visualized using GraphPad Prism 6.0 (GraphPad Software, La Jolla, CA, USA) and ClustVis 2.0 (https://biit.cs.ut.ee/clustvis/)46. As criteria of statistical significance p < 0.05 was considered.
Results
The fragment size of DNA sequencing libraries was set to 500 bp for samples amplified by primer set#1 and from 150 to 1000 bp (median 500 bp) for primer sets 2 and 3. Number of reads obtained for samples amplified by different primer sets differed from 58,103 to 214,804 in average (Table 2).
Microbial diversity evaluation
Totally 2371 different bacterial genera were detected in stool samples of 10 paediatric patients suffering from ASD. With primer set#1—totally 1972 bacterial genera (except of sample C in that 2371 bacterial genera were detected) in average (1181 ± 151), set#2—2223 bacterial genera, in average (1572 ± 120), set#3—2200 bacterial genera, in average (1257 ± 149). Significant difference in number of bacterial genera was detected in comparison of primer set#2/set#1 (p = 6,89095E-05), set#2/set#3 (p = 2,63,482-E04), but not set#1/set#3 (p = 0.07). For beta diversity determination, PCA analysis of tested samples was carried out. It showed separation into clusters depending on primer sets used for 16S rRNA amplification. The beta diversity determination of analysed samples revealed primer set#2 providing the most divergent data compared to set#1 and set#3. Furthermore, bacterial composition detected with primer set#2 showed the highest variability. On the other hand, group of samples amplified by set#1 was highly “homogenous” (Fig. 1).

Comparative analysis of bacterial community at genus level of stool samples of children with ASD analysed by three different primer sets visualized by PCA. Analysis was performed at genus level using all detected (2731) bacterial genera. Set#1—515f/806r, set#2—27f/1492r, set#3—27f*/1495r. Unit variance scaling is applied to rows; SVD with imputation is used to calculate principal components. X and Y axis show principal component 1 and principal component 2 that explain 30.4% and 9.7% of the total variance, respectively. Prediction ellipses are such that with probability 0.95, a new observation from the same group will fall inside the ellipse. N = 29 data points.
Correlation of used primer set with the bacterial composition of the gut at phylum level
Microbial profiles of samples were analysed at phylum level. In general, microbiota of children with ASD was characterized by high relative abundance of Bacteroidetes followed by Firmicutes and Proteobacteria. In several samples, relatively high relative abundance of Verrucomicrobia was detected, however, this was observed only in samples amplified by set#1primers. Except of Bacteria, also low relative abundance (less than 1%) of Archaea was detected in samples amplified with set#1 primers (Table 3).
Differences in microbial profiles of samples at phylum level were observed depending on set of primers used for DNA sequencing library preparation (Fig. 2). Significantly higher relative abundance of Bacteroidetes was detected in microbial profiles of samples amplified by set#1primers, compared to samples amplified by set#2 and set#3 primers (p < 0.0001 for both). Difference was observed between samples prepared by set#2 and set#3 primers as well, where samples prepared with set#3 primers had significantly higher Bacteroidetes (p = 0.0025). On the other hand, in samples amplified by set#2 and set#3 primers, significantly higher abundance of Firmicutes was detected (p < 0.0001 for both). This observation is in accordance with the ZymoBiomics Gut standard sequencing using primer set#2, where higher amount of Firmicutes compared to the original relative abundance defined by the supplier has been determined compared to primer set#1, but not set#3. Significantly higher relative abundance of Proteobacteria was detected in samples amplified by set#2 primers compared to samples prepared by set#1 and set#3 primers (p = 0.0107 and p = 0.0013, respectively).
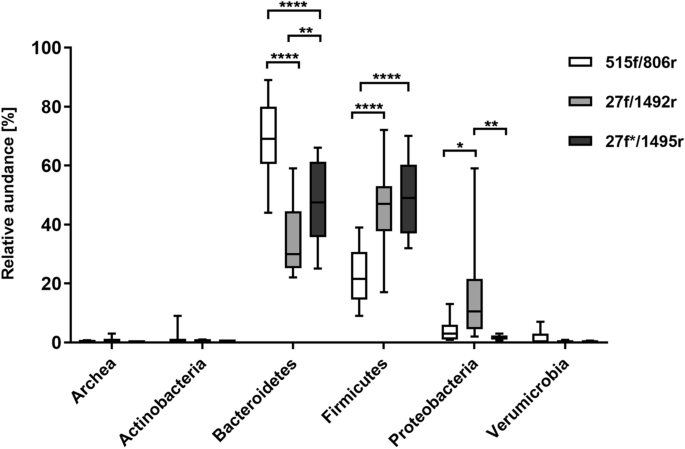
Differences in relative abundance of bacterial phyla in paediatric ASD samples amplified with different primer sets. Primer set#1 (515f/806r) adhered significantly more to Bacteroidetes than primer set#2 (27f/1492r) and set#3 (27f*/1495r). For Firmicutes detection primer set#3 was the most favourable followed by set#2. Primer set#3 represented balanced ratio of detected OTUs between Bacteroidetes and Firmicutes phyla. The highest abundance of Proteobacteria was detected by primer set#2 compared to set#1 and 3. The level of significance ≤ 0.01 was applied.
The Firmicutes to Bacteroidetes ratio (F/B) differed according to primer pair used for analysis. The elevated number of Bacteroidetes detected with set#1 mirrored in the lowest F/B ratio 0.37 (0.1–0.9 ± 0.24) that significantly differed from set#2 F/B ratio 1.5 (0.6–3.3 ± 0.9) (p = 0.0003) and set#3 F/B ratio 1.2 (0.5–2.8 ± 0.8) (p = 0.001). Between set#2 and set#3 there was no significant difference in F/B ratio (Fig. 3).

Firmicutes to Bacteroidetes ratio in faecal samples of ASD patients visualized by heatmap. Increased relative abundance of Bacteroidetes compared to Firmicutes in samples in that for amplification of 16S rRNA primer set#1 was used, compared to samples processed with primer set#2 and set#3.
Primer pair effect on detection of microbiome composition at genus level
Major differences were observed also in number of bacterial genera detected in samples amplified by different sets of primers (Fig. 4). The most bacterial genera (1584.7 ± 122.52) were detected in samples amplified by set#2 primers compared to set#1 (1170 ± 145.58 OTUs; p = 0.0001) and set#3 primers (1283.6 ± 166.73 OTUs; p = 0.0007).
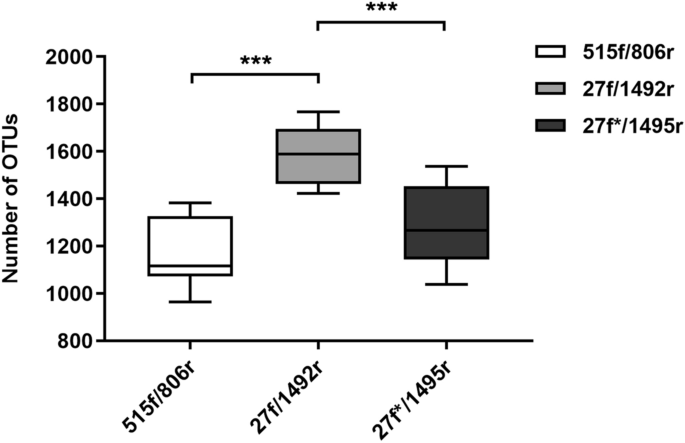
Number of detected bacterial genera in stool samples of paediatric ASD patients determined with three primer sets. Primer set#2 (27f/1492r) matched significantly to more genera than primer set#1 (515f/806r) and set#3 (27f*/1495r). The level of significance ≤ 0.01 was applied.
Furthermore, we found out that the microbial composition varied not only between different samples, but it differed also within the same sample amplified with different set of PCR primers. Pairwise analysis and Spearman Rank coefficients of the 244 bacterial genera present in all 10 analysed samples (Fig. 5) showed that the bacterial composition was the most similar between primer set#2 and set#3 (average r of 0. 33) followed by primer set#1 and set#3 (average r of 0.56) and finally set#1 and set#2 (average r of 0.62), regarding the quantity of individual bacterial genera. Within the group of samples amplified with the same primer set, the lowest variability in bacterial taxa abundance was observed with primer set#3 (average of r 0.22) followed by set#1 (average r of 0.32) and set#2 (average r of 0.34).

Comparison of relative abundance of bacterial composition between three primer sets amplifying 16S rRNA based on Spearman rank correlation coefficient. The most similar results are obtained with the primer set#2 and primer set#3. For the analysis 244 the most abundant bacterial genera and inclusion criteria for their presence in all samples was applied.
We observed that detected structure of the microbiota depends directly on primers used for PCR amplification (Table 4). Microbial analysis at genus level showed, that Bacteroides was the most abundant genus in 80% of samples. In the remaining 20% of samples, Prevotella or Alloprevotella dominated. However, we observed differences depending on type of PCR primers used for library preparation. In samples amplified by set#1 primers relative abundance of Bacteroides ranged from 1.7 to 63.2% (37.5% ± 19.95%) and Bacteroides was the most abundant genus in 7 of 10 samples. We also found out, Prevotella to be the most abundant in 2 samples (relative abundance 22.6% and 33.7%) and Alloprevotella in 1 sample (relative abundance 42.9%). High relative abundance of Paraprevotella 10.9% ± 6.44% was observed in all except one sample prepared with set#1 primers. When set#2 and set#3 primers were used, Bacteroides was the most abundant in 9 of 10 samples for both, and its relative abundance was 22.7% ± 10.93% and 32.6 ± 16.21%, respectively. Faecalibacterium was highly abundant in all samples and the relative abundance only slightly differed depending on primer set used for library preparation. In most of samples prepared with primer set#2 and 3 Clostridium was highly abundant, however, only in 1 sample prepared by set#1 primers was more represented. High abundance of Salmonella and Escherichia/Shigella was found in 3 and 2 samples correspondingly, when using set#2 primers, but this was not observed in the same samples prepared by different sets of primers (Table 4).
Analysis of the least abundant bacterial genera
Of the whole number of bacteria detected by individual primer sets (app.1500 genera per sample), the least abundant 500 genera of each primer set group were selected. Next, only genera significantly different (p < 0,005) between the sets of taxa obtained with different primer sets (71 genera) were considered for further analysis. Comparison of these groups revealed that primer set#2 (27f/1492r) is able to detect the most of unique bacterial genera representing less than 0.0001% of the detected bacterial community (in average 62 of 71) (Fig. 6). Furthermore, it detected the same group of bacterial genera like the primer set#3. This set of bacteria is represented also by Aggregatibacter, Pseudomonas, Mannheimia, Paraglaciecola, Actinobacillus, Lucibacterium, Otariodibacter, Pseudohongiella, Candidatus Nanosalina, Psychrobium, Natronobacillus, Modicisalibacter, Chromatocurvus, Rhodothalassium, Denitrobacterium, Amphiplicatus, Aquisalibacillus, Thermoactinospora, Marispirillum, Thiopseudomonas, Ciceribacter, Thermobispora, Hoppeia, Telmatospirillum, Thioalkalispira, Biostraticola, Parablastomonas, Saccharophagus and Frondibacter. On the contrary, primer set#1 detected in average 13 unique bacterial genera including Gp12, Roseococcus, Arcicella, Dermacoccus, Aquipuribacter, Catenulispora, Pleomorphobacterium, Pseudoscardovia, Armatimonadetes gp5, Pseudomonas, Candidatus Nanosalina, Psychrobium and Modicisalibacter differing from bacteria detected with set#2 or set#3.

Comparison of the detection capability of three primer sets based on the least abundant bacterial genera with significantly different abundance among groups. For data analysis student´s t-test was performed. Bacterial genera with significantly altered abundance between compared datasets (p ≤ 0.005) were visualized using heatmap.
Detection of ASD-associated bacterial genera
Several bacterial species have been observed in previous studies to have elevated or decreased abundance when compared samples of children with ASD and neurotypical controls27,34,35,43,47,48,49,50,51,52,53,54,55. We analysed ability of 3 different primer sets to detect bacterial genera often associated with ASD. We observed significantly higher ability to detect Bacteroides by set#1 and set#3 rather than set#2 (p < 0.001 and p = 0.002 respectively). There was also a trend for higher abundance of Clostridium, Corynebacterium, Lactobacillus, Coprococcus and Dialister in set#2 and set#3 prepared samples. In contrast, samples amplified by set#1 showed higher relative abundance of Akkermansia, Bifidobacterium and Prevotella. For the detection of Colinsella and Alistipes rather primer set#1 and set#3 seem to be more suitable than set#2 (Fig. 7a,b).

(a) Relative abundance of bacterial species that have been observed to be elevated in children with ASD. The level of significance ≤ 0.01 was applied. (b) Relative abundance of bacterial species that have been observed to be decreased in children with ASD. The level of significance ≤ 0.01 was applied.
Discussion
Intestinal microbiota analysis of an individual may be very variable since it is influenced by many factors. For example, false differences may be introduced during sample processing, different results may be obtained when different protocols for DNA library preparation or data analysis are used. Preparation procedures as well as sequencing procedures might be very important issue when comparing results of different experiments. Therefore, unification of procedures in studying of microbiota composition plays an important role.
In our study, clear differences were observed depending on type of DNA sequencing library preparation method. In samples amplified with set#1 primers, Bacteroidetes were definitely the most abundant in microbiota of children with autism. This is in line with previously published study of Finegold et al.55 who observed Bacteroidetes to be the most abundant in autistic microbiota, followed by Firmicutes, similarly to our study. In our primer pair evaluation the closest result was obtained by amplification of the shortest PCR product, only the V4 region of 16S rRNA gene compared to primer set used in Finegold´s analysis (amplification of V4-V6 region)55. The primer sets 2 and 3 gave rather opposite Bacteroidetes:Firmicutes ratio or even more abundant Firmicutes using the shot-gun sequencing of total 16S rRNA gene. The used ZymoBiomics Gut Microbiome Standard enabled us to validate not only the library preparation protocol, but also the DNA isolation method as well as to filter out wet-lab and dry-lab contamination from samples. In summary, shot-gun sequencing of pcr amplicon encompassed all the bacteria included within the recommended standard including Firmicutes, Bacteroidetes, Verrucomicrobia, Fusobacteria and Proteobacteria. The only genus Bifidobacterium (Actinobacteria) was detected by V1-V9 sequencing approach with 100-times lower abundance compared to the original mock community. Here we could speculate that it is a matter of GC content (59.2%) of Bifidobacterium adolescentis. However, the Firmicutes represented by bacterial species with wide range of GC content (Faecalibacterium 57.8%; Veillonella 39.0%; Roseburia 48.7%; Lactobacillus 52.3%; Clostridioides 28.8%) were identified almost equally to original ratio within mock community and detected without any preference for the GC content. So, we suppose that the GC content of the 16S rRNA gene could be more balanced than of the whole genome, at least for Firmicutes. What can rather be influenced is the preference of primer set#2 and set#3 for Firmicutes than for Bacteroidetes, since the GC content of the represented bacteria (Bacteroides 43.3%; Prevotella 44.4%) was higher than of some of the Firmicutes representatives or similar. The ratio of Firmicutes to Bacteroidetes was favourable for Firmicutes what matched the premixed standard (50% Firmicutes, 26% Bacteroidetes) even though the relative abundance of Bacteroidetes was lower than expected (5-times). This is an important point for data validation using qPCR methods, since it is based on short amplicons amplification, and as such opposite results can be obtained compared to 16S sequencing based on full-length 16S rRNA sequence. Real-time PCR analysis belongs still to the most widely used methods for bacterial analysis also in terms of their quantification27,56 so careful primer set selection needs to be taken into account according to further intents.
At genus level, Bacteroides and Faecalibacterium were present across all samples with high relative abundance. This is in line with previously published studies34,55. Except these genera, in Finegold study, Clostridium, Eubacterium, Ruminococcus, Roseburia, Akkermansia, Parabacteroides and Alistipes, were also the most abundant55. In another study, where bacterial 16S rRNA genes were amplified using a primer set specific for V3–V5, genus level analysis showed different top ten most abundant genera Bifidobacterium, Unknown Lachnospiraceae, Blautia, Ruminococcus, Clostridium XI, Streptococcus, Gemmiger, and Lachnospiraceae incertae sedis34. On contrary with previously published study, we did not confirm high abundance of Bifidobacteria and Eubacterium. For other bacteria, we observed that relative abundance was depending on type of DNA library preparation and varied among samples. However, none of above mentioned species were highly abundant in more than half samples in our study, except Alistipes which was among 10 most abundant species in 6 samples prepared by set#1primers, Roseburia highly present in 7 samples prepared by 27f*/1495r primers and Lachnospiracea with high relative abundance in 6 samples prepared by 3 set of PCR primers.
Higher levels of Clostridium, Suterrella and Ruminococcus are considered to be associated with pathogenesis of ASD. Some previously published studies, confirmed increased abundance of Clostridia compared to healthy controls53,54 as well as increased Suterrella and Ruminococcus51. In our study, we observed differences in relative abundance of Clostridium depending on type of sequencing library preparation. Clostridium was detected with high abundance only in 1 sample amplified by 1 set of primers. However, Clostridia were present in high relative abundance in samples amplified by second and third set of PCR primers. On the other hand, Suterella was not found to be among the most abundant species in any sample and Ruminoccocus was detected to be among 10 most abundant species in half of samples amplified by 2 and 3 set of primers, and only in 1 sample amplified by 1 set of primers.
Previously published studies confirmed that many factors may influence results of sequencing analysis. These include storage conditions, DNA extraction method, type of primers used for DNA amplification and sequencing, sequencing platform and chemistry, as well as data analysis, which have an impact on detected microbiota composition57,58,59,60. The studies also indicate, that only suitable combination of several factors may result in findings that truly reflects reality. Although several primer sets are commonly used and considered to be universal, different results may be obtained. Study comparing V4, V6-V8 and V7-V857, as well as other study comparing V4-V5, V1-V2 and V1-V2 degenerate primers58, both confirmed, that V4/V4-V5 primers give results that are the most comparable across platforms and the least biased. On the other hand, V4-V5 regions resulted in lowest number of analysable reads compared to others. Using V4 primers (515f/806r primers) in our study resulted significantly higher Bacteroides and lower Firmicutes than by two others primer sets, as well as significantly lower abundance of Proteobacteria than detected by 27f/1492r amplification primers.
In study of Farris and Olson universal primer sets (24F and 1492R original and modified versions of primers specific for Actinobacteria) for 16S rRNA genes amplification were used. These primers were not able to amplify 20%-50% of isolates. In this study, 1492R provided more effective identification of Actinobacteria than 1492-modif61. In our study, we did not observe significant differences in ability of 3 primer sets to identify Actinobacteria in samples. On the other hand, it is clear, that in our experiment, Actinobacteria presented only low percentage of microbial communities. This might be supported by fact, that some bacteria especially those whose sequences include high G + C content (also characteristic for Actinobacteria) are usually identified in lower abundance than in real microbial communities62.
Though only minor changes in sequences of 27f*/1495r primer set compared to standard set of 27f/1492r primers, in several phyla significant differences in microbiota composition were detected. We found out significantly higher relative abundance of Bacteroidetes and significantly lower relative abundance of Proteobacteria when samples were amplified by modified (27f*/1495r primers) compared to samples amplified by standard primers (27f/1492r primers). Interestingly, when it comes to microbial composition on genus level, only minor differences were observed between samples amplified by set#2 and set#3 of primers.
Conclusion
We have found out, that the primer set 27f/1492r (primer set#2) can provide much wider information regarding the diversity of samples from ASD children and can provide deeper insight into intra-individual variability. On the other side, the 16S rRNA V4 region can provide very homogenous information on bacterial composition typical for ASD patients what in comparative studies is an invaluable tool for discriminative analysis. Here we prove also that the selection of 16S rRNA variable regions for analysis matters more than the primer set itself in terms of bacterial semiquantitative analysis, based on the comparative analysis of primers 27f*/1495r (set#3) and primers 27f/1492 (set#2). However, the most interesting is the finding, that the Firmicutes/Bacteroidetes ratio highly depends on the analysed 16S rRNA region; the 27f/1492r provides approximately 4-times higher F/B ratio than 515f/806r what points to the bottle-neck of this value in any microbiome analysis.
References
Turnbaugh, P. J. et al. The human microbiome project. Nature 449, 804–810. https://doi.org/10.1038/nature06244 (2007).
Lane, D. J. et al. Rapid determination of 16S ribosomal RNA sequences for phylogenetic analyses. Proc. Natl. Acad. Sci. U. S. A. 82, 6955–6959. https://doi.org/10.1073/pnas.82.20.6955 (1985).
Wu, W. et al. Optimization of fecal sample processing for microbiome study d The journey from bathroom to bench. J. Formos Med. Assoc. 118, 545–555. https://doi.org/10.1016/j.jfma.2018.02.005 (2019).
Lim, M. Y., Song, E., Kim, S. H., Lee, J. & Nam, Y. Comparison of DNA extraction methods for human gut microbial community profiling. Syst. Appl. Microbiol. 41, 151–157. https://doi.org/10.1016/j.syapm.2017.11.008 (2018).
Milani, C. et al. Assessing the fecal microbiota: an optimized ion torrent 16S rRNA gene-based analysis protocol. PLoS ONE 8, e68739. https://doi.org/10.1371/journal.pone.0068739 (2013).
Pichler, M. et al. A 16S rRNA gene sequencing and analysis protocol for the Illumina MiniSeq platform. Microbiologyopen 7, e611. https://doi.org/10.1002/mbo3.611 (2018).
Castelino, M. et al. Optimisation of methods for bacterial skin microbiome investigation: primer selection and comparison of the 454 versus MiSeq platform. BMC Microbiol. 17, 1–12. https://doi.org/10.1186/s12866-017-0927-4 (2017).
Fredriksson, N. J., Hermansson, M. & Wilén, B. The choice of PCR primers has great impact on assessments of bacterial community diversity and dynamics in a wastewater treatment plant. PLoS ONE 8, e76431. https://doi.org/10.1371/journal.pone.0076431 (2013).
Hiergeist, A., Reischl, U. & Gessner, A. International journal of medical microbiology multicenter quality assessment of 16s ribosomal dna-sequencing for microbiome analyses reveals high inter-center variability. Int. J. Med. Microbiol. 306, 334–342. https://doi.org/10.1016/j.ijmm.2016.03.005 (2016).
Huse, S. M., Ye, Y., Zhou, Y. & Fodor, A. A. A core human microbiome as viewed through 16S rRNA sequence clusters. PLoS ONE 7, 1–12. https://doi.org/10.1371/journal.pone.0034242 (2012).
Woese, C. R. Bacterial evolution. Microbiol. Rev. 51, 221–271 (1987).
Desantis, T. Z. et al. Greengenes, a Chimera-Checked 16S rRNA gene database and workbench compatible with ARB. Appl. Environ. Microbiol. 72, 5069–5072. https://doi.org/10.1128/AEM.03006-05 (2006).
Cole, J. R. et al. The ribosomal database project (RDP-II): sequences and tools for high-throughput rRNA analysis. Nucleic Acids Res. 33, 294–296. https://doi.org/10.1093/nar/gki038 (2005).
Pruesse, E. et al. SILVA : a comprehensive online resource for quality checked and aligned ribosomal RNA sequence data compatible with ARB. Nucleic Acids Res. 35, 7188–7196. https://doi.org/10.1093/nar/gkm864 (2007).
Sim, K. et al. Improved detection of bifidobacteria with optimised 16S rRNA-gene based pyrosequencing. PLoS ONE 7, e32543. https://doi.org/10.1371/journal.pone.0032543 (2012).
Martínez-Porchas, M., Villalpando-canchola, E. & Vargas-albores, F. Significant loss of sensitivity and specificity in the taxonomic classification occurs when short 16S rRNA gene sequences are used. Heliyon 2, e00170. https://doi.org/10.1016/j.heliyon.2016.e00170 (2016).
Yang, B., Wang, Y. & Qian, P. Sensitivity and correlation of hypervariable regions in 16S rRNA genes in phylogenetic analysis. BMC Bioinf. 17, 1–8. https://doi.org/10.1186/s12859-016-0992-y (2016).
Zhao, D. et al. Prenatal antibiotic use and risk of childhood wheeze/asthma: a meta-analysis. Pediatr. Allergy Immunol. 26, 756–764. https://doi.org/10.1111/pai.12436 (2015).
Johnson, C. C. & Ownby, D. R. The infant gut bacterial microbiota and risk of pediatric asthma and allergic diseases. Transl. Res. 179, 60–70. https://doi.org/10.1016/j.trsl.2016.06.010 (2016).
Adami, A. J. & Bracken, S. J. Breathing better through bugs: asthma and the microbiome. YALE J. Biol. Med. 89, 309–324 (2016).
Fujimura, K. E. & Lynch, S. V. Microbiota in allergy and asthma and the emerging relationship with the gut microbiome. Cell Host Microbe 17, 592–602. https://doi.org/10.1016/j.chom.2015.04.007 (2015).
Kostic, A. D. et al. The dynamics of the human infant gut microbiome in development and in progression toward type 1 diabetes. Cell Host Microbe 17, 260–273. https://doi.org/10.1016/j.chom.2015.01.001 (2015).
Warner, B. B. et al. Gut bacteria dysbiosis and necrotising enterocolitis in very low birthweight infants: a prospective case-control study. Lancet 387, 1928–1936. https://doi.org/10.1016/S0140-6736(16)00081-7 (2016).
Schwiertz, A. et al. Microbiota in pediatric nflammatory bowel disease. J. Pediatr. 157, 240–244. https://doi.org/10.1016/j.jpeds.2010.02.046 (2010).
Kalliomäki, M., Collado, M. C., Salminen, S. & Isolauri, E. Early differences in fecal microbiota composition in children may predict overweight. Am. J. Clin. Nutr. 87, 534–538. https://doi.org/10.1093/ajcn/87.3.534 (2008).
Ajslev, T. A., Andersen, C. S., Gamborg, M., Sørensen, T. I. A. & Jess, T. Childhood overweight after establishment of the gut microbiota: the role of delivery mode, pre-pregnancy weight and early administration of antibiotics. Int. J. Obes. 35, 522–529. https://doi.org/10.1038/ijo.2011.27 (2011).
Tomova, A. et al. Gastrointestinal microbiota in children with autism in Slovakia. Physiol. Behav. 138, 179–187. https://doi.org/10.1016/j.physbeh.2014.10.033 (2015).
Lv, F. et al. The role of microbiota in the pathogenesis of schizophrenia and major depressive disorder and the possibility of targeting microbiota as a treatment option. Oncotarget 8, 100899–100907. https://doi.org/10.18632/oncotarget.21284 (2017).
Haikal, C., Chen, Q. Q. & Li, J. Y. Microbiome changes: an indicator of Parkinson’s disease? Transl. Neurodegener 8, 1–9. https://doi.org/10.1186/s40035-019-0175-7 (2019).
Jiang, C., Li, G., Huang, P., Liu, Z. & Zhao, B. The gut microbiota and Alzheimer’s disease. J. Alzheimer’s Dis. 58, 1–15. https://doi.org/10.3233/JAD-161141 (2017).
Sampson, T. R. & Mazmanian, S. K. Control of brain development, function, and behavior by the microbiome. Cell Host Microbe 17, 565–576. https://doi.org/10.1016/j.chom.2015.04.011 (2015).
Van, S. J. H. J., Pardo, P. P., Wu, J. & Garssen, J. The Gut-immune-brain axis in autism spectrum disorders; a focus on amino acids. Front Endocrinol. 10, 247. https://doi.org/10.3389/fendo.2019.00247 (2019).
Ho, L. K. H. et al. Gut microbiota changes in children with autism spectrum disorder: a systematic review. Gut Pathog. 12, 1–18. https://doi.org/10.1186/s13099-020-0346-1 (2020).
Strati, F. et al. New evidences on the altered gut microbiota in autism spectrum disorders. Microbiome 5, 1–11. https://doi.org/10.1186/s40168-017-0242-1 (2017).
Williams, B. L. et al. Impaired carbohydrate digestion and transport and mucosal dysbiosis in the intestines of children with autism and gastrointestinal disturbances. PLoS ONE 6, e24585. https://doi.org/10.1371/journal.pone.0024585 (2011).
De, A. M., Francavilla, R., Piccolo, M., De, G. A. & Gobbetti, M. Autism spectrum disorders and intestinal microbiota. Gut Microbes. 6, 207–213. https://doi.org/10.1080/19490976.2015.1035855 (2015).
Ma, B. et al. Altered gut microbiota in Chinese children with autism spectrum disorders. Front Cell Infect. Microbiol. 9, 40. https://doi.org/10.3389/fcimb.2019.00040 (2019).
Li, N. et al. Correlation of gut microbiome between ASD children and mothers and potential biomarkers for risk assessment. Genom. Proteom. Bioinf. 17, 26–38. https://doi.org/10.1016/j.gpb.2019.01.002 (2019).
Coretti, L. et al. Gut microbiota features in young children with autism spectrum disorders. Front Microbiol. 9, 3146. https://doi.org/10.3389/fmicb.2018.03146 (2018).
Zhai, Q. et al. Disturbance of trace element and gut microbiota profiles as indicators of autism spectrum disorder: a pilot study of Chinese children. Environ. Res. 171, 501–509. https://doi.org/10.1016/j.envres.2019.01.060 (2019).
Golubeva, A. V. et al. Microbiota-related Changes in bile acid & tryptophan metabolism are associated with gastrointestinal dysfunction in a mouse model of autism. EBioMedicine 24, 166–178. https://doi.org/10.1016/j.ebiom.2017.09.020 (2017).
Mas-Lloret, J. et al. Gut microbiome diversity detected by high-coverage 16S and shotgun sequencing of paired stool and colon sample. Sci. Data 7, 1–13. https://doi.org/10.1038/s41597-020-0427-5 (2020).
Finegold, S. M. et al. Gastrointestinal microflora studies in late-onset autism. Clin. Infect. Dis. 35, S6-16. https://doi.org/10.1086/341914 (2002).
Lord C, Risi S, Lambrecht L, Cook EH, Leventhal BL, DiLavore PC, Pickles A and Rutter M (2012) Autism diagnostic observation schedule, second edition (ADOS-2). J. Autism. Dev. Disord. 30:205–23. https://doi.org/10.1007/BF02211841.
Lord, C., Rutter, M. & Le Couteur, A. Autism Diagnostic Interview-Revised: a revised version of a diagnostic interview for caregivers of individuals with possible pervasive developmental disorders. J. Autism. Dev. Disord. 24, 659–685 (1994).
Metsalu, T. & Vilo, J. ClustVis: a web tool for visualizing clustering of multivariate data using principal component analysis and heatmap. Nucleic Acids Res. 43, 566–570. https://doi.org/10.1093/nar/gkv468 (2015).
Wang, L. et al. Low relative abundances of the mucolytic bacterium Akkermansia muciniphila and Bifidobacterium spp. in feces of children with autism. Appl. Environ. Microbiol. 77, 6718–6721. https://doi.org/10.1128/AEM.05212-11 (2011).
Adams, J. B., Johansen, L. J., Powell, L. D., Quig, D. & Rubin, R. A. Gastrointestinal flora and gastrointestinal status in children with autism: comparisons to typical children and correlation with autism severity. BMC Gastroenterol. 11, 22. https://doi.org/10.1186/1471-230X-11-22 (2011).
Finegold, S. M. Desulfovibrio species are potentially important in regressive autism. Med. Hypotheses 77, 270–274. https://doi.org/10.1016/j.mehy.2011.04.032 (2011).
De Angelis, M. et al. Fecal Microbiota and metabolome of children with autism and pervasive developmental disorder not otherwise specified. PLoS ONE 8, 1–18. https://doi.org/10.1371/journal.pone.0076993 (2013).
Wang, L. et al. Increased abundance of Sutterella spp. and Ruminococcus torques in feces of children with autism spectrum disorder. Mol. Autism. 4, 1–4. https://doi.org/10.1186/2040-2392-4-42 (2013).
Kang, D. W. et al. Reduced incidence of prevotella and other fermenters in intestinal microflora of autistic children. PLoS ONE 8, e68322. https://doi.org/10.1371/journal.pone.0068322 (2013).
Song, Y., Liu, C. & Finegold, S. M. Real-Time PCR quantitation of clostridia in feces of autistic children real-time PCR quantitation of clostridia in feces of autistic children. Appl. Environ. Microbiol. 70, 6459–6465. https://doi.org/10.1128/AEM.70.11.6459 (2004).
Parracho, H. M. R. T., Bingham, M. O., Gibson, G. R. & McCartney, A. L. Differences between the gut microflora of children with autistic spectrum disorders and that of healthy children. J. Med. Microbiol. 54, 987–991. https://doi.org/10.1099/jmm.0.46101-0 (2005).
Finegold, S. M. et al. Pyrosequencing study of fecal microflora of autistic and control children. Anaerobe 16, 444–453. https://doi.org/10.1016/j.anaerobe.2010.06.008 (2010).
Ahmed, S. A. et al. Study of the gut microbiome profile in children with autism spectrum disorder: a single tertiary hospital experience. J. Mol. Neurosci. https://doi.org/10.1007/s12031-020-01500-3 (2020).
Tremblay, J. et al. Primer and platform effects on 16S rRNA tag sequencing. Front Microbiol. 6, 771. https://doi.org/10.3389/fmicb.2015.00771 (2015).
Fouhy, F., Clooney, A. G., Stanton, C., Claesson, M. J. & Cotter, P. D. 16S rRNA gene sequencing of mock microbial populations-impact of DNA extraction method, primer choice and sequencing platform. BMC Microbiol. 16, 123. https://doi.org/10.1186/s12866-016-0738-z (2016).
Walker, A. W. et al. 16S rRNA gene-based profiling of the human infant gut microbiota is strongly influenced by sample processing and PCR primer choice. Microbiome 3, 1–11. https://doi.org/10.1186/s40168-015-0087-4 (2015).
Clooney, A. G. et al. Comparing apples and oranges? Next generation sequencing and its impact on microbiome analysis. PLoS ONE 11, e0148028. https://doi.org/10.1371/journal.pone.0148028 (2016).
Farris, M. H. & Olson, J. B. Detection of Actinobacteria cultivated from environmental samples reveals bias in universal primers. Lett. Appl. Microbiol. 45, 376–381. https://doi.org/10.1111/j.1472-765X.2007.02198.x (2007).
Hill, J. E., Town, J. R. & Hemmingsen, S. M. Improved template representation in cpn 60 polymerase chain reaction (PCR) product libraries generated from complex templates by application of a specific mixture of PCR primers. Environ. Microbiol. 8, 741–746. https://doi.org/10.1111/j.1462-2920.2005.00944.x (2006).
Caporaso, J. G. et al. Global patterns of 16S rRNA diversity at a depth of millions of sequences per sample. Proc. Natl. Acad. Sci. 108, 4516–4522. https://doi.org/10.1073/pnas.1000080107 (2011).
Lane DJ (1991) rRNA sequencing. Nucleic acid Tech. Bact. Syst. Stackebrandt E, Goodfellow M, eds Wiley, New York 5:115–175
Melničáková, J., Derdáková, M. & Barák, I. A system to simultaneously detect tick-borne pathogens based on the variability of the 16S ribosomal genes. Parasites Vectors 6, 1–12. https://doi.org/10.1186/1756-3305-6-269 (2013).
Acknowledgements
This work was supported by Grants APVV-15-0045, APVV-15-0085, APVV-17-0099, VEGA 1/0404/19, Comenius University Science Park in Bratislava (ITMS: 26240220086), REVOGENE (ITMS: 26240220067).
Author information
Authors and Affiliations
Contributions
L.P. and K.S. drafted the manuscript, A.T., L.P., K.S. participated at data analysis, G.R., G.M., I.M. and B.B. participated at data evaluation and revised the manuscript critically. The study was supervised by D.O., K.B. and K.S. All authors contributed to the study conception and design. All authors approved the version to be published.
Corresponding author
Ethics declarations
Competing interests
The authors declare no competing interests.
Additional information
Publisher's note
Springer Nature remains neutral with regard to jurisdictional claims in published maps and institutional affiliations.
Rights and permissions
Open Access This article is licensed under a Creative Commons Attribution 4.0 International License, which permits use, sharing, adaptation, distribution and reproduction in any medium or format, as long as you give appropriate credit to the original author(s) and the source, provide a link to the Creative Commons licence, and indicate if changes were made. The images or other third party material in this article are included in the article's Creative Commons licence, unless indicated otherwise in a credit line to the material. If material is not included in the article's Creative Commons licence and your intended use is not permitted by statutory regulation or exceeds the permitted use, you will need to obtain permission directly from the copyright holder. To view a copy of this licence, visit http://creativecommons.org/licenses/by/4.0/.
About this article

Cite this article
Palkova, L., Tomova, A., Repiska, G. et al. Evaluation of 16S rRNA primer sets for characterisation of microbiota in paediatric patients with autism spectrum disorder. Sci Rep 11, 6781 (2021). https://doi.org/10.1038/s41598-021-86378-w
Received:
Accepted:
Published:
Version of record:
DOI: https://doi.org/10.1038/s41598-021-86378-w
This article is cited by
-
Garvicin Q-producing Lactococcus garvieae LG3092: its role in mitigating dysbiosis and H. pylori-associated gastritis
npj Biofilms and Microbiomes (2025)
-
The molecular basis of Staphylococcus aureus resistance to linezolid and the role of silver nanoparticles in attenuating linezolid resistance
Molecular Biology Reports (2025)
-
Optimized bacterial community characterization through full-length 16S rRNA gene sequencing utilizing MinION nanopore technology
BMC Microbiology (2024)
-
Uncovering microbiomes of the rice phyllosphere using long-read metagenomic sequencing
Communications Biology (2024)
-
Hyperthermophile diversity microbes in the Calientes geothermal field, Tacna, Peru
Brazilian Journal of Microbiology (2023)
