
Abstract
With the rapid development of computer technology, artificial intelligence and big data technology have undergone a qualitative leap, permeating into various industries. In order to fully harness the role of artificial intelligence in the field of nuclear engineering, we propose to use the LSTM algorithm in deep learning to model the BEAVRS (Benchmark for Evaluation And Validation of Reactor Simulations) core first cycle loading. The BEAVRS core is simulated by DRAGON and DONJON, the training set and the test set are arranged in a sequential fashion according to the evolution of time, and the LSTM model is constructed by changing a number of hyperparameters. In addition to this, the training set and the test set are retained in a chronological order that is different from one another throughout the whole process. Additionally, there is a significant pattern that is followed when subsetting both the training set and the test set. This pattern applies to both sets. The steps in this design are very carefully arranged. The findings of the experiments suggest that the model can be altered by making use of the appropriate hyperparameters in such a way as to bring the maximum error of the effective multiplication factor keff prediction of the core within 2.5 pcm (10–5), and the average error within 0.5266 pcm, which validated the successful application of machine learning to transport equations.
Introduction
The main task of the reactor physics analysis is to simulate the various nuclear processes in the core to give the key parameters related to neutron dynamics in the nuclear reactor1,2. The "four-factor model" and "six-factor model" played an important role in the early physical analysis of reactors.
The solution of the neutron transport equation in differential-integral form requires the decoupling and discretization of the variables, and the current methods for angular discretization include the spherical harmonics method (PN)3 and the discrete ordinates method (SN)4. The discrete ordinates method uses individual angular directions instead of the entire angular space to discretize the angular variables and obtain the neutron balance equation in the specified direction. With the rapid development of computing and technology, the method of characteristic lines (MOC)5 and the Monte Carlo6 transport calculation methods have also been developed significantly. The characteristic line method converts the neutron transport equation into a one-dimensional neutron transport equation by using a series of mutually parallel characteristic lines covering the entire solution region. The Monte Carlo method, on the other hand, involves generating different particle initial positions, energies, and emission angles, as well as simulating various processes within the medium (such as production, collision, disappearance, and termination, etc.). The information obtained is then subjected to mathematical and statistical analysis. By utilizing a large number of random numbers, a stochastic model is constructed, and the model is solved using physical processes, the key to its solution lies in the reasonable use of a large number of random processes to simulate the random motion of neutrons in various media, and to solve the contribution of this motion process to a certain physical quantity.
LSTM neural network
High-speed research in neural networks, deep learning algorithms, and reinforcement learning is largely driving the AI revolution. These sophisticated algorithms can handle very complex machine learning tasks that are characterized by nonlinear relationships and interactions between features with a large number of inputs. Long Short-Term Memory (LSTM), first proposed in 19977,8,9, is a neural network specifically proposed to solve the problem of long-term dependence in general recurrent neural networks.
The cell structure of the LSTM model is shown in Fig. 1, and its calculation formula is shown in Eqs. (1)–(5)10 are shown.

LSTM cell structure diagram.
At time \(t\), the input vector is represented by \(x_{t}\). The weight bias term is denoted by \(b\). \(\sigma\) refers to the activation function. The cell structure state values at moments \(t\) and \(t - 1\) are represented by \(\tilde{c}_{t}\) and \(c_{t - 1}\), respectively. The hyperbolic tangent function,\(\tanh\), is used as the activation function. The input gate is denoted by \({\text{i}}_{t}\), and it corresponds to the weights \(W_{xi}\), \(W_{hi}\), and \(W_{ci}\). The forgetting gate is represented by \({\text{f}}_{t}\), with corresponding weights \(W_{xf}\), \(W_{hf}\), and \(W_{cf}\). Similarly, the output gate is denoted by \({\text{o}}_{t}\), with corresponding weights \(W_{of}\), \(W_{of}\), and \(W_{of}\). The cell output value at time t is represented by \({\text{h}}_{t}\).
BEAVRS core introduction
The BEAVRS model11 is derived from a real pressurized water reactor from Westinghouse. The basic structure and assembly enrichment distribution are shown in Fig. 2.

Core arrangement diagram.
The core contains 193 fuel assemblies, and the fuel rods in the assemblies are arranged in a 17 × 17 lattice. Each assembly contains 264 fuel rods, and one instrument tube is installed at the center of the core. One instrument tube is installed in the center for in-stack measurement, and 24 guide tubes are installed around the center. The fuel assembly parameters are shown in Table 1.
Table 2 gives the basic parameters of the assemblies containing burnable absorber rods. Figure 3 gives the arrangement of combustible absorber in the assembly.

Burnable absorber assembly model (B: burnable absorber rod, G: guide tube, I: instrument tube).
Based on the BEAVRS benchmark core description, the corresponding two-dimensional core fuel burnup calculation model is established; the lattice calculation adopts the multi-group two-dimensional transport theory for fuel burnup calculation, and two group cross-sections are obtained for each assembly type under each fuel type. The lattice calculations are performed using the DRAGON code12,13.
The DONJON code is used to calculate the core fuel burnup14. The DRAGON4.1 and DONJON4.1 were reactor numerical analysis programs developed by the Polytechnic University of Montreal, Canada. Among them, DRAGON4.1 was designed around the solution of the neutron transport equation. DRAGON4.1 is lattice code that contains several computational modules. The main computational modules were the fine-group micro-section database processing module LIB, the geometric feature description module GEO, the spatial discretization module based on the collision probability modules SYBILT, EXCELT, and NXT,, discrete coordinate module SNT, characteristic line module MOC; resonance processing module includes resonance processing module based on the equivalence principle. The resonance processing module includes the resonance processing module SHI based on the equivalence principle, and the subgroup resonance module USS; the transport equation solving module FLU, EDI, EVO, etc. The above modules were implemented in the software package through the program GAN.The above modules were connected together by the program GAN within the package, and the data were exchanged between the modules through a well-defined data structure. In the modeling process, the power was chosen to be constant and the boron concentration was kept constant.
As shown in the Fig. 3, 17 × 17 fuel rods modeling method was chosen in the lattice calculation,, and there were 15 assembly forms according to the distribution of enrichment and absorber, including 1.6% enrichment without absorber, 2.4% enrichment without absorber, 2.4% enrichment with 12 absorber fuel rods, 2.4% enrichment with 12 absorber fuel rods, 3.1% enrichment No combustible absorber, etc. The 3.1% enrichment assembly with 6 absorber fuel rods and the 3.1% enrichment assembly with 15 absorber fuel rods were divided into 4 different assemblies due to their asymmetry as shown in Fig. 4. In the calculation of the lattice, the fuel rod pincell, the guide tube pincell, the burnable absorber pincell and the instrumentation guide tube pincell were filled at different locations according to each assembly, and their specific geometric material structures were shown in the reference15,16. In the assembly modeling process, the boundary conditions were selected as reflection, and the transport equations were solved by the collision probability method. In the selection of the multi-group interface library, the 69-group cross-section library in IAEA's WIMSD4 database is selected, and the DRAGON-readable file format was generated by the NJOY program, and the 2-group homogenized few-group interface is generated by DRAGON for DONJON to read. In the DONJON modeling, 17 × 17 core modeling was selected, and the corresponding assemblies were filled in the middle according to the BEAVRS core arrangement, and the water reflection layers were filled in the periphery of the assemblies. DONJON performs core physics calculations by reading transport cross-sections of various assembies obtained through DRAGON and employing a coarse mesh finite difference method.

Four different assemblies with 15 absorber fuel rods arrangement methods.
LSTM modeling process
The LSTM neural network was used to predict the BEAVRS core effective multiplication factor keff, and different hyperparameters were taken to set up the prediction model17,18,19,20, and the specific process method is shown in Fig. 5.

Flow chart of LSTM-based core effective multiplication keff prediction method.
Data pre-processing
The effective multiplication factor keff was calculated by DRAGON/DONJON over 0–300 days at maximum power with a sampling frequency of one day. Because of the significant difference in the range of values of different feature quantities, the linear normalization17 method (i.e., the maximum normalization method) is used to normalize the feature significant quantities to achieve better model accuracy. The formula is shown in Eq. (6), where x is the initial feature value keff, xmax is the feature maximum, xmin is the feature minimum, and x* is the processed feature value20.
Model training
In this study, the loss function used to train the model is the mean squared error (MSE), which is the proportion of the square difference between the predicted and actual values to the number of samples. Let the sample size be n, the anticipated k-effective value be y*, and the actual k-effective value is y. The formula for MSE is given in Eq. (7), from which it can be deduced that the lower the MSE, the less the error and the greater the prediction effect. The model's accuracy is determined by comparing the absolute error (y* − y) of the predicted k-effective value to the actual value.
In the training set, the prediction model is formed using the processed data and the hyperparameter settings indicated in Table 3. The trained model is used to test the test set according to the processes outlined below: based on the training set, the time steps are combined in order of 1–10 (interval of 1) depending on the performance of the computer used, the number of hidden neurons in the LSTM layer [4, 8, 16, 32], the model regularization coefficient 0.001–0.01 (interval of 0.001), the optimizer The model regularization coefficients are 0.001–0.01 (interval is 0.001), the optimizers are selected [adam, RMSProp, Adagrad, Adadelta], and the appropriate number of iterations epoch, batch size batch, callback function callbacks, and dropout rate dropout are selected.
It uses the L2 regularization factor in conjunction with the dropout layer to minimize model overfitting. Based on Occam's razor21, if anything has two explanations, the most probable true explanation is the one with the fewest assumptions, i.e., the most straightforward answer. Given certain training data and network design, the data may be explained by several weight values (i.e., multiple models). Complex models are more susceptible to overfitting than simple ones. Simple models are those that have fewer parameters. By lowering the complexity of the model by restricting the model weights to smaller values, the weight value distribution becomes more regular. This technique is referred to as weight regularization, which is accomplished by adding the cost associated with bigger weight values to the network loss function, adding L2 regularization factor i.e. the extra cost is proportional to the square of the weight coefficient (L2 norm of the weights) as indicated in Eq. (8), where λ is the regularization parameter, Ein is the training sample error without the regularization factor, and L is the loss function. Dropout22 refers to the deep learning training process. For the neural network training unit, it is eliminated from the network based on a given probability, for stochastic gradient descent. Figure 6 depicts the process of action, which prevents model overfitting by randomly deleting neurons.
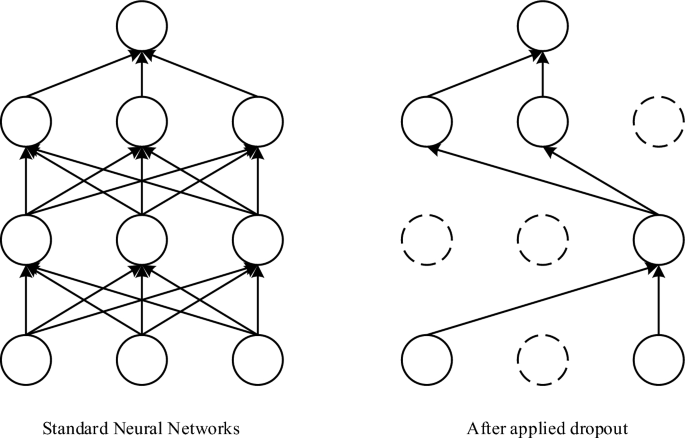
Dropout mechanism diagram.
In machine learning, several optimization techniques23,24 are used to find the best model solution. In contrast to RMSProp, where the absence of correction factors may result in highly biased second-order moment estimates at the beginning of training, Adam contains bias corrections that account for the first-order moments (momentum terms) initialized from the origin and the (non-central) second-order moment estimations.
Analysis of results
The LSTM algorithm time steps were set to 1–10; the number of neural units was 4, 8, 16, and 32; the regularization coefficients were 0.001–0.01 and the optimizers were adam, RMSProp, Adagrad, and Adadelta respectively to model the first 65% of the data set, build a total of 1600 LSTM algorithm models for the next 35% of the data set do predictions and compare the errors, and the absolute error between the predicted and true values is used as the evaluation index, and the results are shown in Fig. 7.

Error map of LSTM model.
It can be learned from Fig. 7 that for the problem of effective core multiplication factor keff, the Adadelta-based LSTM algorithm model has the best prediction, followed by RMSProp and adam, and Adagrad has the worst prediction; for RMSProp, Adagrad, and Adadelta optimizers, the average error increases and then decreases as the regularization factor increases. the mean error increases then decrease, and then increases for the adam optimizer, while for the adam optimizer, it increases with the mean error, as shown in Table 4.
By counting the 1600 models, a total of 138 models had an average error of less than 10 pcm, and the 10 models with the smallest average error were counted, as shown in Table 5. The model with the smallest average error (i.e., the time step of 3, number of cells of 16, regularization factor of 0.003, and optimizer selection of Adadelta) was subjected to error statistics, and the statistical results are shown in Fig. 8.

Error statistics chart.
Conclusion
This paper focuses on exploring the feasibility of the LSTM (Long Short-Term Memory) algorithm in deep learning for effective multiplication factor keff prediction at the core level, modeled by BEAVRS (Benchmark for Evaluation And Validation of Reactor Simulations) core first cycle loading with keff of operating at full power for 0–300 days was used as the study subject. The first 65% of the dataset is the training and validation set, and the last 35% of the dataset is the prediction target. The training and alignment results of the physical parameters of the assemblies were obtained using the DRAGON4.1 and DONJON4.1 codes, and the LSTM algorithm in deep learning was applied. By adjusting the number of LSTM cells, L2 regularization parameters, optimizer type, and other parameter coefficients in the algorithm. The results showed that the absolute error of the predicted core effective multiplication factor keff could be made within 2 pcm by adjusting the appropriate parameters, which validated the successful application of machine learning to transport equations. In the future, we plan to fully leverage the advantages of big data to establish a unified model across multiple operating cycles or different physical models.
Data availability
The datasets generated during and/or analysed during the current study are available from the corresponding author on reasonable request.
References
Oka, Y. Nuclear Reactor Design (Springer, 2014).
Jichong, L. et al. Validation of Doppler temperature coefficients and assembly power distribution for the lattice code KYLIN V2.0. Front. Energy Res 9, 801481 (2021).
Marshak, R. E. Note on the spherical harmonic method as applied to the Milne problem for a sphere. Phys. Rev. 71(7), 443 (1947).
Yang, C. et al. Validation of 3D discrete ordinate transport code with the practical engineering shielding calculation benchmark problems. Ann. Nucl. Energy 176, 109295 (2022).
Ohara, M. et al. Heterogeneous reactivity effect analysis of pu spots considering grain size distribution based on MOC. In International Conference Pacific Basin Nuclear Conference 717–723 (Springer Nature Singapore, 2022).
Yavuz, C. Distinctive stochastic tsunami hazard and environmental risk assessment of Akkuyu nuclear power plant by Monte Carlo simulations. Arab. J. Sci. Eng. 48(1), 573–582 (2023).
Hochreiter, S. & Schmidhuber, J. Long short-term memory. Neural Comput. 9(8), 1735–1780 (1997).
Fischer, T. & Krauss, C. Deep learning with long short-term memory networks for financial market predictions. Eur. J. Oper. Res. 270(2), 654–669 (2018).
Lei, J. et al. Prediction of crucial nuclear power plant parameters using long short-term memory neural networks. Int. J. Energy Res. 46(15), 21467–21479 (2022).
Ren, C. et al. A CNN-LSTM-based model to fault diagnosis for CPR1000. Nucl. Technol. 1–8 (2023).
Horelik, N. et al. Benchmark for evaluation and validation of reactor simulations (BEAVRS), v1. 0.1. In Proc. Int. Conf. Mathematics and Computational Methods Applied to Nuc. Sci. & Eng. 5–9 (2013).
Marleau, G., Hébert, A. & Roy, R. A user guide for DRAGON Version 4 (École Polytechnique de Montréal, 2011).
Lei, J. C. et al. Prediction of burn-up nucleus density based on machine learning. Int. J. Energy Res. 45(9), 14052–14061 (2021).
Hébert, A., Sekki, D. & Chambon, R. A user guide for DONJON version4. Tech. Rep. IGE-300 (École Polytechnique de Montréal, 2013).
Collins, B. et al. Simulation of the BEAVRS benchmark using VERA. Ann. Nucl. Energy 145, 107602 (2020).
Shen, P. F. et al. Mesh-free semi-quantitative variance underestimation elimination method in Monte Caro algorithm. Nucl. Sci. Tech. 34(1), 14 (2023).
Lei, J. et al. Research on the preliminary prediction of nuclear core design based on machine learning. Nucl. Technol. 208(7), 1223–1232 (2022).
Kobayashi, K. et al. Machine learning molecular dynamics simulations toward exploration of high-temperature properties of nuclear fuel materials: Case study of thorium dioxide. Sci. Rep. 12(1), 9808 (2022).
Lerendegui-Marco, J. et al. Towards machine learning aided real-time range imaging in proton therapy. Sci. Rep. 12(1), 1–17 (2022).
Lei, J. et al. Development and validation of a deep learning-based model for predicting burnup nuclide density. Int. J. Energy Res. 46(15), 21257–21265 (2022).
Dunstan, D. J., Crowne, J. & Drew, A. J. Easy computation of the Bayes factor to fully quantify Occam’s razor in least-squares fitting and to guide actions. Sci. Rep. 12(1), 993 (2022).
Garbin, C., Zhu, X. & Marques, O. Dropout vs. batch normalization: An empirical study of their impact to deep learning. Multimed. Tools Appl. 79, 12777–12815 (2020).
Venugopalan, J. et al. Multimodal deep learning models for early detection of Alzheimer’s disease stage. Sci. Rep. 11(1), 3254 (2021).
Pei, J. et al. Scene graph semantic inference for image and text matching. ACM Trans. Asian Low-Resour. Lang. Inf. Process. 22(5), 1–23 (2023).
Acknowledgements
We thank the National Natural Science Foundation of China (No. 12175101), the Natural Science Foundation of Hunan province (no. 2022JJ30345), the Open Fund of State Key Laboratory (KFKT-24-2021006) and the Postgraduate Scientific Research Innovation Project of Hunan Province (CX20220970) for their funding.
Author information
Authors and Affiliations
Contributions
Conceptualization, C.R., L.H. and J.L.; methodology, G.H. and K.G.; software, J.L.; validation, H.Q. and Y.Z.; formal analysis, H.Q. and Y.Z.; investigation, W.L; resources, J.L. and J.L.; data curation, J.L.; writing—original draft preparation, C.R., L.H. and J.L.; writing—review and editing, C.R., L.H. and J.L.; visualization, G.H. and K.G.; supervision, X.Y. and T.Y.; project administration, X.Y. and T.Y.; funding acquisition, X.Y. and T.Y.
Corresponding authors
Ethics declarations
Competing interests
The authors declare no competing interests.
Additional information
Publisher's note
Springer Nature remains neutral with regard to jurisdictional claims in published maps and institutional affiliations.
Rights and permissions
Open Access This article is licensed under a Creative Commons Attribution 4.0 International License, which permits use, sharing, adaptation, distribution and reproduction in any medium or format, as long as you give appropriate credit to the original author(s) and the source, provide a link to the Creative Commons licence, and indicate if changes were made. The images or other third party material in this article are included in the article's Creative Commons licence, unless indicated otherwise in a credit line to the material. If material is not included in the article's Creative Commons licence and your intended use is not permitted by statutory regulation or exceeds the permitted use, you will need to obtain permission directly from the copyright holder. To view a copy of this licence, visit http://creativecommons.org/licenses/by/4.0/.
About this article

Cite this article
Ren, C., He, L., Lei, J. et al. Neutron transport calculation for the BEAVRS core based on the LSTM neural network. Sci Rep 13, 14670 (2023). https://doi.org/10.1038/s41598-023-41543-1
Received:
Accepted:
Published:
Version of record:
DOI: https://doi.org/10.1038/s41598-023-41543-1
This article is cited by
-
An intelligent network framework for driver distraction monitoring based on RES-SE-CNN
Scientific Reports (2025)
-
Research on sports image classification method based on SE-RES-CNN model
Scientific Reports (2024)
