
Abstract
Advanced and eco-friendly construction materials are being developed to reduce pollution and improve wastewater treatment efficiency. One such material is a photocatalytic nanocomposite that uses industrial wastes and natural substances to eliminate pollution. A recent study explored using an inorganic polymer composite (FM) made from a mixture of 70% fly ash and 30% metakaolin, with sodium hydroxide and sodium silicate as an alkali activator. The study evaluated the mechanical and hydration characteristics of the FM composite after 28 days in 100% humidity at room temperature. The study also examined the effect of adding 2.5 wt.% of Nano-TiO2 to FM composite and how it affects its properties. Results indicate that adding Nano-TiO2 to FM composite enhances its mechanical, antibacterial, and photocatalytic capabilities. Specifically, FM-TiO2 composite showed 90% removal of reactive blue 19 dye effluent in sunlight after 90 min, making it an excellent choice for sustainable wastewater treatment. This study presents a cost-effective, eco-friendly solution to wastewater treatment, with added antimicrobial properties from Nano-TiO2.
Introduction
The advancement of society is closely linked to the progress in the industrial sector. However, the industrial sector, which consumes significant water, has caused environmental damage through resource depletion, pollution, and solid waste generation1,2. The rise in synthetic dyes in effluents from various industries has led to environmental issues such as water body impairment, hindered light and oxygen penetration, and toxic effects on aquatic biota3. Synthetic dyes, particularly water-soluble reactive and acid dyes, are a major cause of environmental pollution due to their resistance to conventional wastewater treatment. Their widespread use, low synthesis costs, and diverse range of colors make them a significant concern4. However, their poor biodegradability means that residual colors can persist in wastewater streams, posing a threat to aquatic life due to high levels of chemical and biological oxygen demand, toxic, allergenic, skin-irritant, mutagenic, and carcinogenic characteristics5,6.
Reactive dyes, such as Reactive Blue 19 (RB19), are widely used in the textile industry due to their high solubility and ability to form covalent bonds7. However, around 12–15% of the dye remains unreacted, leading to elevated concentrations in textile wastewater8. Reactive Blue 19 (RB19) is a type of anthraquinone dye that has been extensively utilized in various industries such as textiles, food, paper, pharmaceutics, and cosmetics. According to Holkar et al.9 it has been approximated that approximately 10–15% of the unused dye is ultimately discharged into water bodies during the dyeing process. The removal of RB19 from wastewater has garnered significant attention due to its high toxicity and stability, which results in severe environmental contamination. In recent times, a range of techniques have been utilized to treat wastewater originating from textile production. These include the employment of conventional methods such as coagulation10, adsorption11, aerobic or anaerobic biosorption12 and advanced chemical oxidation or photochemical degradation13. Photochemical degradation is widely considered to be one of the most efficient methodologies available.
Photochemical degradation, a process that employs various semiconductor oxides, namely titanium dioxide (TiO2), tungsten trioxide (WO3), tin dioxide (SnO2), zinc oxide (ZnO), combined oxides14,15, and modified oxides16, is known for its photocatalytic activity. Of these, TiO2 has been widely utilized due to its unique properties, including non-toxicity, low cost, potent oxidation capabilities, and exceptional chemical stability17. One of the Limitations inherent in this process pertains to the arduousness of segregating the liquid and solid photocatalyst subsequent to the elimination of contaminants. As a result of this challenge, numerous solid substrates18,19 have been examined by researchers as a means of immobilizing WO3 and TiO220.
On the other side, the matter of waste deposition in industrial facilities warrants consideration, specifically in relation to the disposal of fly ash (FA) that results from power plant operations. The ingredients of fly ash vary considerably based on the origin and composition of the coal employed during combustion. However, all fly ash contains substantial amounts of silicon dioxide (SiO2), aluminum oxide (Al2O3), iron oxide (Fe2O3), and calcium oxide (CaO)21. The utilization of fly ash waste in a contextualized methodology could potentially provide efficacious remedies for eliminating the detrimental impact of industrial dyes on the environment. The chemical composition of manufacturing dyes, which incorporates one or more aromatic rings with chromophore groups such as the azo group (–N = N–), renders them highly stable and resistant to degradation22.
Several studies have been conducted to enhance the mechanical characteristics of photocatalyst materials while minimizing the amount of material utilized. Numerous studies have been undertaken in order to achieve this goal using various structural bases, such as cementitious materials, clays, and geopolymers, for photocatalysts23. Geopolymers are synthesized by means of geopolymerization, a chemical process that entails the interaction between aluminosilicate and an alkaline solution generally comprising sodium hydroxide and sodium silicate24. Due to their amorphous polymeric structures, geopolymers exhibit qualities such reduced carbon dioxide emissions during manufacture, excellent adsorption ability, high stability chemically, strong compressive strength, high durability, mechanical resistance, and thermally stable. Geopolymers are being used as "self-cleaning" building materials, which is another new application for them, they can also be used as supports for photocatalysts25. The raw materials used for the manufacturing of geopolymers, regardless of their intended use, demand a considerable amount of silica and alumina, which can be obtained from a range of sources such as fly ash, kaolin, zeolites, rice hulls, etc.
Various studies have revealed that geopolymers produced from diverse raw materials possess the potential to serve as adsorbents and/or photocatalysts, as noted by Ahmed et al.11, Fallah et al.26, and Hertel et al.27. Prospectively, adding semiconductor-based photocatalysts to geopolymers may enhance their capacity for self-cleaning28,29. On conventional building materials, this strategy has been demonstrated to be effective30,31 For instance, Janus et al.32 showed that the inclusion of nitrogen and carbon co-modified TiO2 photocatalysts into raw cement material improved the removal of a typical organic water contaminant by up to 60% under UV/vis light. Kaya-Özkiper et al.33 investigated the performance of red mud (RM) and metakaolin (MK)-based geopolymers for the adsorption and photocatalytic degradation of methylene blue to demonstrate their potential as self-cleaning, environmentally friendly construction materials.
On the other hands, geopolymers and OPC-based concrete have antimicrobial properties in dry conditions due to their alkaline nature. However, certain bacteria, like sulphur-oxidizing bacteria, can inhabit these surfaces in humid conditions, producing acidic compounds that damage the material and lower its pH34. The porous nature of geopolymers makes them more vulnerable to microbial corrosion34. High resistance to microbial degradation is crucial for construction materials in aggressive environments like sewers, sewage treatment plants, and water. Geopolymer and OPC-based concrete antimicrobial protection techniques have been developed to reduce microbial deterioration and use in aggressive applications like sewage systems. Inorganic agents like copper oxide and zinc oxide can combat microorganisms in nanoparticles but may pose toxicity or environmental hazards. TiO2, due to its low toxicity and photocatalytic activity, can serve as an antibacterial and self-cleaning ingredient in outdoor geopolymer applications due to its low toxicity34.
There is a lot of research in the literature on the influence of nanoparticles on the photocatalytic capabilities of geopolymers toward various types of organic dye. On the other hand, the effect of geopolymer-containing nanoparticles on the elimination of reactive organic dyes pollutant has received little attention. The goal of our present study is to create a novel inorganic polymer (geopolymer) that can be made from industrial and natural waste materials such as fly ash and metakaolin, has superior cement properties, and has environmental and biological applications. Our study focuses on the effect of the addition of 2.5% by weight of nano TiO2 on the mechanical and hydration properties of a geopolymer composite containing 70% FA and 30% MK (FM). In the same manner, we study the photocatalytic behavior of FM and FM-TiO2 geopolymer composites for the removal of reactive organic dye pollutants (Reactive blue 19) from wastewater under sun light. Additionally, enhancing the novel low-cost geopolymer composite's (FM) antimicrobial properties with the addition of nano-TiO2 particles.
Materials and research methodologies
Materials
Fly ash (FA), metakaolin (MK), sodium hydroxide (NaOH), and liquid sodium silicate (Na2SiO3) were the ingredients employed in this work to manufacture the fly ash/metakaolin-based geopolymer (FM). Furthermore, the nano titanium oxide used in this research is Titanium (IV) oxide TiO2 NPs Nano powder, 21 nm primary particle size (Tem), ≥ 99.5% trace metals basis, Lot # MKBV3126V was purchased as 718,467-100G from ALDRICH Chemistry35. Hemts Construction Chemical Company in Cairo, Egypt, provided the metakaolin for the examination. Cairo, Egypt's El Nile overseas chemical company offers Class C fly ash (FA). From Burg Al-Arab, Alexandria, Egypt, Silica Egypt Company has supplied commercial liquid sodium silicate (LSS) with a silica modulus of 2.80 SiO2/Na2O.Silica. The NaOH flakes have a purity of 99% and are purchased from EL-Goumhouria Chemical Company in Cairo, Egypt. Figure 1A,B illustrate the XRD patterns of fly ash and metakaolin. Table 1 additionally demonstrates the raw material's chemical oxide composition, which was utilized in the current study. The adsorption and photo-degradation experiments were conducted using the effluent from a reactive blue 19 dyeing bath. Figure 1C depicts the structure of this dye.

XRD patterns for the raw materials (A, B) and Chemical Structure of Reactive blue 19 (C).
Methods
Dyeing procedures
The wool was first dyed at a temperature of 95 °C and a pH of 4.5 for an hour. The wastewater from this dyeing process was collected. Afterwards, the same wastewater was re-used to dye the wool again for another hour at 95 °C and pH of 4.5. The wastewater from the second dyeing process contained dye content of 500 mg/L and was treated for further use.
Preparation of eco-friendly inorganic polymer composite samples
Preparation of FA/MK geopolymer composites for mechanical and microstructure, and antibacterial examination. For the manufacture of geopolymer pastes FM and FM-TiO2, 70% fly ash (FA) is first thoroughly mixed with 30% metakaolin (MK), in a dry environment until entirely homogenous. In the case of geopolymer mix F, we use 100% fly ash to prepare the paste. The alkaline activator solution was created by combining sodium hydroxide pellets with liquid sodium silicate in a 15:15 wt.% solid ratio. The liquid was allowed to cool to room temperature after creating a clear gel36. In the case of geopolymer mix FM-TiO2, we add 2.5 wt.% from nano TiO2 to alkaline activator solution and stir well for half an hour. To create a homogeneous geopolymer paste, dry components, and an alkaline activator solution are mixed with a total liquid/solid ratio of 0.27. Table 2 summarizes the components of each mix, in addition to the liquid/solid ratio that gives standard consistency. Next, one-inch-diameter cubic stainless-steel molds are filled with freshly developed pastes. To achieve the process of setting and hardening, the molds are kept at room temperature for the first 24 h with a relative humidity of 100%. The cubes were de-molded after molding and covered and cured for 3.7, 14, and 28 days at 100% relative humidity. The cubes were removed from their curing environment after each hydration period, and the compressive strength and total porosity% of various geopolymer composite mixes were measured. For the antibacterial test, six-disc specimens with a diameter of 12 mm and a thickness of 2 mm were created for each geopolymer composite (FM and FM-TiO2). These specimens underwent 7 days of hydration under curing conditions of room temperature and relative humidity of 80–90%.
Preparation of adsorbent samples from fly ash/metakaolin based -geopolymer composite. After 7 days of curing for geopolymer mix FM and FM-TiO2, the broken compressive strength test cubes were employed for adsorption and photodegradation examinations. These broken cubes were then immersed in a 1:1 mixture of ethanol and acetone to stop the hydration process. The mixture was agitated for 30 min on a magnetic electrical stirrer, after which the residue was filtered, washed in ethanol, and dried for 24 h at 50 °C37. After being ground to a mean particle size of 100 μm, dried samples are put in a desiccator. Table 2 provides the composition of the various mixtures in addition to the liquid/solid ratio that produced homogenous consistency.
Investigation techniques
The mechanical properties of fly ash/metakaolin-based geopolymer composite with and without Nano TiO2.
The compressive strength of the hardened paste is determined using a set of three cubes. The three measurements are averaged out to get the data, which is shown in MPa. The compressive strength was evaluated in this study utilizing a manually operated compression device (D550-control type, Milano, Italy). The hydration of crushed cubic specimens is stopped after the compressive strength test. Before being preserved for morphological examination, the crushed samples were mixed with an alcohol and acetone stop solution (1:1) and dried at 50 °C for 24 h37. On the other hand, the total porosity% of a geopolymer mixes composite is estimated by weighing specimens of the dry paste suspended in air and water, labeled W1 and W2, for three separate cubes. The weight of these cubes in the air, known as W3, is then calculated after they have dried at 100 °C for around 24 h. The following formula (1) is used for the calculation of the percentage of total porosity (%P)38,39.
The microstructure Analysis (XRD, SEM and FTIR).
A complete investigation of the phase composition of the hydration products in several samples of geopolymer mix was made possible by the X-ray diffraction analysis carried out on the Bruker D8 Discover diffractometer (Germany). Cu-K radiation with a wavelength of 1.45 Ao, a pixel detector set to 40 kV, and 40 mA was used in conjunction with a Ni-filtered diffractometer to get precise findings. Important details on the composition, characteristics, and degree of amorphousness of the geopolymer mix samples were disclosed by the data gathered from this analysis. On the other hand, FTIR measurements were performed on a Perkin Elmer 1430 infrared spectrophotometer (USA) using pellets of potassium bromide (KBr), with wave numbers ranging from 400 to 4000 cm−1. The functional groups of the hydration products created for various geopolymer composite samples were determined using this analytical technique. High-resolution scanning electron microscopy (SEM) was used to characterize the surface and structural morphology of the geopolymer samples produced. Analysis studies were conducted using FEI Quanta FEG 250 equipment (USA).
Adsorption experiments
On the adsorption capabilities of the FM geopolymer composite against reactive blue 19 dyeing bath effluent, the impacts of the addition of nano TiO2, adsorbent dose, pH value, and contact time were examined. A certain amount of the adsorbent (0.01–0.15 g) and 50 mL of dyeing bath effluent solution with a concentration of 250 mg/L were combined in a water bath at 140 rpm and 30 °C at various contact times and pH levels 40,41,42. Reactive blue 19 dyeing bath effluent was tested to determine the optimum pH, contact time, and adsorbent dosage that would provide the highest removal efficiency. Filtration could be used to establish a residual of the sample solutions. Using V-670 Spectrophotometer, we measured the absorbance [at max = 595 nm for reactive blue 19 dye] and then deduced the solution's concentration from the calibration curve. The Removal effectiveness % was calculated using Eqs. (2) and (3), which showed how much dye had been adsorbed onto the geopolymer material43,44.
While Co and C indicate initial and equilibrium liquid-phase concentrations in milligrams per liter, respectively; V represents the volume of the solution in milliliter, and W indicates the weight of the adsorbent in grams.
Photodegradation experiment
In order to examine photodegradation, 0.1 g of the geopolymer composites (FM and FM-TiO2) were mixed with 50 mL of a solution containing 50 mg/L of reactive blue 19 dye (RB) effluent and put in a quartz beaker under magnetic stirring. For different periods of time—30, 90, 120, 180, and 240 min—the system was directly exposed to sunlight, a natural source of UV radiation. A residual of the sample solution after each time interval can be obtained via filtration. A Jasco V-670 double-beam spectrophotometer (Hachioji Tokyo, Japan) was used to evaluate the RB dye effluent content in the solution via absorbance at 593 nm (λ-max of RB) in the UV–vis spectrum in order to analyze the decomposition of organic dye effluent. The Removal effectiveness% was calculated using Eqs. (4).
Co and Ct denote the dye solution's concentration at the start and end of the absorption process, respectively.
Antibacterial activities test of the prepared eco-friendly inorganic polymer composites with and without nano-TiO2
Six pathogenic bacterial strains representing Gramme-positive and Gramme-negative bacteria, including Staphylococcus aureus, Escherichia coli, Bacillus subtilis, Candid, Aspergillus, and Pseudomonas, were used to test the antibacterial activity of two geopolymer composites FM and FM-TiO2. To conduct the antimicrobial susceptibility test, the Kirby-Bauer Disc Susceptibility Test and measuring zones of inhibition methods were utilized45,46. To grow the bacteria, we used MacConkey agar, MacConkey broth, and nutrition agar as the growth media. The manufacturer's instructions were followed in the preparation of all the media. We created an inoculum for each bacterial isolate by emulsifying 2–4 colonies in sterile distilled water and adjusting the turbidity to 1.5 × 10⁸ CFU mL−1 (similar to 0.5 McFarland standard) using the Koneman et al.47 method. We then applied the standardized bacterial suspension to the agar plates using a sterile cotton swab. The plates were left to dry for 2–5 min. After that, two geopolymer composite discs (FM and FM-TiO2) were put on the plates and gently pushed to make sure the agar was adequately covered. To prevent inhibition zones from overlapping, a minimum gap of 12 mm between the plates' borders was maintained. For two to five days, the plates were incubated at 37 °C. Following that, the plates were investigated and the diameters of the inhibiting zones in millimetres (mm) were measured, and this information was used to determine the test agent's antibacterial activity. The experiment was repeated several times, and the average reading was noted.
Results and discussion
The mechanical and microstructure characteristics of eco-friendly inorganic polymer composite with and without nano-TiO2
Compressive strength evaluation
Compressive strength experiments were conducted to examine the mechanical characteristics of inorganic polymer (geopolymer) composites incorporating and without nano-titanium oxide (2.5 wt%) (FM and FM-TiO2) (Fig. 2). As illustrated in Fig. 2, all geopolymer mixes possess compressive strength values rising as the cure period increases. This is explained by the fact that a high alkali medium accelerates fly ash and metakaolin dissolution, providing the system with silicate and aluminate species. As a result, this led to an increase in the rate of hydration as well as the production of extra hydration products like CSH, CASH, and N-(C)ASH gel that precipitated in the open pores, enhancing the compressive strength13,48. In comparison to pure geopolymer composite (FM), geopolymers with nano-TiO2 added (FM-TiO2) demonstrated greater mechanical strength. After 28 days of hydration and during the extended hydration period, the incorporation of nano-TiO2 accelerated the polymerization process and enhanced the compressive strength of the composite49. The geopolymer composite MF-TiO2 attained its maximum compressive strength value (65 MPa) after 28 days of hydration. It concluded that the interfacial transition zone was reduced as a result of the interfacial adhesion between the nano-TiO2 particles and the fly ash/metakolin-based geopolymer50. The impact of nanotitanium oxide on the mechanical attributes of geopolymers has been the subject of numerous research reports51,52,53. In our study, the compressive strength enhanced by the addition of 2.5 wt.% of nano-TiO2 (FM-TiO2) was 17.65% higher than that of the geopolymer sample FM after 7 days of hydration. On the other hand, according to our results, the compressive strength improved by 10.96, 11.76 and 11.28% compared to the MF sample at different hydration periods of 3, 14, and 28 days, respectively. Our findings are consistent with later studies53,54, which reported that the incorporation of nano-titanium dioxide (NT) accelerated the polymerization process and enhanced the compressive strength of geopolymer composites.

Compressive strength data for inorganic polymer composite (FM) with and without nano-TiO2 throughout a range of hydration times.
Total porosity (P%) examination
The total porosity of several geopolymer mix cubes FM, and FM-TiO2, cured at 100% humidity for 3, 7, 14, and 28 days are displayed in Fig. 3. The total porosity % values of all inorganic polymer composites (FM, and FM-TiO2) decreases with increasing curing time. These data show how the polymerization process is developing by time11,39. There was an increase in the production of hydration products, which precipitated in certain open, accessible pores and decreased the percentage of total porosity11. As illustrated in Fig. 3, adding nano-TiO2 to geopolymer composite MF decreases the total porosity values at all hydration stages. This may be caused by a reduction in the number of pores as a result of the inter-particle diffusion of nano-TiO2 into the interior pores of the geopolymer matrix39, which causes the filling of open pores and lowers the overall porosity values.

Total porosity % results for inorganic polymer composites (FM) with and without nano-TiO2 throughout a range of hydration times.
Fourier transform infrared spectroscopy analysis (FTIR)
The Fig. 4 shows the Fourier transform infrared (FTIR) examination results of fly ash and metakaolin-based geopolymer pastes (MF and MF-TiO2) after 7 and 28 days of hydration. In contrast, Fig. 4 also shows the FTIR of the remaining precipitate of the geopolymer composites following the photocatalytic degradation process of reactive blue 19 under sunlight. As we notice from Fig. 4, the absorption band in the range of 1415–1456 cm−1 was formed as a result of the carbonation of calcium hydroxide. It appeared in the FTIR spectrum of the FM composite and completely disappeared in the FM-TiO2 mix, which may be attributed to the inter diffusion of NT particles inside open pores of geopolymer composites and inhibited the carbonation of hydration products49. For both geopolymer composites, the FTIR spectra show absorption bands in the ranges of 1639–1648 cm−1 that are connected to the bending vibration modes of the H–O–H group. It demonstrates the way fly ash and metakaolin species may decompose and condensation when an alkaline activator solution is used, producing an excessive quantity of hydration products inside the geopolymer matrix55. The inclusion of NT had no noticeable effect on the type of hydration products formed in FTIR spectra, as we notice from Fig. 4. A prominent absorption band between 956 and 968 cm−1 is also seen in Fig. 4 for both FM and FM-TiO2 composites, and it is thought that this band is related to the asymmetric stretching vibrations of Si–O–T (where T is either Si or Al). This is supported by the intensity of bands at around 777 cm−1 and 689 cm−1, which, respectively, correlate to the symmetric stretching vibrations of (Si–O–Si) and (Si–O–Si or Al–O–Si), confirming the complete dissolution of unreacted silica and the progression of the polymerization process38,39. As we observed from Fig. 4 the incorporation of NT inside the geopolymer retards the hydration process with time, as indicated by a decrease in the intensity of the asymmetric stretching vibrations of Si–O–T at 962 cm−1 for the FM-TiO2 mix after 28 days compared with the reference sample FM. These may be related to the presence of NT decreasing the number of pores on the surface of the geopolymer composite, which affects the geopolymerization process49. Furthermore, the presence of Ti–O–Ti photosensitive species was linked to the band's appearance at approximately 704 cm−1 in FM-TiO2 geopolymer49. Another indicator of NT particle dispersion inside the geopolymer matrix was the band of the O–Si–O bending vibration appearing for FM-TiO2 at 453–458 cm−149,56. On the other hand, Fig. 4 shows that after degradation by sunlight, the asymmetric stretching vibration of the Si–O–T band in the FM and FM-TiO2 composites containing reactive blue 19 dye effluent shifts to higher wave numbers of 988 and 995 cm−1, respectively. This could be the result of the dye molecules adhering to the geopolymer matrix's active site, slowing down the rate of geopolymerization 11,39.

FTIR spectra of fly ash/metakaolin-based geopolymer composites (FM, and FM-TiO2) at 100% humidity for 7 and 28 days, and after the sunlight photodegradation process.
Crystalline phase identification (XRD)
After 7 days of being hydrated, the XRD patterns of FM and FM-TiO2 geopolymer composites are displayed in Fig. 5. The fly ash and metakaolin species seem to have completely disintegrated and dissolved due to alkaline activation and the creation of an amorphous geopolymer matrix, according to Fig. 5, which displays a hug and broad hump between 2θ = 22°–38°48,49. The study found that two types of hydration products were formed during the geopolymerization process. The first type is a crystalline phase, verified as C–(A–S–H) with d-values of 3.70, 3.29, and 2.61 Å (Fig. 5). The second type of hydration product was the amorphous to semi-crystalline phase C-S–H. This was evident in both geopolymer composites' XRD patterns at 2θ = 17°, 29°, 33°, and 54°, indicating the generation of amorphous and crystalline phases throughout the geopolymerization process. The addition of NT particles to geopolymer composite FM has no effect on the type of hydration product created49, as shown in Fig. 5. The XRD spectra also reveal strong peaks at 26.8°(2θ) (quartz peak), indicating that the geopolymer composites have formed a glassy phase50. The Fig. 5 illustrates the effect of adding nano-TiO2 filler to the geopolymer composites FM, showing a slight shift to a higher angle (from 26.58⟶26.63°). This indicates the filler's destructive effect on the ordered arrangement of the geopolymer side chains and the consequent enhancement of the amorphous phase50. The interaction between the filler surface and the geopolymer may be what is causing this detrimental impact49,50. We also observed that when NT was added to the geopolymer composites, the anatase phase developed at 2θ = 25.25° and 48°49. Additionally, we noticed a reduction in the intensity of quartz peaks, indicating that NT accelerates saturation and creates saturated materials through polymerization49. As a result, the size and quantity of unreacted raw material particles were thought to be reduced. This XRD study's observations show a harmonious correlation with Raj et al.'s 2023 findings49. The addition of NT improved the properties of fresh and hardened geopolymer composites.

X-ray diffraction pattern of geopolymer composites with and without with various nano-TiO2 after 7 days of hydration.
Scanning electron microscope (SEM) of different eco-friendly geopolymer composite mixes
SEM imaging was used to examine the morphology of the geopolymer composite mixes (FM. FM-TiO2) after 7 days of hydration, as shown in Fig. 6a,b,c,d,e,f. The microstructure of the FM geopolymer (Fig. 6a) appeared to be less dense and more porous than that of the FM-TiO2 geopolymer-NanoTiO2 composite mix (Fig. 6b). This could be due to the development of more aluminosilicate gel in the geopolymer composite, resulting in greater compactness49,56. Moreover, the evenly dispersed nanoparticles served as fillers in the empty spaces, filling the gaps created by the geopolymer particles56. The addition of NT led to densification of the microstructure of geopolymer composites, according to the authors49. The nucleation and nanopore-filling effects of NT also influenced the rate of hydration49. Figure 6a,b,c,d,e,f shows that the microstructure of the FM-based geopolymer composite was improved by the addition of 2.5% NT particles, resulting in more reacted fly ash and metakaolin particles, as well as a dense structure. Our findings are consistent with previous studies conducted by Samsidar-Nurfadilla and Sahitya -Sastry57,58, which showed that the use of NT reduces the size and amount of unreacted FA particles and accelerates saturation resulting in the production of saturated materials through polymerization and nanoparticle stuffing.

SEM image of geopolymer composite mixes after 7 days of hydration, corresponding different magnification view; (a) MF (3000x); (b) MF-TiO2 (3000x); (c) MF (6000 x); (d) MF-TiO2 (6000x); (e) MF (12,000 x); (f) MF-TiO2 (12000x).
Different applications of FM and FM-TiO2 geopolymer composites
Antibacterial activity of geopolymer composites
First, we study the antibacterial application of our prepared eco-friendly inorganic polymer composites, FM and FM-TiO2, towards different microbes. According to Table 3 and Fig. 7A,B, both geopolymer composites with and without nanoparticles generally exhibited significant antibacterial activity, as shown by measured zones of inhibition. The geopolymer sample FM-TiO2 has better biological activity for Escherichia coli, Candida albicans, and Pseudomonas aeruginosa than the FM composite. This may be attributed to the fact that the presence of nano-TiO2 particles inside the geopolymer matrix enhanced the biological activity of geopolymer materials towards some microorganisms compared to others34. These findings supported the outcomes of another recent investigation by Gutiérrez et al., 202059, which found that geopolymers containing TiO2 nanoparticles were "satisfactory" in inhibiting the growth of the bacteria E. coli and Pseudomonas aeruginosa. However, the geopolymer FM and FM-TiO2 demonstrate the same antibacterial efficacy against Aspergillus niger. According to our results, the addition of nano-TiO2 enhanced the antimicrobial activity of the eco-friendly fly ash/metakaolin geopolymer composite.

The images display the zone of inhibition of: (A) FM, and (B) FM-TiO2 against several Gram-positive and Gram-negative microorganisms.
Adsorption and photocatalytic activity of FM and FM-TiO2 geopolymer composites
The two new environmentally friendly geopolymers developed in this study can also remove dye effluent from wastewater as another application. It is known that dyes are widely used in dyeing fabrics, especially blue. And when using reactive dyes in dyeing fabrics, especially when using high concentrations, about 40% of the original dye weight remains in the dyeing bath, so we reused the dyeing bath, and yet about 5% of the dyeing weight remains. Therefore, the aim of this part of the study was to treat the wastewater from the dyeing baths in order to reuse it and preserve the environment at the same time.
-
A.
Adsorption efficiency of FM and FM-TiO2 geopolymer composites
-
1-
Effect of pH on the removal efficiency
The Fig. 8A demonstrates the effect of pH on the removal of reactive blue 19 dye effluent (250 mg/L) from an adsorption bath. Additionally, it was feasible to calculate the optimal pH value for geopolymer composite adsorption by treating dye effluent with fly ash/metakaolin-based geopolymers (FM and FM-TiO2) at a variety of pH ranges (2–10). According to the outcomes from Fig. 8A, the percentage of dye removal decreases with a pH higher than 4. Furthermore, the removal efficiencies for reactive blue dye effluents were at their highest levels when using the geopolymer composites FM and FM-TiO2, which reached their maximum values at 35.5% and 45.5%, respectively, at pH 4. The optimal pH for the adsorption and photodegradation studies was determined to be 4, as higher pH values decreased dye adsorption. We also observed that the addition of NT particles to the geopolymer increased its adsorption towards reactive blue 19 dye effluent under all pH ranges.
Figure 8 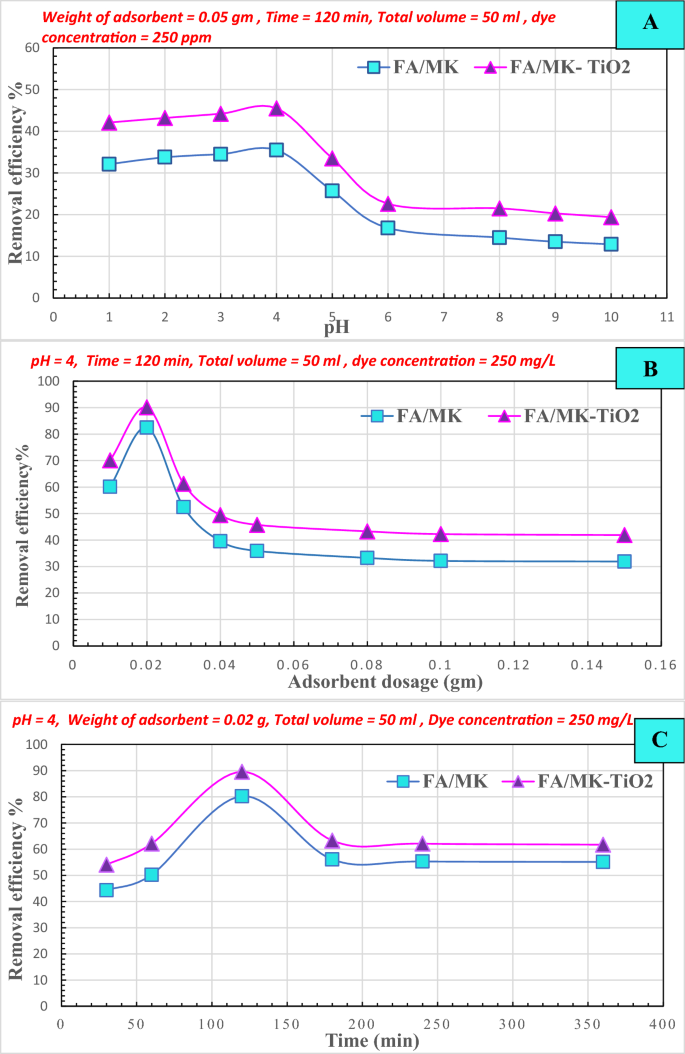
Different adsorption factors affecting on reactive blue 19 dye effluent removal efficiency % by geopolymer composites FM and FM-TiO2: (A) pH, (B) Adsorbent Weight, and (C) Time.
-
2-
Effect of the dosage of adsorbent
Based on Fig. 8B, the quantity of absorbent has an impact on the removal efficiency. The experiment involved testing the adsorption of dye effluents using reactive blue 19 dye (250 mg/L) and different amounts (ranging from 0.01 to 0.15 g/50 mL) of geopolymer composites (FM and FM-TiO2) for 120 min, with a pH of 4. The removal efficiency decreases as the weight of the absorbent increases, as shown in Fig. 8B. At 0.02 g/50 mL, the FM-TiO2 geopolymer composite exhibited a maximum removal efficiency of 90.1%, while the FM geopolymer mix achieved the highest removal efficiency of 82.5% at the same absorbent weight.
-
3-
Effect of time
The ideal time for reactive blue 19 dye effluent (250 mg/L) interaction with the fly ash/metakaolin geopolymer composite, with or without nano-TiO2, was determined by treating the composites under different procedure for varying time periods (30–360 min). The results depicted in Fig. 8C illustrate how prolonging the adsorption period could improve the dye's removal efficiency. The amount of color that was removed improved over time until it reached a maximum value, at which point removal efficiency stabilized. The decolorization rate for the FM geopolymer composite at 120 min is 80.22%, while it is 89.56% for the FM-TiO2 geopolymer composite.
From all the adsorption test results, we observed that the FM-TiO2 has a larger adsorption capacity than the FM, which suggests that applying TiO2 to the geopolymer may enhance its adsorption capacity60. As a result of their porous structures and the presence of active sites on their surfaces, the FM and FM-TiO2 composites both exhibit adsorption capabilities60.
-
1-
-
B.
Sunlight photodegradation of reactive blue 19 dye effluent
In our previous study13, we modified a metakaolin /cement kiln dust—based geopolymer composite to remove organic reactive dye effluent from wastewater by two different methods: adsorption and solidification of organic pollutants inside the geopolymer matrix. In this study, we examined the removal of reactive organic dye pollutants by adsorption and photodegradation under sunlight as a low-cost and effective removal method. We investigated the photocatalytic activity of novel fly ash/metakaolin based- geopolymer composite with and without nano-titanium oxide (FM-TiO2) against reactive blue 19 dye effluent. Both geopolymer composites were subjected to direct exposure to ultraviolet (UV) radiation from the sunlight in order to conduct the photodegradation test61. Figure 9 illustrate the degradation degree % of reactive blue 19 dye effluent solution (50 mg/L) under sunlight using 0.1 g of FM and FM-TiO2 geopolymer for a period of 30 min to 6 h. Figure 8 shows also, the effectiveness of geopolymer FM-TiO2 in removing reactive blue 19 dye effluent in the absence of light. To determine the amount of dye effluent adsorbed and degraded by geopolymer composites in sunlight, we examined the removal of dye effluent in the dark during the same duration (Table 4). Based on the results presented in Fig. 9 and Table 4, it is evident that the dye effluent solution begins to degrade after being exposed to sunlight for 30 min. As time goes on, the rate of degradation increases, providing evidence of the active role played by the TiO2 nanoparticles that are incorporated in the geopolymer paste as photocatalysts. It is worth noting that geopolymer FM on its own exhibits excellent efficiency in removing and degrading reactive blue 19 dye effluent (RB) when exposed to sunlight61,62. This can be attributed to the presence of various oxides, such as Fe2O3, CuO, and TiO2, in the geopolymer composition, as evidenced by the XRF analysis of the fly ash and metakaolin raw materials (Table 1). In the first 30 min, all geopolymer composites (FM and FM-TiO2) show a rapid decrease in RB dye concentration. This is due to the availability of active sites on the geopolymer composite surface for adsorption, which become saturated over longer adsorption durations61. Our study suggests that both the adsorption and degradation mechanisms are involved in RB dye pollutant removal, as indicated in Table 4. According to Fig. 9 and Table 4, both geopolymer composites achieved maximum RB removal in approximately the first 90 min. After that, the adsorption process slowed down, while photodegradation appeared to slightly increase over time. It stabilized after 180 min. The photocatalyst's active sites are deactivated by significant by-product deposition, causing a short lifetime and slow dye degradation after long time62.
Figure 9 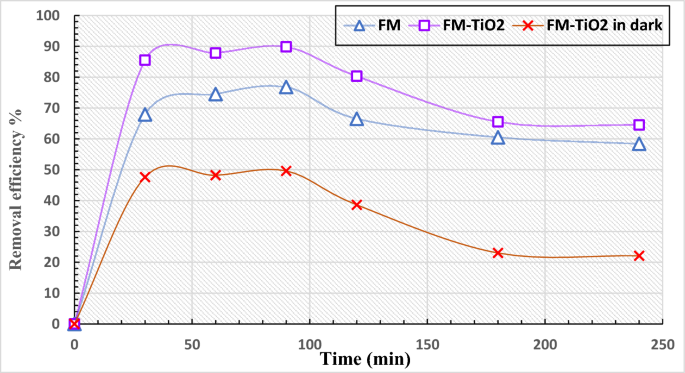
The removal efficiency % of reactive blue 19 dye effluent with FM and FM-TiO2 under different time, in dark and after exposure to sunlight. (wt. of adsorbent 0.1 g, Temperature 30 °C, pH 4, concentration of dye 50 mg/L).
Table 4 Values of adsorption and degradation % for reactive blue 19 effluent loaded by nano-TiO2-FM geopolymer composites after different time under sunlight and dark condition.


Conclusion
Our study results reveal that novel geopolymer composites made of 70% fly ash and 30% metakaolin (FM) offer sustainable, eco-friendly alternatives to conventional cement. The outcomes also show that adding 2.5% nano-TiO2 particles to geopolymer composite, FM, has a beneficial impact on its mechanical and antibacterial properties as well as in the environment application for removing industrial organic dye contaminants from wastewater. The following conclusions can be made in light of the experimental findings:
-
The compressive strength of geopolymer composite FM is improved when 2.5 wt.% of nano-TiO2 (FM-TiO2) is added at all hydration periods, from 3 to 28 days.
-
The addition of nano-TiO2 to geopolymer composite MF results in a reduction in total porosity values at all hydration ages, which can be attributed to inter-particle diffusion of nano-TiO2 into the internal pores of the geopolymer matrix, leading to a decrease in the total number of pores.
-
The XRD patterns and SEM images suggest that the inclusion of nano-TiO2 fillers in the geopolymer composites accelerate the geopolymerization process. This is evidenced by the decrease in size and quantity of unreacted raw material and the densification of the microstructure of geopolymer composites FM.
-
The FTIR spectra for geopolymer composites FM and FM-TiO2 indicate that excessive hydration products may develop and precipitate inside the geopolymer matrix. However, the type of hydration products generated did not change significantly upon the addition of NT.
-
Both FM and FM-TiO2 demonstrated strong antibacterial activity, but FM-TiO2 showed superior biological activity against Escherichia coli, Candida albicans, and Pseudomonas aeruginosa compared to FM.
-
Based on photodegradation data, it has been found that the effluent of reactive blue 19 dye (RB) can be effectively removed and degraded by both the geopolymers FM and FM-TiO2 when exposed to sunlight. But presence of NT improve the reactive blue 19 dye degradation.
This research holds significant importance in the development of eco-friendly and sustainable construction materials that possess antibacterial properties and can efficiently eliminate harmful pollutants from wastewater. The use of such materials has the potential to revolutionize the construction industry by addressing both environmental and health-related concerns.
Figure 10 depicts the main goals of our investigation.

Diagram illustrating our study’s targets.
Data availability
All data generated or analyzed during this study are included in this published article. Datasets are available in the manuscript.
References
Kabra, A. N., Khandare, R. V. & Govindwar, S. P. Development of a bioreactor for remediation of textile effluent and dye mixture: A plantbacterial synergistic strategy. Water Res. 47(3), 1035–1048. https://doi.org/10.1016/j.watres.2012.11.007 (2013).
Kansal, S. K., Singh, M. & Sud, D. Studies on photodegradation of two commercial dyes in aqueous phase using different photocatalysts. J. Hazard Mater. 141(3), 581–590. https://doi.org/10.1016/j.jhazmat.2006.07.035 (2007).
Mittal, A., Mittal, J., Malviya, A., Kaur, D. & Gupta, V. K. Adsorption of hazardous dye crystal violet from wastewater by waste materials. J. Colloid Interface Sci. 343, 463–473 (2010).
Aksu, Z. & Akın, A. B. Comparison of remazol black B biosorptive properties of live and treated activated sludge. Chem. Eng. J. 165(1), 184–193. https://doi.org/10.1016/j.cej.2010.09.014 (2010).
Ertaş, M., Acemioğlu, B., Alma, M. H. & Usta, M. Removal of methylene blue from aqueous solution using cotton stalk, cotton waste and cotton dust. J. Hazard. Mater. 183(1–3), 421–427. https://doi.org/10.1016/j.jhazmat.2010.07.041 (2010).
Gupta, V. K., Jain, R., Nayak, A., Agarwal, S. & Shrivastava, M. Removal of the hazardous dye—tartrazine by photodegradation on titanium dioxide surface. Mater. Sci. Eng. C 31(5), 1062–1067. https://doi.org/10.1016/j.msec.2011.03.006 (2011).
Ozcan, A., Omeroglu, C., Erdogan, Y. & Ozcan, A. S. Modification of bentonite with a cationic surfactant: An adsorption study of textile dye reactive blue 19. J. Hazard. Mater. 140, 173–179. https://doi.org/10.1016/j.jhazmat.2006.06.138 (2007).
Ferrero, F. & Periolatto, M. Functionalized fibrous materials for the removal of dyes. Clean. Technol. Environ. Policy 14, 487–494. https://doi.org/10.1007/s10098-011-0442-5 (2012).
Holkar, C. R., Arora, H., Halder, D. & Pinjari, D. V. Biodegradation of Reactive Blue 19 with simultaneous electricity generation by the newly isolated electrogenic klebsiella sp. C NCIM 5546 bacteriam in a microbial fuel cell. Int. Biodeterior. Biodegrad. 133, 194–201. https://doi.org/10.1016/j.ibiod.2018.07.011 (2018).
Patel, H. & Vashi, R. T. Treatment of textile wastewater by adsorption and coagulation. E J Chem. 7(4), 1468–1476. https://doi.org/10.1155/2010/987620 (2010).
Ahmed, D. A., El-Apasery, M. A., Aly, A. A. & Ragai, S. M. Green synthesis of the effectively environmentally safe Metakaolin-based geopolymer for the removal of hazardous industrial wastes using two different methods. Polymers 15(13), 2865. https://doi.org/10.3390/polym15132865 (2023).
Vidhya, T. A., Gayathri, K. V. & Kathawala, T. M. Treatment of mixed azo dyes in an aerobic sequential batch reactor and toxicity assessment using vigna radiata. Bio Rxiv 2, 680249. https://doi.org/10.1101/680249 (2019).
Gadore, V. & Ahmaruzzaman, Md. Fly ash–based nanocomposites: A potential material for effective photocatalytic degradation/elimination of emerging organic pollutants from aqueous stream. Environ. Sci. Pollut. Res. 28(34), 46910–46933. https://doi.org/10.1007/s11356-021-15251-0 (2021).
Rogozea, E. A. et al. Tandem adsorption-photodegradation activity induced by light on NIO–ZnO p–N couple modified silica nanomaterials. Mater. Sci. Semicond. Process. 57, 1–11. https://doi.org/10.1016/j.mssp.2016.10.006 (2017).
Olteanu, N. L. et al. One-pot synthesis of au–ZnO–SiO2 nanostructures for sunlight photodegradation. J. Mol. Catal A Chem. 414, 148–159. https://doi.org/10.1016/j.molcata.2016.01.007 (2016).
Rogozea, E. A. et al. Extension of optical properties of ZnO/SiO2 materials induced by incorporation of Au or NiO nanoparticles. Opt. Mater. 56, 45–48. https://doi.org/10.1016/j.optmat.2015.12.020 (2016).
Visa, M., Cosnita, M., Moldovan, M., Marin, C. A. & Mihaly, M. Fly Ash waste recycling by PT/TiO2 incorporation for industrial dye removal. Int. J. Environ. Res. Public Health 18(8), 3887. https://doi.org/10.3390/ijerph18083887 (2021).
Sun, P. et al. Photocatalyst of organic pollutants decomposition: TiO2/glass fiber cloth composites. Catal. Today 274, 2–7. https://doi.org/10.1016/j.cattod.2016.04.036 (2016).
Kumar, K. Y. et al. Controllable synthesis of TiO2 chemically bonded graphene for photocatalytic hydrogen evolution and Dye degradation. Catalysis Today 340, 170–177. https://doi.org/10.1016/j.cattod.2018.10.042 (2020).
Cazan, C., Enesca, A., Isac, L., Andronic, L. & Cosnita, M. Accelerated aging of polymeric composites based on waste with TiO2 fillers. ACS Appl. Polym. Mater. 5(6), 3958–3970. https://doi.org/10.1021/acsapm.3c00129 (2023).
Purbasari, A., Ariyanti, D., Sumardiono, S., Shofa, M. & Manullang, R. Comparison of alkali modified fly ash and alkali activated fly ash as zn(ii) ions adsorbent from aqueous solution. Sci. Sinter. 54(1), 49–58. https://doi.org/10.2298/sos2201049p (2022).
Visa, M., Pricop, F. & Duta, A. Sustainable treatment of wastewaters resulted in textile dyeing industry. J. Clean Techn. Environ. Policy. 13, 855–861 (2012).
Zheng, K., Chen, L. & Gbozee, M. Thermal stability of geopolymers used as supporting materials for TiO2 film coating through sol-gel process: Feasibility and improvement. Constr. Build. Mater. 125, 1114–1126. https://doi.org/10.1016/j.conbuildmat.2016.09.007 (2016).
Singh, N. Fly ash-based geopolymer binder: A future construction material. Minerals 8(7), 299. https://doi.org/10.3390/min8070299 (2018).
El Alouani, M. et al. Application of geopolymers for treatment of water contaminated with organic and inorganic pollutants: State-of-the-art review. J. Environ. Chem. Eng. 9(2), 105095. https://doi.org/10.1016/j.jece.2021.105095 (2021).
Fallah, M., MacKenzie, K. J. D., Hanna, J. V. & Page, S. J. Novel photoactive inorganic polymer composites of inorganic polymers with copper(I) oxide nanoparticles. J. Mater. Sci. 50, 7374–7383. https://doi.org/10.1007/s10853-015-9295-3 (2015).
Hertel, T., Novais, R. M. & Murillo, R. Use of modified bauxite residue-based porous journal pre-proof 34 inorganic polymer monoliths as adsorbents of methylene blue. J. Clean. Prod. 227, 877–889. https://doi.org/10.1016/j.jclepro.2019.04.084 (2019).
Falah, M., MacKenzie, K. J. D., Knibbe, R., Page, S. J. & Hanna, J. V. New composites of nanoparticle Cu (I) oxide and titania in a novel inorganic polymer (geopolymer) matrix for destruction of dyes and hazardous organic pollutants. J. Hazard. Mater. 318, 772–782. https://doi.org/10.1016/j.jhazmat.2016.06.016 (2016).
Zhang, Y. J., He, P. Y., Zhang, Y. X. & Chen, H. A novel electroconductive graphene fly ash-based geopolymer composite and its photocatalytic performance. Chem. Eng. J. 334, 2459–2466. https://doi.org/10.1016/j.cej.2017.11.171 (2018).
Jafari, H. & Afshar, S. Improved photodegradation of organic contaminants using nano-TiO2 and TiO2 – SiO2 deposited on portland cement concrete blocks. Photochem. Photobiol. 92, 87–101. https://doi.org/10.1111/php.12554 (2016).
Lu, Z., Wang, Q., Yin, R., Chen, B. & Li, Z. A novel TiO2/foam cement composite with enhanced photodegradation of methyl blue. Constr. Build. Mater. 129, 159–162. https://doi.org/10.1016/j.conbuildmat.2016.10.105 (2016).
Janus, M. et al. Self cleaning properties of cement plates loaded with N, C-modified TiO2 photocatalysts. Appl. Surf. Sci. 330, 200–206. https://doi.org/10.1016/j.apsusc.2014.12.113 (2015).
Kaya-Özkiper, K., Uzun, A. & Soyer-Uzun, S. Red mud- and Metakaolin-based geopolymers for adsorption and photocatalytic degradation of methylene blue: Towards self-cleaning construction materials. J. Clean. Prod. 288, 125120. https://doi.org/10.1016/j.jclepro.2020.125120 (2021).
Ružek, V., Novosád, J. & Buczkowska, K. E. Geopolymer antimicrobial and hydrophobic modifications: A review. Ceramics 6, 1749–1764. https://doi.org/10.3390/ceramics6030107 (2023).
Al-Etaibi, A. M. & El-Apasery, M. A. Nano TiO2 imparting multifunctional performance on dyed polyester fabrics with some disperse dyes using high temperature dyeing as an environmentally benign method. Int. J. Environ. Res. Public Health 17, 1377 (2020).
Selim, F., Ahmed, D. A. & Kishar, E. A. Effect of alkali concentration on physico-chemical and mechanical properties of slag based geopolymer cement. J. Sci. Res. Sci. 38(1), 210–232 (2021).
Chen, X., Meawad, A. & Struble, L. J. Method to stop geopolymer reaction. J. Am. Ceram. Soc. 97(10), 13071. https://doi.org/10.1111/jace.13071 (2014).
El-apasery, M. A. & Ahmed, D. A. A sustainable approach for immobilization dyeing bath effluents of reactive yellow 145 by using different types of eco-friendly geopolymer cement. Egypt. J. Chem. 66(3), 169–177. https://doi.org/10.21608/EJCHEM.2022.157273.6818 (2023).
Ahmed, D. A., El-Apasery, M. A. & Ragai, S. M. Immobilization approach as a creative strategy to remove reactive dye red 195 and Cu2+ ions from wastewater using environmentally benign geopolymer cement. Polymers 15(7), 1797. https://doi.org/10.3390/polym15071797 (2023).
Elapasery, M. A., Ahmed, D. A. & Aly, A. A. Decolorization of reactive dyes, part II: Eco-friendly approach of reactive dye effluents decolorization using geopolymer cement based on slag. Egypt. J. Chem. 65(11), 49–54. https://doi.org/10.21608/EJCHEM.2022.146015.6355 (2022).
Elapasery, M. A., Ahmed, D. A. & Aly, A. A. Decolorization of reactive dyes, part V: Eco-friendly approach of reactive red 195 dye effluents decolorization using geopolymer cement based on metakaolin. Egypt. J. Chem. 65(12), 129–135. https://doi.org/10.21608/EJCHEM.2022.149781.6473 (2022).
Ahmed, S. M., Aly, A. A., El-Apasery, M. A. & Ragai, S. M. Decolorization of reactive dyes, part VI: Eco-friendly approach of reactive dye effluents decolorization using geopolymer cement based on metakaolin backed by slag. Egypt. J. Chem. 65, 683–688 (2022).
Hashem, A., Okeil, A., Fikry, M., Aly, A. & Aniagor, C. O. Isotherm and kinetics parametric studies for aqueous Hg(II) uptake onto N-[2-(Methylamino)Ethyl]Ethane-1,2-diaminated acrylic fiber. Arab. J. Sci. Eng. 46(7), 6703–6714 (2021).
Aly, A. A., Mahmoud, S. A. & El-Apasery, M. A. Decolorization of reactive dyes, Part I: eco-friendly approach of reactive dye effluents decolorization using cationized sugarcane bagasse. Pigment Resin Technol. 47(2), 108–115 (2018).
Abdulhady, Y. M. A., El-Shazly, M. M. & El-Kased, R. F. Evaluation of antibacterial activity and toxic metal removal of chemically synthesized magnetic iron oxide titanium coated nanoparticles and application in bacterial treatment. J. Environ. Sci. Health Part A 53(3), 205–212. https://doi.org/10.1080/10934529.2017.1387012 (2018).
Abdelmoteleb, K. M. A., El-Apasery, M. A., Wasfy, A. A. F. & Ahmed, S. M. Synthesis of new monoazo disperse dyes for dyeing polyester fabric using two different dyeing methods: Demonstration of their antibacterial and anticancer activities. Polymers 15, 3052. https://doi.org/10.3390/polym15143052 (2023).
Koneman, E. W., Allen, S. D., Janda, W. M., Schreckenberger, P. C. & Winn, W. C. Diagnostic microbiology. In Lippincott (ed. Koneman, E. W.) 803–841 (1997).
Nabil, N., Ahmed, D. A. & Kishar, E. A. Effect of elevated temperatures on the performance of metakaolin geopolymer pastes incorporated by cement kiln dust. Egypt. J. Chem. 64(4), 1911–1926 (2021).
Samuvel, R. R. et al. Nanomaterials in geopolymer composites: A review. Dev. Built Environ. 13, 100114 (2023).
Zidi, Z., Ltifi, M., Ben, Z., Ayadi, L. E. & Nóvoa, X. R. Effect of nano-ZnO on mechanical and thermal properties of geopolymer. J. Asian Ceram. Soc. 8(1), 1–9. https://doi.org/10.1080/21870764.2019.1693682 (2020).
Jagadesh, P., Nagarajan, V., Karthik Prabhu, T. & Arunachalam, K. Effect of nano titanium di oxide on mechanical properties of fly ash and ground granulated blast furnace slag based geopolymer concrete. J. Build. Eng. 61, 105235 (2022).
Gopala Krishna Sastry, K. V. S., Sahitya, P. & Ravitheja, A. Influence of nano TiO2 on strength and durability properties of geopolymer concrete. Mater. Today Proc. 45(2), 1017–1025. https://doi.org/10.1016/j.matpr.2020.03.139 (2021).
Duan, P., Yan, C., Luo, W. & Zhou, W. Effects of adding nano-TiO2 on compressive strength, drying shrinkage, carbonation and microstructure of fluidized bed fly ash based geopolymer paste. Constr. Build. Mater. 106, 115–125 (2016).
Yang, L. Y., Jia, Z. J., Zhang, Y. M. & Dai, J. G. Effects of nano-TiO2 on strength, shrinkage and microstructure of alkali activated slag pastes. Cem. Concr. Compos. 57, 1–7. https://doi.org/10.1016/j.cemconcomp.2014.11.009 (2015).
Khater, H. Effect of cement kiln dust on geopolymer composition and its resistance to sulfate attack. Green Mater. 1(1), 36–46 (2013).
Khatib, K., Lahmyed, L. & El Azhari, M. Synthesis, characterization, and application of geopolymer/TiO2 nanoparticles composite for efficient removal of Cu(II) and Cd(II) ions from aqueous media. Minerals 12, 1445. https://doi.org/10.3390/min12111445r (2022).
Syamsidar, D. & Nurfadilla, S. The properties of nano TiO2-geopolymer composite as a material for functional surface application. MATEC Web Conf. 97, 1459652. https://doi.org/10.1051/matecconf/20179701013 (2017).
Sahitya, P. Sastry. KVSGK Influence of nano TiO2 on geopolymer concrete. Int. J. Emerg. Technol. Innov. Res. 5, 760–763 (2018).
Gutiérrez, R. M., Villaquirán-Caicedo, M., Ramírez-Benavides, S., Astudillo, M. & Mejía, D. Evaluation of the antibacterial activity of a geopolymer mortar based on metakaolin supplemented with TiO2 and CuO particles using glasswaste as fine aggregate. Coatings 10, 157 (2020).
Jaramillo-Fierro, X., Gaona, S., Ramón, J. & Valarezo, E. Porous geopolymer/ZnTiO3/TiO2 composite for adsorption and photocatalytic degradation of methylene blue dye. Polymers 15(12), 2697. https://doi.org/10.3390/polym15122697 (2023).
Falah, M. & MacKenzie, K. J. D. Photocatalytic nanocomposite materials based on inorganic polymers (Geopolymers): A review. Catalysts 66(10), 1158. https://doi.org/10.3390/catal10101158 (2020).
Kumar, A. & Pandey, G. A review on the factors affecting the photocatalytic degradation of hazardous materials. Mater. Sci. Eng. Int. J. 1(3), 106–114 (2017).
Acknowledgements
The authors would like to thank the central laboratories of Ain Shams University and the Desert Research Center, Cairo, Egypt for their assistance in providing the results of the chemical analysis for this work.
Funding
Open access funding provided by The Science, Technology & Innovation Funding Authority (STDF) in cooperation with The Egyptian Knowledge Bank (EKB).
Author information
Authors and Affiliations
Contributions
D.A.A.; M.A.E-A.; and S.M.R. wrote the main manuscript text. D.A.A. and M.A.E-A. prepared figures. All authors have read and agreed to the published version of the manuscript.
Corresponding author
Ethics declarations
Competing interests
The authors declare no competing interests.
Additional information
Publisher's note
Springer Nature remains neutral with regard to jurisdictional claims in published maps and institutional affiliations.
Rights and permissions
Open Access This article is licensed under a Creative Commons Attribution 4.0 International License, which permits use, sharing, adaptation, distribution and reproduction in any medium or format, as long as you give appropriate credit to the original author(s) and the source, provide a link to the Creative Commons licence, and indicate if changes were made. The images or other third party material in this article are included in the article's Creative Commons licence, unless indicated otherwise in a credit line to the material. If material is not included in the article's Creative Commons licence and your intended use is not permitted by statutory regulation or exceeds the permitted use, you will need to obtain permission directly from the copyright holder. To view a copy of this licence, visit http://creativecommons.org/licenses/by/4.0/.
About this article

Cite this article
Ahmed, D.A., El-Apasery, M.A. & Ragai, S.M. Development of an antimicrobial inorganic polymer based on fly ash and metakaolin incorporated by nano-TiO2 for reactive dye removal. Sci Rep 13, 19889 (2023). https://doi.org/10.1038/s41598-023-47032-9
Received:
Accepted:
Published:
Version of record:
DOI: https://doi.org/10.1038/s41598-023-47032-9
This article is cited by
-
Sustainable construction: development of self-cleaning geopolymer composite with fly ash, and bentonite incorporated with nano-ZnO
Sustainable Environment Research (2025)
-
Development of moringa seed powder-modified slag geopolymers for enhanced mechanical properties and effective dye removal
Scientific Reports (2025)
-
Heterogeneous TiO2 photocatalysis coupled with membrane technology for persistent contaminant degradation: a critical review
Applied Water Science (2025)
-
Harnessing Fly Ash for Water Purification: Advances in Sustainable Waste Management and Environmental Protection
Water, Air, & Soil Pollution (2025)
-
Review: Foam geopolymer synthesis macro- to micro-properties
Journal of Materials Science (2025)
