
Figure 1
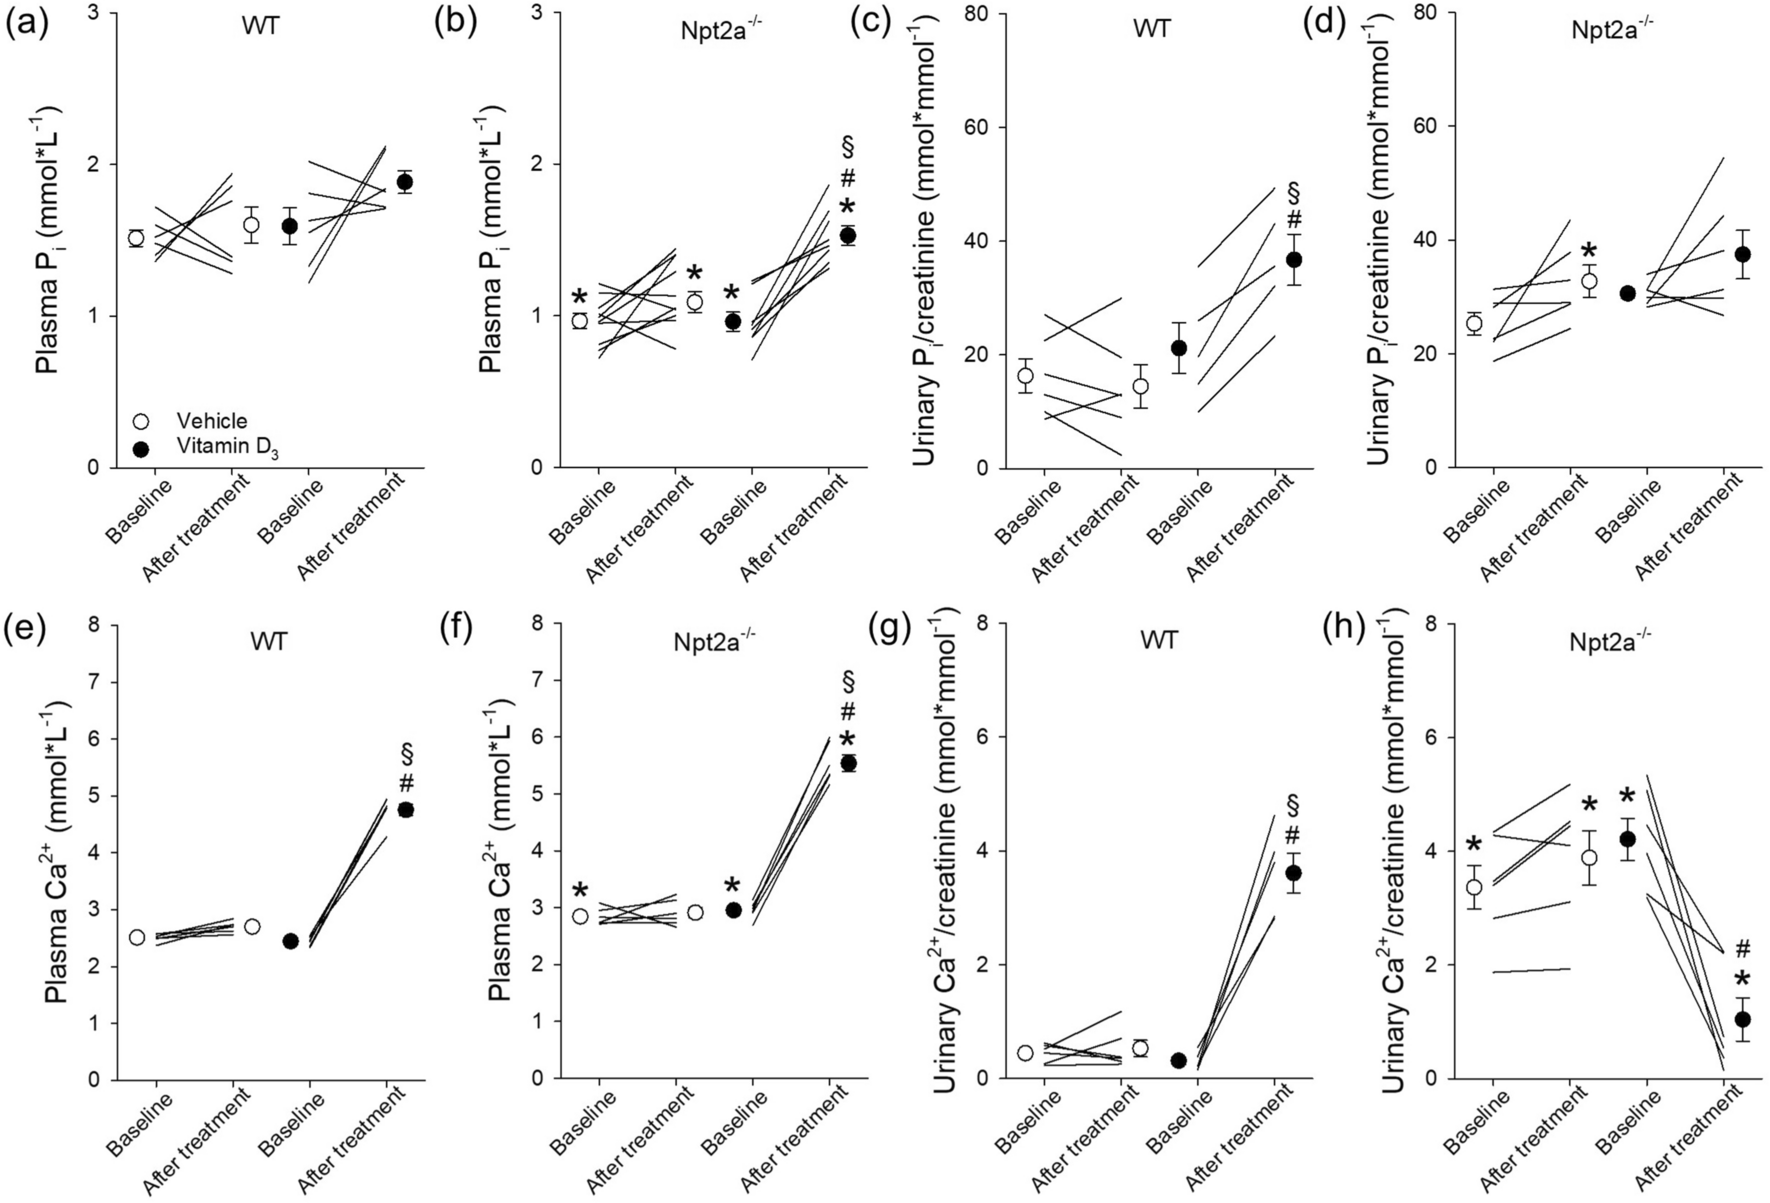
Lack of Npt2a unravels a link of vitamin D3 on plasma Pi. Measurements of plasma and urinary Pi and Ca2+ were conducted in WT and Npt2a−/− mice after 4 days of treatment with either a vehicle or vitamin D3 (n = 6–10 per genotype). (a) In WT mice, plasma Pi levels remained unchanged following vitamin D3 treatment. (B) In contrast, lower plasma Pi levels under baseline conditions in Npt2a−/− mice significantly increased in response to vitamin D3 treatment. (c) The urinary Pi/creatinine ratio in WT mice increased significantly in response to vitamin D3 treatment. (d) This ratio in Npt2a−/− mice was unchanged (d). Plasma Ca2+ levels in both WT and Npt2a−/− mice showed a significant increase following vitamin D3 treatment (e & f). In WT mice, the urinary Ca2+ to creatinine ratio significantly increased after vitamin D3 treatment (g). In contrast, this ratio significantly decreased in Npt2a−/− mice (h). Male mice were used in these studies. In addition to single data summary data are shown and are expressed as mean ± SEM and were analyzed by repeated-measures two-way ANOVA followed by Tukey’s multiple comparisons test. *P < 0.05 vs WT same time point, #P < 0.05 vs baseline same genotype, §P < 0.05 vs vehicle same genotype and time point.
