
Figure 5
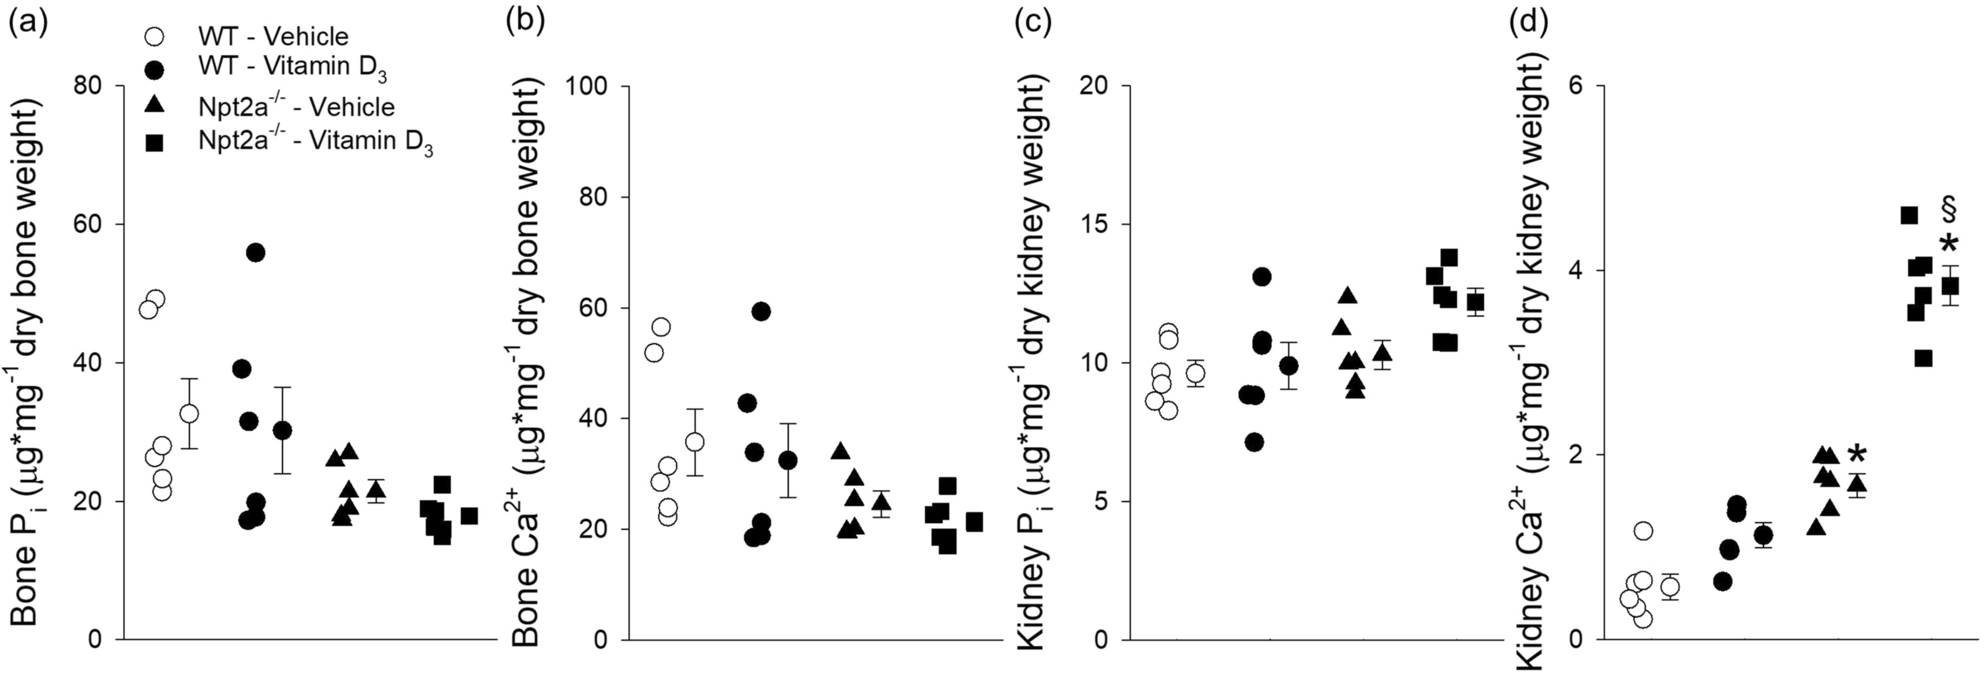
Vitamin D3 treatment increases kidney Ca2+ levels in Npt2a−/− mice. Measurements of Pi and Ca2+ levels were carried out in bone and kidney tissues of WT and Npt2a−/− mice following 4 days of treatment with either a vehicle or vitamin D3 (n = 6 per genotype). (a & b) There was no difference in the levels of Pi and Ca2+ in bone of either genotype in response to vehicle or vitamin D3 treatment. (c) Kidney Pi levels were not significantly different between genotypes or treatment. (d) The kidney Ca2+ levels were significantly greater in response to vehicle treatment in Npt2a−/− compared to WT mice. Vitamin D3 treatment was not associated with altered kidney Ca2+ levels in WT mice; however, resulted in the highest kidney Ca2+ levels in Npt2a−/− mice. Male mice were used in these studies. In addition to single data summary data are shown and are expressed as mean ± SEM and were analyzed by two-way ANOVA followed by Tukey’s multiple comparisons test. *P < 0.05 vs WT same treatment, §P < 0.05 vs vehicle same genotype.
