
Figure 7
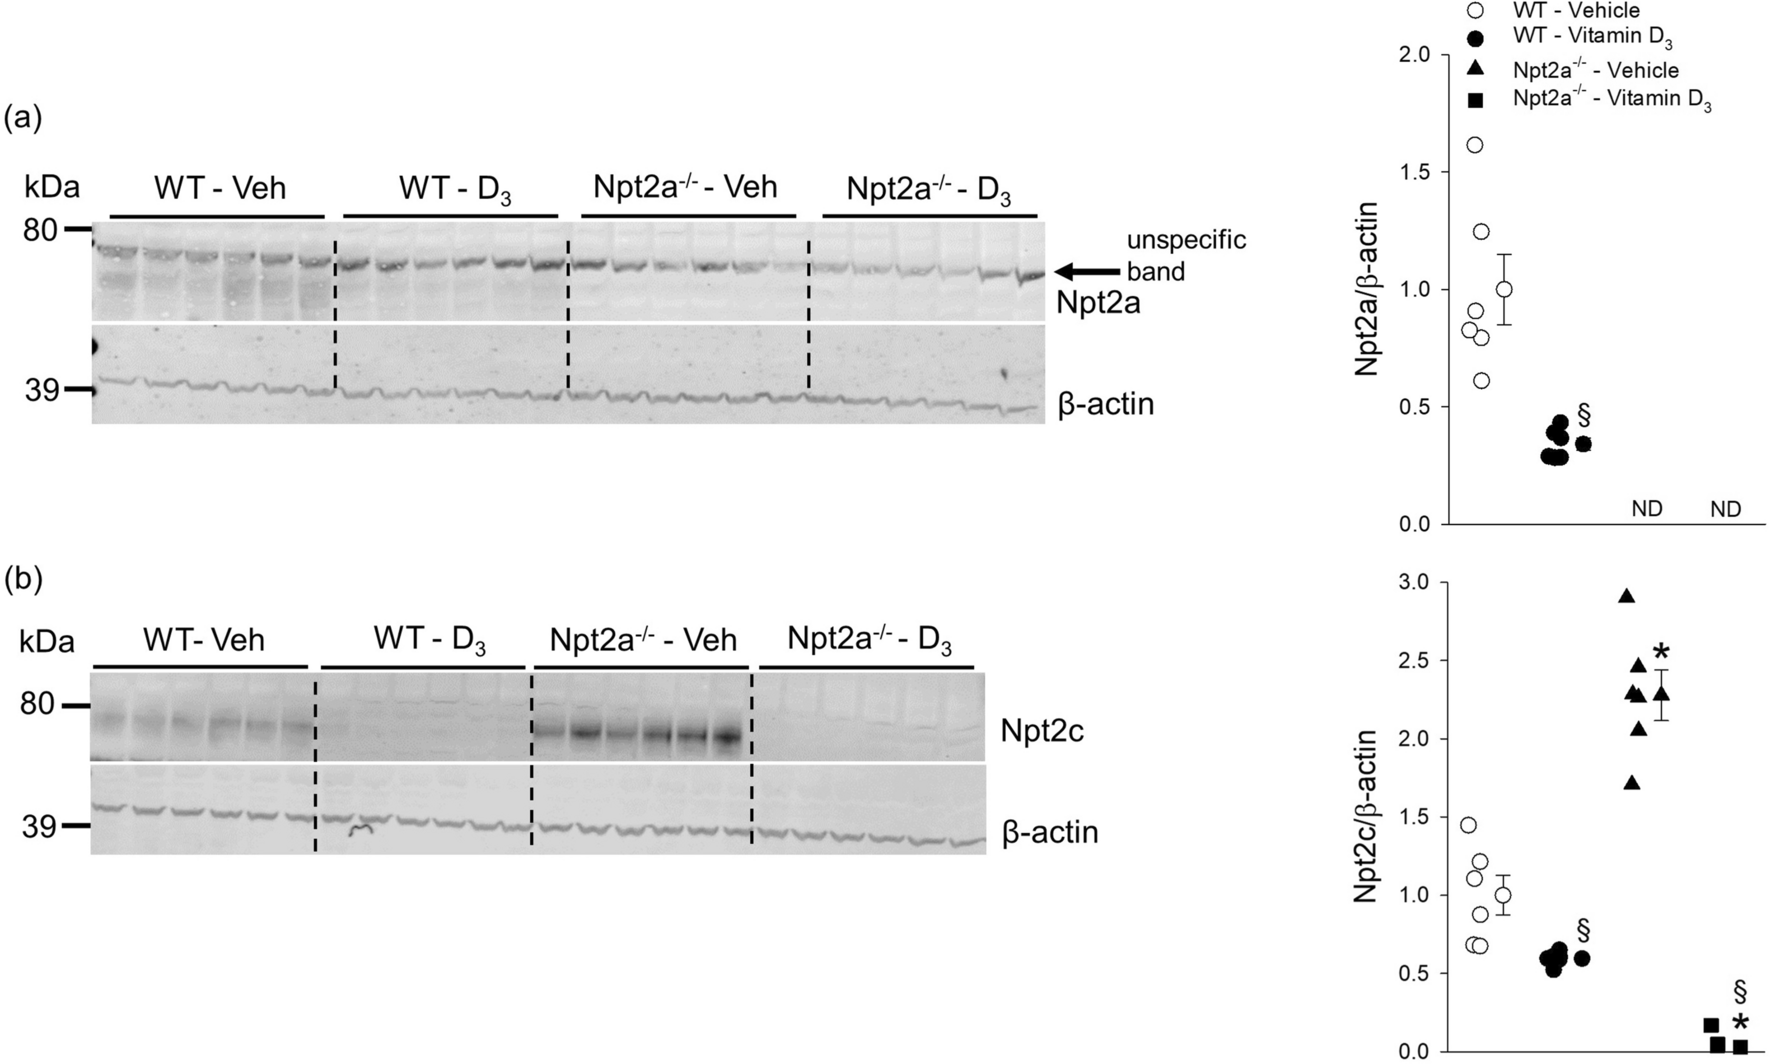
Npt2c abundance is diminished in Npt2a−/− mice in response to vitamin D3 treatment. Abundance of Npt2a and Npt2c in kidney tissues of WT and Npt2a−/− mice after 4 days of treatment with vehicle or vitamin D3 (n = 4–6 per genotype). (a) In this study we confirmed the specificity of the Npt2a antibody in Npt2a−/− mice, which lack the ~ 75–80 kDa band representing Npt2a. An unspecific band was detected. In WT mice, vitamin D3 treatment showed lower Npt2a expression compared to vehicle treatment. (b) In response to vehicle treatment, Npt2c abundance was significantly greater in Npt2a−/− compared to WT mice. Npt2c abundance was significantly lower in vitamin D3-treated mice; however, the level in Npt2a−/− mice was almost undetectable. Male mice were used in these studies. In addition to single data summary data are shown and are expressed as mean ± SEM and were analyzed by two-way ANOVA followed by Tukey’s multiple comparisons test. *P < 0.05 vs WT same treatment, §P < 0.05 vs vehicle same genotype.
