
Figure 8
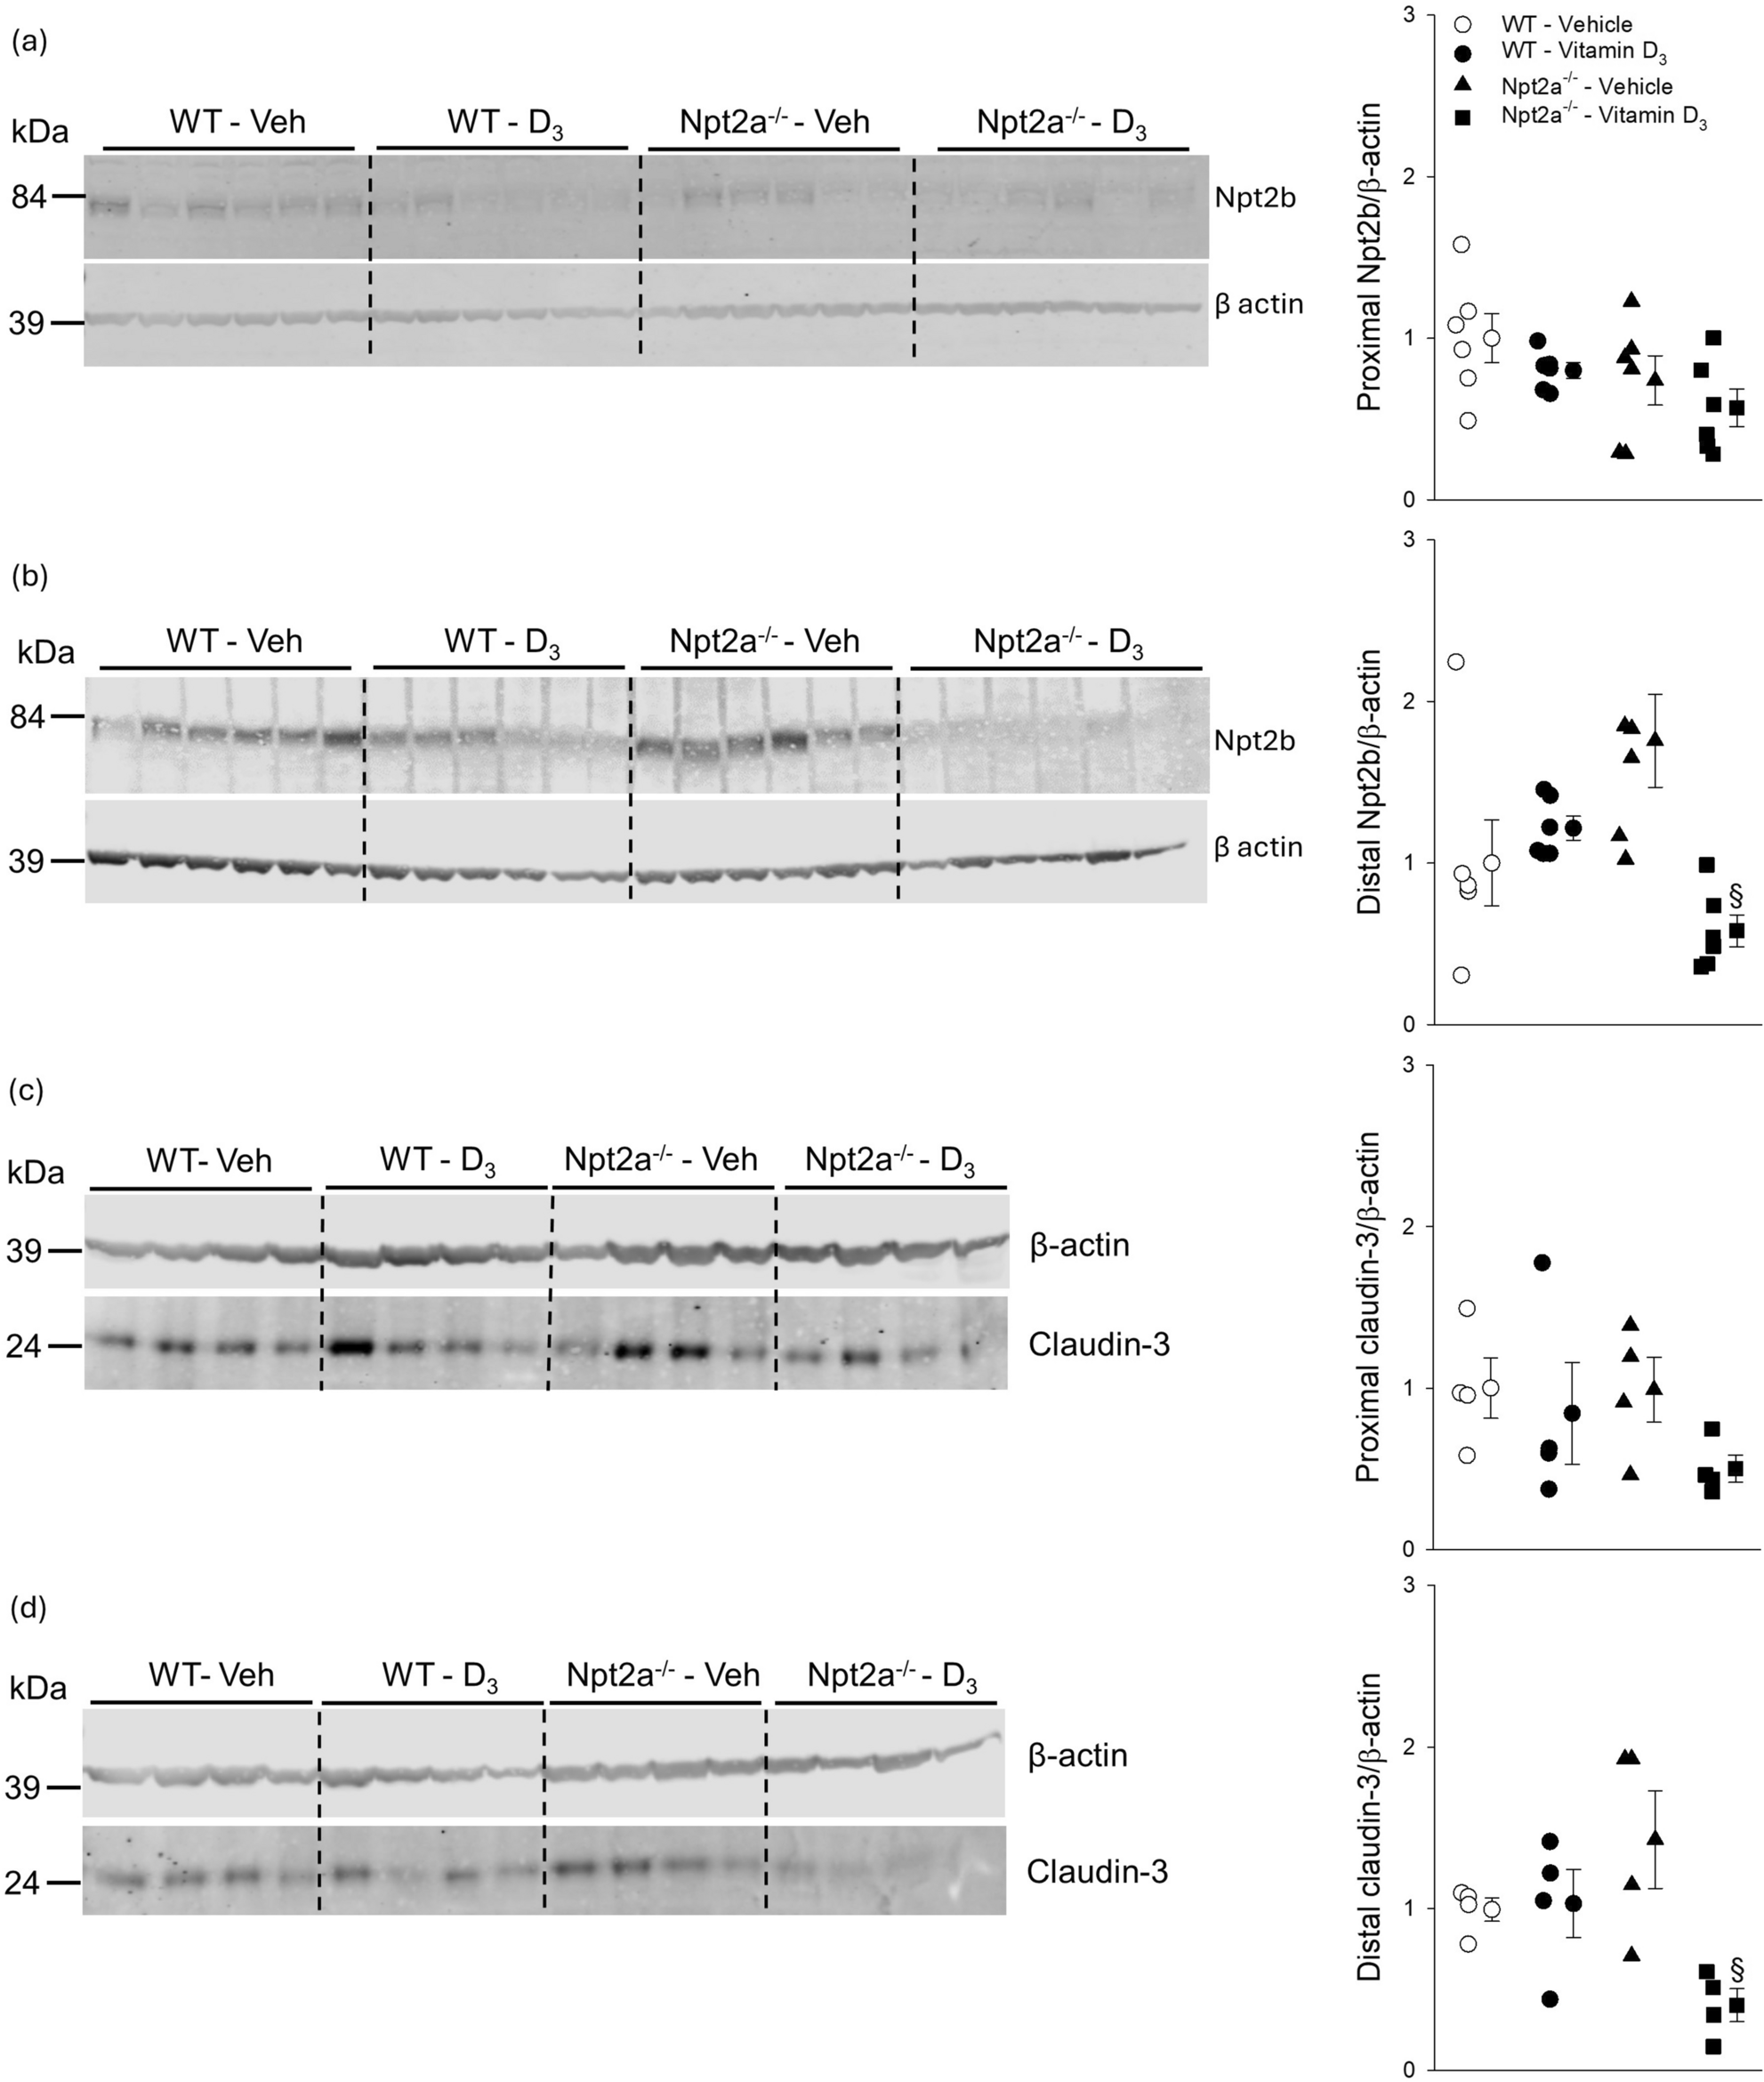
Npt2b abundance is diminished in Npt2a−/− mice in response to vitamin D3 treatment. (a) Abundance of Npt2b in the proximal small intestine was not different between genotypes or treatment. (b) In the distal small intestine, no differences were detected in Npt2b abundance between vehicle-treated genotypes. In WT mice, Npt2b abundance was similar in response to vitamin D3 compared to vehicle treatment. Of note, Npt2b abundance in vitamin D3 -treated Npt2a−/− mice was lower compared to vehicle treatment. (c) Abundance of claudin-3 was somewhat variable in the proximal small intestine and no differences were observed between genotype or treatment. (d) In the distal small intestine, no differences in claudin-3 abundance were detected between vehicle-treated genotypes. In WT mice, claudin-3 abundance was similar in response to vitamin D3 compared to vehicle treatment. Of note, claudin-3 abundance in vitamin D3-treated Npt2a−/− mice was lower compared to vehicle treatment. Male mice were used in these studies. In addition to single data summary data are shown and are expressed as mean ± SEM and were analyzed by two-way ANOVA followed by Tukey’s multiple comparisons test. §P < 0.05 vs vehicle same genotype.
