
Abstract
Assessing myocardial viability is crucial for managing ischemic heart disease. While late gadolinium enhancement (LGE) cardiovascular magnetic resonance (CMR) is the gold standard for viability evaluation, it has limitations, including contraindications in patients with renal dysfunction and lengthy scan times. This study investigates the potential of non-contrast CMR techniques—feature tracking strain analysis and T1/T2 mapping—combined with machine learning (ML) models, as an alternative to LGE-CMR for myocardial viability assessment. A retrospective analysis was conducted on 79 patients with myocardial infarction (MI) 2–4 weeks post-event. Patients with prior ischemia or poor imaging quality were excluded to ensure robust data acquisition. Various ML algorithms were applied to data from LGE-CMR and non-contrast CMR techniques. Random forest (RF) demonstrated the highest predictive accuracy, with area under the curve (AUC) values of 0.89, 0.90, and 0.92 for left anterior descending (LAD), right coronary artery (RCA), and left circumflex (LCX) coronary artery territories, respectively. For the LAD territory, RF, k-nearest neighbors (KNN), and logistic regression were the top performers, while RCA showed the best results from RF, neural networks (NN), and KNN. In the LCX territory, RF, NN, and logistic regression were most effective. The integration of T1/T2 mapping and strain analysis significantly enhanced myocardial viability prediction, positioning these non-contrast techniques as promising alternatives to LGE-CMR. ML models, particularly RF, provided superior diagnostic accuracy across coronary territories. Future studies should validate these findings across diverse populations and clinical settings.
Introduction
Ischemic heart disease (IHD) remains a leading cause of global morbidity and mortality, necessitating accurate diagnostic and prognostic tools for optimal patient management1,2. Cardiovascular magnetic resonance (CMR) imaging, particularly through late gadolinium enhancement (LGE), has established itself as the gold standard for assessing myocardial viability and fibrosis. LGE enables precise discrimination between ischemic and non-ischemic etiologies, providing crucial information for clinical decision-making regarding revascularization strategies and risk stratification3,4,5. However, this technique presents notable limitations, including contraindications in patients with kidney disease or contrast allergies, extended scan times due to the required 10–15-minute delay for contrast retention, and inability to provide comprehensive functional insights2,5.
The growing need for alternative diagnostic approaches has sparked interest in contrast-free techniques that could potentially reduce scan times, decrease costs, and improve CMR accessibility. Novel methods such as feature tracking (FT) strain analysis and T1/T2 mapping have emerged as promising gadolinium-free approaches for cardiac phenotyping2,6,7. While preliminary studies have demonstrated encouraging results, with research by Tantawy et al. showing the capability of FT-CMR to differentiate between viable and non-viable segments6 and Dastidar et al. highlighting the potential of native T1 mapping for viability assessment7, most investigations have been limited by isolated parameter analysis or small sample sizes.
The rapid advancement of artificial intelligence (AI) in cardiovascular imaging has opened new avenues for improving diagnostic accuracy and efficiency5. AI-based approaches have demonstrated significant utility across various CMR applications, including automated image acquisition, reconstruction, and analysis, while providing valuable diagnostic and prognostic information8. Recent developments in non-contrast CMR examinations supported by AI models have shown promising results in detecting myocardial infarction2,9,10,11. However, the application and validation of these approaches in comprehensive myocardial viability assessment across different segments and coronary artery territories remain largely unexplored.
This study aims to evaluate the combined efficacy of FT strain analysis and T1/T2 mapping integrated with machine learning (ML) pattern recognition techniques for predicting myocardial viability. By conducting a systematic comparison between these non-contrast methods and the established LGE technique, we seek to determine their relative diagnostic accuracy and potential advantages in clinical practice. This investigation represents a crucial step toward developing more accessible, efficient, and comprehensive approaches to myocardial viability assessment, potentially transforming the current paradigm of cardiac imaging diagnostics.
Method and materials
Study design
This study was conducted as a retrospective analysis of patients with myocardial infarction (MI) who underwent viability studies using LGE CMR two to four weeks post-MI. The primary aim was to assess the efficacy of FT strain analysis and T1/T2 mapping, in conjunction with ML, for predicting myocardial viability compared to LGE. A summary of the study method is demonstrated in Fig. 1.

Graphical Abstract. Overview of the study methodology.
Study population
This retrospective study included patients with ST-segment elevation MI who underwent LGE CMR for viability assessment within the subsequent two to four weeks, from January 2020 to December 2021. The research was conducted in accordance with the Declaration of Helsinki and received approval from the Ethics Committee at the Rajaie Cardiovascular Medical and Research Center. The requirement of informed consent was waived by the Institutional Ethics Committee because it was a retrospective study. All methods were performed in accordance with the relevant guidelines and regulations. The study population was selected from a database of MI patients, ensuring a comprehensive collection of clinical and imaging data for robust analysis.
Inclusion and exclusion criteria
The inclusion criteria comprised patients aged 18 years or older with a diagnosis of ST-segment elevation MI confirmed by clinical, biochemical, and electrocardiographic criteria who completed an LGE CMR viability study two to four weeks post-MI.
Exclusion criteria included patients with contraindications to CMR, such as implanted metallic devices, incomplete or poor-quality imaging data, previous history of coronary artery bypass grafting (CABG) or other significant cardiac surgeries before the index MI and severe comorbidities that could impact survival or imaging outcomes. Patients were also excluded if they had undergone other forms of viability assessment, such as positron emission tomography (PET), to avoid confounding results.
CMR imaging acquisition
CMR acquisition using the Sola MRI, a 1.5 Tesla XA20 with a 32-channel setup, involves a detailed protocol to ensure high-quality imaging, particularly for LGE. Initially, contrast is administered with a gadolinium-based agent at a dose ranging from 0.1 to 0.2 mmol/kg. Imaging begins in multiple planes, including four-chamber, two-chamber, and short-axis (SA) views. The field of view (FOV) is set to 300 mm, with a slice thickness of 6 mm across six slices. Following contrast administration, initial images are captured within 1 to 3 min to assess early contrast distribution with an inversion time (TI) greater than 400 ms. Subsequently, LGE images are acquired more than 10 min post-contrast to highlight areas of myocardial fibrosis or scarring, ensuring optimal tissue characterization and diagnostic accuracy.
Data preprocessing by CVi42
After acquiring the CMR on the Sola MRI (1.5 Tesla XA20, 32-channel), the digital imaging and communications in medicine (DICOM) images are exported for further analysis. The images are imported into CVi42 (Circle Cardiovascular Imaging Inc, Calgary, Canada) for the assessment of global longitudinal strain (GLS), global circumferential strain (GCS), and global radial strain (GRS). These parameters can detect subtle abnormalities in cardiac mechanics. Additionally, CVi42 supports T1 and T2 mapping, which are vital for tissue characterization. T1 mapping enables the assessment of myocardial fibrosis and extracellular volume, while T2 mapping is used to detect edema and inflammation. These advanced analyses help diagnose various cardiac conditions and monitor disease progression or response to therapy. Images were excluded from the study if they were suboptimal or non-diagnostic due to artifacts or signal loss that impaired accurate interpretation by the observers.
T1 mapping
T1 mapping is a crucial parameter for myocardial tissue characterization in CMR imaging. It is a promising tool for detecting myocardial abnormalities without gadolinium-based contrast agents. The myocardial T1 relaxation time reflects changes in the intracellular and extracellular components of the myocardium. Various pathologies affect the T1 values, such as collagen deposition (myocardial fibrosis), water (edema and inflammation), lipids (Fabry disease), and iron (hemosiderosis). T1 maps are generated from a series of T1-weighted images, with each pixel representing a specific T1 value, allowing precise quantification of tissue characteristics. T1 mapping can be conducted using several acquisition methods, with the modified look-locker inversion recovery (MOLLI) sequence commonly used, as in our study. At least three SA images are acquired from the base to the apex of the heart. Dedicated CMR software is used for quantifying T1 map images, where contours can be drawn manually or using automated features. Native T1 values are obtained by manually drawing a region of interest (ROI) on specific myocardial areas or by presenting the data in an AHA segmentation format. Normal myocardial native T1 reference ranges acquired using the MOLLI method have been reported to be 930 ± 21 ms at 1.5 Tesla (Fig. 2).

Viability assessment in a 57-year-old man with LAD territory MI in STEMI. (A) Transmural LGE in base to midpart of the anteroseptal wall of LV. (B) Contouring of the LV wall for T1 and T2 evaluation. (C) High T1 values (T1 = 1043 ms) in the base to mid-segment of the anteroseptal LV wall due to septal fibrosis. (D) Polar map of T1-weighted LV wall showing an increased T1 value in the septal wall. (E) Polar map of T2-weighted LV wall showing normal T2 values in the septal wall (T2 = 48 ms).
T2 mapping
Similar to T1 values, T2 values represent a global signal from both intracellular and extracellular compartments. Each tissue type has a normal range of T2 values, and increased T2 values typically indicate elevated water content. Thus, myocardial edema (inflammation) is the main pathology resulting in increased T2 values. T2 mapping sequences are instrumental in detecting myocardial edema in patients with acute MI and myocarditis. Normal myocardial T2 values acquired using steady-state free precession (SSFP)-based sequences have been reported to be 52.18 ± 3.4 ms at 1.5 Tesla (Fig. 2).
Feature tracking for strain analysis
Myocardial strain measures the deformation of the myocardium between relaxed and contracted states12. In ischemic heart disease, strain outperforms known risk markers like left ventricular (LV) ejection fraction or infarct size in predicting major adverse cardiac events13.
Several CMR strain techniques are available, including Tagging, displacement encoding with stimulated echoes (DENSE), and strain encoding (SENC), which require dedicated sequences. However, the most commonly used technique is FT, which processes routinely acquired cine SSFP MR images13,14. FT post-processing involves defining the endocardial and epicardial borders on short- and long-axis cine images and delineating the ventricular long axis at end-systole and end-diastole13,15 This allows the measurement of circumferential, longitudinal, and radial strain parameters (GLS, GCS, GRS). These steps can be done rapidly using artificial intelligence (AI) features of post-processing software.
Strain values can be displayed for the entire heart (global), at the section level (basal, mid, apical), by AHA segments, or within a specific ROI. Polar maps can display strain metrics in all 17 segments, and color-coded strain data can be overlaid on cine SSFP images for enhanced visualization (Fig. 3).

A 57-year-old man with LAD territory MI. (A) Imaging depicting color-coded strain at mid-SAX. (B) Graph showing reduced circumferential strain in a specific ROI (mid-anteroseptal LV wall). (C) Polar map of circumferential strain values.
Statistical analysis
Excluding or imputing missing values
Prior to conducting the machine learning analysis, we evaluated T1 and T2 mapping alongside strain feature tracking to maintain optimal data quality. Patients were excluded from the analysis if more than one segment within a given territory contained missing values. For cases with a single missing value in T1, T2, longitudinal, radial, or circumferential strain, the missing value was imputed by averaging the values of adjacent segments within the same territory. This approach replaced missing data with the mean of available values from the corresponding group, as demonstrated below.
\(\:{\widehat{\text{x}}}_{\text{i}\text{j}}\): imputed value for the missing value, \(\:{\text{n}}_{\text{i}}\): the number of non-missing values in group i, \(\:{\text{x}}_{\text{i}\text{j}}\): the observed value in group i variable j, NA denotes missing values.
Normalization
Normalization using StandardScaler in Python involves transforming the features of a dataset so that they have a mean of 0 and a standard deviation of 1. This standardization ensures that each feature contributes equally to the analysis, which can improve the performance of many ML algorithms. The normalization formula applied is:
\(\:x\) represents the original feature value, µ is the mean of the feature, and σ is the standard deviation of the feature. This process adjusts the data to a common scale without distorting differences in the ranges of values, ensuring consistent and reliable analysis.
Synthetic minority over-sampling technique (SMOTE)
The synthetic minority over-sampling technique (SMOTE) is a technique for addressing class imbalance in datasets, particularly where one class predominates, potentially skewing classifier performance. SMOTE works by selecting a minority class instance, identifying its k-nearest minority class neighbors, and creating synthetic instances along the line segments connecting the instance and its neighbors. The formula for generating a synthetic instance is:
Here, Xi represents a minority class instance, Xj denotes one of its k-nearest neighbors (k = 5), and λ is a random number between 0 and 1.
In our study, SMOTE was applied to ensure the training dataset was balanced, thereby improving the classifier’s ability to handle imbalanced data effectively.
Data set splitting and ten-fold cross-validation
A 10-fold cross-validation approach was employed to ensure robust evaluation and prevent overfitting. This method involved dividing the dataset into ten subsets, using nine for training and one for testing in each iteration, ensuring that each subset was used for testing only once.
Machine learning algorithms
The following ML algorithms were implemented and compared: decision tree, gradient boosting, logistic regression, naive bayes, random forest (RF), support vector machine (SVM), K-Nearest Neighbors (KNN), and Neural Network (fully connected). Each algorithm was tuned using grid search to optimize hyperparameters and enhance performance.
Resources and requirements
For our machine learning tasks, we utilized an M2 MacBook Pro device powered by the Apple M2 chip, featuring an 8-core CPU and a 10-core GPU, with 16GB of unified memory, which efficiently handled data-intensive operations, ensuring smooth performance during model training and evaluation. It demonstrated stable and smooth performance for all machine learning tasks without any drops or interruptions.
Decision tree
Decision trees recursively partition the feature space into regions that minimize impurity, often measured by entropy for classification tasks.
Entropy Formula
H(T): Entropy of node T, p(i|T): Proportion of samples of class I in node T and c: number of classes (c = 2 in this study).
In this classifier, we used the criterion of Gini score and best splitter without class weight.
Gradient boosting
Gradient boosting combines weak learners sequentially to minimize a loss function, adjusting predictions with a learning rate of 0.001
\(\:{\widehat{y}}_{i}^{\left(t\right)}\): Prediction of the ensemble at iteration t.
\(\:{h}^{\left(t\right)}\left({x}_{i}\right)\): Weak learner (e.g., decision tree) prediction for sample for xi.
Logistic regression
Logistic regression models the probability of a binary outcome using a logistic function.
Logistic function
w: Coefficients (weights), x: input features, b: Bias term.
The default configuration of LogisticRegression utilized the lbfgs solver, which is well-suited for small to medium-sized datasets. It employed L2 regularization (penalty=’l2’) with a regularization strength of C = 1. The class_weight parameter was set to None, indicating that all classes were treated equally unless specified otherwise. The optimization process was capped at a maximum of 100 iterations (max_iter = 100) to identify the optimal solution.
Loss function (binary cross-entropy)
\(\:\mathbf{L}\left(\varvec{w},\varvec{b}\right)\): Binary cross-entropy loss, yi: Actual label of sample i, P(y = 1|x): Predicted probability of calss 1 for sample I, N: number of samples.
Random forest
RF constructs an ensemble of decision trees where each tree is built on a random subset of the features and a random subset of the data. In the random forest, the Gini score is used as the criterion to make the optimum efficiency of the classifier, which is demonstrated as follows:
c: The number of classes in the target variable. p: The proportion (or probability) of class i in the node.
Support vector machine (SVM) with linear kernel and probability
SVM finds a hyperplane that separates classes in the feature space, with the linear kernel indicating a linear decision boundary.
Decision function for linear SVM\(\:f\left(x\right)={w}^{T}x+b\)
w: weight vector, b: Bias term.
Probability estimation
In this experiment, we used a regularization parameter (c = 1.0), rbf kernel, and a decision function shape of ‘ovr’ (one-vs-rest) to optimize the classification process.
K-nearest neighbors (KNN)
KNN classifies samples based on the majority class among its k nearest neighbors in the feature space. In the present study, we considered the K = 5.
Decision Rule
\(\:\widehat{y}\): Predicted class for the new sample x, Nk(x) set of k nearest neighbors of x, I: indicator function.
Neural network
Neural networks (NN) consist of interconnected layers of neurons that learn representations of the data. In this study, the Multilayer Perceptron Classifier (MLPClassifier) was used with the following details:
Input to Hidden Layer Transformation
xi: The i-th input feature. wij: Weight connecting the i-th input to the j-th neuron. bj: Bias term for the j-th neuron. f : ReLU Activation function.
Hidden Layer to Output Layer Transformation
hj: Output of the j-th neuron in the hidden layer. wj: Weight connecting the j-th hidden neuron to the k-th output neuron. bk: Bias term for the k-th output neuron. g: Output activation function.
The predicted class is the one with the highest probability:
We set max_iter = 1000 to define the maximum number of iterations for the optimization algorithm to converge. Additionally, we configured the model with a hidden layer size of 100 (hidden_layer_sizes=(100)), used ‘relu’ as the activation function, selected the Adam solver for optimization, and applied a constant learning rate to regulate the training process.
Evaluation metrics
The performance of the ML was assessed using several evaluation metrics, including area under the curve (AUC), Precision, recall, accuracy, and F1 score. These metrics provided a comprehensive evaluation of the models’ predictive capabilities.
AUC measures the overall performance of the classification model by evaluating the area under the receiver operating characteristic (ROC) curve. Although AUC itself does not have a simple closed-form formula, it is computed as the area under the ROC curve, which plots the true positive rate (TPR) against the false positive rate (FPR) at various threshold settings.
Precision measures the proportion of true positives among the predicted positives, and is calculated using the formula:
Recall, also known as sensitivity or true positive rate, indicates the proportion of true positives among all actual positives. The formula for recall is:
Accuracy reflects the overall correctness of predictions and is calculated using the formula:
The F1 Score provides a balance between precision and recall by considering the harmonic mean of both metrics. The formula for the F1 score is:
These metrics together give a comprehensive picture of the models’ performance, with AUC assessing overall performance, precision measuring the accuracy of positive predictions, recall indicating the model’s ability to capture actual positives, Accuracy reflecting the correctness of predictions, and F1 Score balancing the trade-off between precision and recall.
Feature selection and ablation study
Feature importance was evaluated to identify the most influential parameters in predicting myocardial viability. Various techniques, such as permutation importance and SHapley Additive exPlanations (SHAP) values, were used to rank features. An ablation study was conducted to determine the impact of individual features on model performance. This involved systematically removing one feature at a time and observing changes in the evaluation metrics, thus highlighting the contribution of each feature to the model’s predictive accuracy.
Results
In this study, 90 patients were enrolled at the beginning, but 11 patients were excluded due to a history of previous ischemia or CABG, lack of imaging quality, inappropriate T1 and T2 mapping, and strain analysis. The remaining 79 patients underwent statistical and ML analysis. Among the enrolled patients, according to the LGE viability assessment, the left anterior descending artery (LAD) territory was viable in 52.8% of participants (47 individuals). The right coronary artery (RCA) territory was viable in 59.5% of participants (53 individuals). The left circumflex artery (LCX) territory was viable in 60.6% of participants (54 individuals). (Fig. 4; Table 1).
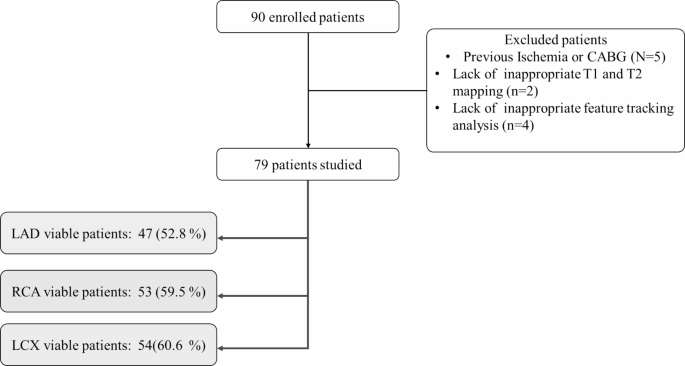
Flowchart depicting the enrolled study population and the distribution of viable territories.
Demographic characteristics of patients
The study involved participants with a mean age of 47.97 years with a standard deviation of 12.48 years. Among the participants, 83.5% (66 individuals) were male. Regarding medical conditions, 43.0% (34 individuals) had hypertension, 32.9% (26 individuals) had diabetes, and 26.5% (21 individuals) had hyperlipidemia. Additionally, 35.4% (28 individuals) were smokers.
For functional indexes, the mean value of left atrium area was 23.56 ± 11.97 cm2. The mean value of right atrium was 19.99 ± 18.31 cm2. The mean value of left ventricular ejection fraction (LVEF) was 28.13 ± 10.26. The mean value of end-diastolic volume index (EDVI) was 131.83 ± 62.43 ml/m2, while the mean value of end-systolic volume index (ESVI) was 98.95 ± 54.55. ml/m2. The mean value of left ventricular stroke volume (LVSV) was 58.91 ml ± 17.76.
Regarding the right ventricle, the mean value of right ventricular ejection fraction (RVEF) was 44.64 ± 12.02. The mean value of right ventricular end-diastolic volume index (RVEDVI) was 78.67 ml/m2 ± 38.27. The mean value of right ventricular end-systolic volume index (RVESVI) was 45.52 ml/m2 ± 31.30. Lastly, the mean value of right ventricular stroke volume (RVSV) was 54.73 ml ± 16.97. Table 2 summarizes the complete demographic and functional metrics.
Data adjusting
Analysis of individuals with non-viable versus viable territories in LAD, RCA, and LCX showed no significant differences in clinical factors (hypertension, diabetes, hyperlipidemia, smoking) or imaging parameters (atrial areas, ventricular functions, volumes). Only age in RCA territories approached significance (P = 0.05), with viable territories showing slightly higher mean age (Table 3). In LAD territory, non-viable segments showed reduced radial and circumferential strain with elevated T1 and T2 values. RCA territory demonstrated only higher T2 values in non-viable areas. LCX territory exhibited lower strain values and higher T1 and T2 values in non-viable segments (Table 4; Fig. 5).

Alteration of features in non-viable versus viable areas for each coronary territory. (A) LAD, (B) RCA, and (C) LCX.
Evolution metrics of various models in the prediction of viability in each territory
In the LAD territory, the RF model demonstrated the highest AUC (0.87) and strong overall performance with accuracy, balanced accuracy, and F1 score of 0.74. Logistic regression also performed well, achieving an AUC of 0.83, the highest accuracy (0.78), and balanced accuracy (0.77). While the KNN model had a relatively high AUC (0.82) and accuracy (0.75), its recall was lower (0.65), though it had high precision (0.84). The NN, SVM, gradient boosting, and decision tree models showed moderate performance with varying strengths, with NN and SVM models achieving balanced accuracy and F1 scores of around 0.70–0.74. Gradient boosting and decision tree had the lowest AUCs (0.73 and 0.72, respectively), with corresponding lower metrics in other categories.
For the RCA territory, the RF model performed the best, achieving the highest AUC of 0.90 and strong overall metrics, including an accuracy of 0.79 and an F1 score of 0.78. The NN model also performed well with an AUC of 0.84, the highest accuracy of 0.81, and a balanced accuracy of 0.81, although its recall was lower at 0.69. The KNN model showed a lower AUC of 0.80 and an accuracy of 0.70, with a particularly low recall of 0.54. Logistic regression and SVM had moderate performance with AUCs of 0.76 and 0.74, respectively, and balanced accuracy around 0.72–0.73. Gradient boosting and decision tree had the lowest AUCs of 0.74 and 0.72, respectively, with corresponding lower performance metrics in accuracy and F1 score.
For the LCX territory, both the RF and NN models achieved the highest AUC of 0.92. The NN model also had the highest accuracy (0.87), balanced accuracy (0.87), recall (0.83), precision (0.90), and F1 score (0.86). The RF model followed closely with an accuracy of 0.83, balanced accuracy of 0.83, and F1 score of 0.81. Logistic regression and SVM models also performed well, with logistic regression achieving an AUC of 0.91, accuracy of 0.84, and an F1 score of 0.83, while the SVM had an AUC of 0.89, accuracy of 0.83, and an F1 score of 0.82. The KNN model had a lower AUC of 0.87 and an accuracy of 0.74, with a recall of 0.62. Gradient boosting and decision tree showed the lowest performance with AUCs of 0.76 and 0.74 respectively, and corresponding lower metrics across accuracy, balanced accuracy, and F1 scores (Table 5; Fig. 6).

AUC curves of various machine learning models for predicting LGE.
Model selection
Among the studied models, RF, KNN, and logistic regression demonstrated superior performance in assessing myocardial viability in the LAD territory. For the RCA territory, RF, NN, and KNN emerged as the top performers, while RF, NN, and logistic regression excelled in the LCX territory.
Analysis of feature importance, as detailed in Table 6; Fig. 7, revealed territory-specific patterns in predictive parameters. In the LAD territory, the most influential features were dominated by T2 mapping parameters from segments 13 and 14, along with segmental radial strain measurements from segments 7 and 1. The RCA territory showed a strong dependence on mapping parameters, with T2 mapping from segments 9 and 3, and T1 mapping from segment 9 emerging as key predictors. The LCX territory exhibited distinct characteristics where strain measurements played a crucial role, particularly the segmental circumferential strain of segment 11, T2 mapping of segment 6, and segmental longitudinal strain of segment 5 (Table 7).

Nomogram importance of T1/ T2 mapping and feature tracking analysis in each segment compared to other segments and features.
SHAP evaluation
SHAP evaluation was conducted to identify the most important features influencing the prediction of LGE. The obtained results align closely with the average feature importance reported in the previous section (Fig. 8).

SHAP analysis shows the importance of each feature in the top three best-performing models for predicting LGE across coronary territories.
Discussion
In ischemic heart disease, detecting areas beyond saving is just as important as finding salvageable tissue. Thus, viability studies are now an integral part of the IHD management armamentarium16,17. Current viability studies are based on LGE as a representative marker of fibrosis and subsequent extracellular volume expansion. Other imaging properties such as T1/T2 mapping and strain analysis theoretically show changes in concert with tissue replaced by fibrosis, making them potential markers for viability assessment18,19,20. In contrast to LGE, in order to measure these markers, contrast injection is not needed, which enables viability study to be performed faster and safer, especially in individuals with IHD who are at increased risk of concomitant renal disease and are more likely to be unable to undergo prolonged imaging modalities21,22. In the current study, by employing multiple ML models, we tried to extract the best features for predicting the myocardial tissue viability–determined by LGE–from strain and T1 and T2 mapping values. This could provide a basis for building sophisticated prediction models of myocardial tissue viability without LGE sequences.
Prior research has shown promising results in using non-contrast CMR images as an alternative to LGE-CMR for detecting myocardial infarction, eliminating the need for gadolinium injection. Several key studies have demonstrated this potential; Baessler et al. assessed 72 patients (52 with myocardial infarction, 20 healthy controls) using radiomics features and logistic regression models, achieving an AUC of 0.93 for large infarctions and 0.92 for small infarctions9. Zhang et al.‘s study of 843 myocardial infarction patients using a deep learning virtual native enhancement model showed strong correlation with LGE in scar quantification (R = 0.89) and 84% accuracy in detecting scars2. Additional research includes Chen et al.‘s study of 150 patients using a combined physiological-clinical ML model, achieving 88.67% classification accuracy23, and Xu et al.‘s work with deep spatiotemporal generative adversarial networks on cine-CMR images, reaching 96.98% pixel classification accuracy24. Abdulkareem et al. analyzed 272 patients (108 with infarction, 164 controls) using U-Net and ResNet50 models, with SVM achieving accuracy scores of 0.68 and decision trees reaching 0.6225.
However, non-contrast assessment of myocardial viability across different segments and coronary territories has been limited to isolated parameter analysis and small sample sizes. Two notable studies explored this area: Dastidar et al. demonstrated excellent diagnostic accuracy using native T1 mapping compared to LGE (AUC of 0.88 in chronic MI and 0.83 in acute MI) in 60 patients7, while Tantawy et al. showed moderate diagnostic accuracy using Feature Tracking strain analysis (AUC of 0.7 for circumferential strain and 0.67 for radial strain) in 30 chronic ischemic patients6.
Hence, for the first time our study aimed to evaluate the combined efficacy of FT strain analysis and T1/T2 mapping integrated with ML pattern recognition techniques for predicting myocardial viability at both segmental and coronary artery territory levels. Notably, the assessment of coronary artery territory viability has not been addressed in prior studies. This analysis provides crucial information for clinical decision-making regarding revascularization strategies and risk stratification.
We found that within the LAD territory, RF, logistic regression, and KNN showed the highest discriminatory power for viability. The ten most valuable features extracted comprise various segmental radial and circumferential peak strains and T2 mapping, along with global T2 mapping. Concerning LCX territory, RF, NN, and logistic regression were the most fruitful methods. Circumferential strains of all segments were within the ten best features, while only one segment’s radial and longitudinal strain was within these features. Basal T1 and basal and mid T2 were also found to be within the most effective features for viability assessment. Regarding segments supplied by RCA, RF, NN, and KNN were found to be superior. The ten most effective features only comprised T1 and T2 mapping values except for the circumferential strain of one mid-segment.
Similar to prior literature, we found the highest discriminatory value between viable and non-viable regions were circumferential and radial strains rather than longitudinal ones6. GCS and GRS showed the highest correlations with LVEF, while GLS was the least correlated global strain6,26. Moreover, the circumferential global strain is the most reproducible global strain6,27. Thus, taking circumferential strains into account for viability prediction might be more practical compared to other strain values, especially in LAD territory.
Another merit of segmental peak strains is their discriminatory value for myocardial viability assessment of their respective segments6. To the best of our knowledge, this study is the first to pursue strain and T1 and T2 mapping features to determine the myocardial viability according to coronary circulation territories. Evaluating the segmental strains and T1 and T2 mapping values based on their respective coronary territory theoretically could enhance myocardial tissue viability prediction. We found that the most valuable features differ for each coronary territory. The best extracted features for RCA territory were mostly T1 and T2 mapping, while those of LAD and LCX were mostly segmental peak strains. Possible explanation for this difference is the fact that strain values of RCA territory which is mostly comprised of right ventricle, cannot be as precisely and accurately measured as LCX and LCA territories28.
A number of studies pursued cut-points for peak strain values to discriminate viable and non-viable myocardium6,29. However, we tried to build a basis to develop a ML model composed of the best discriminatory features, taking arterial territories into account in order to attain higher accuracy. Given the complexity of myocardial tissue hibernation/stunning and viability pathophysiology, the ultimate model hypothetically surpasses the discriminatory power of a single feature.
The findings of this study demonstrate the potential of ML techniques guided by FT strain analysis and T1/T2 mapping, to predict myocardial viability with high accuracy. This approach offers a non-contrast alternative to the traditional LGE-based method, addressing some of the limitations associated with LGE, such as contrast agents dependency and inability to enlighten functional features of myocardial tissue.
Our results indicate that ML models, particularly gradient boosting and RF, achieved high performance metrics in predicting myocardial viability, with AUC, precision, recall, accuracy, and F1 scores comparable to those obtained with LGE30,31. This finding is consistent with previous studies that have highlighted the effectiveness of ML algorithms in cardiac imaging and viability assessment32,33. The integration of FT strain analysis and T1/T2 mapping provides a more comprehensive evaluation of myocardial tissue characteristics, potentially enhancing the diagnostic capability beyond what is achievable with LGE alone34,35.
The deep learning model, utilizing a 5-layer fully connected NN, also demonstrated strong predictive performance. This supports the growing body of evidence that deep learning techniques can effectively handle complex, high-dimensional data and uncover intricate patterns beyond the traditional methods’ grasp36. Previous studies have shown that deep learning models can outperform conventional ML algorithms in various medical imaging tasks, including cardiac imaging. Our study adds to this literature by demonstrating the applicability of deep learning in the context of myocardial viability assessment.
One significant advantage of using FT strain analysis and T1/T2 mapping is the ability to provide functional and structural information about the myocardium without the need for contrast administration. This is particularly beneficial for patients with contraindications to gadolinium-based contrast agents as those with chronic kidney disease10. Moreover, these non-contrast techniques can be easily integrated into routine CMR protocols, potentially increasing their adoption in clinical practice and decrease health expenditure37. However, the application of ML and deep learning techniques requires substantial computational resources and expertise, which may limit their widespread use in clinical settings without appropriate support and infrastructure.
This study demonstrates that ML and deep learning techniques can effectively predict myocardial viability based on FT strain analysis and T1/T2 mapping data, offering a promising alternative to LGE. Future research should focus on the prospective validation of these findings, the integration of these techniques into clinical workflow, and the exploration of their potential to improve patient outcomes. This approach has the potential to provide a comprehensive, non-invasive, and patient-friendly alternative to current methods. Machine learning is increasingly essential in medical imaging diagnostics, yet it faces critical limitations that need addressing. These include the small sample size problem and the scarcity of labeled data, inefficiencies in managing multiple optimization objectives in complex diagnostic scenarios, and challenges in real-time processing of streaming medical data. Although recent studies have made significant strides in overcoming these issues, further research is necessary38,39,40,41. Besides, Deep learning architectures, especially convolutional neural networks (CNNs), have demonstrated remarkable capabilities in automatically extracting relevant features from medical images, often matching or exceeding human-level performance in specific diagnostic tasks42,43,44, which could be further used in myocardial viability assessment.
Limitations
The primary limitations of our study stem from the inherent biases associated with its retrospective design and the quality of the data collected retrospectively. Although the use of SMOTE helped mitigate class imbalance, it could not fully resolve this issue. Therefore, future prospective studies with larger, more diverse populations, utilizing a variety of MRI scanners and post-processing software, are essential to validate our findings. Notably, in this study, myocardial viability was categorized into two groups: viable and non-viable, with remote myocardial regions included in the viable category. Furthermore, the involvement of radiology specialists remains critical for accurately measuring strain and delineating ROI when applying this model.
Conclusion
In conclusion, the study demonstrated that RF and NN models provide the highest accuracy in predicting myocardial viability across different coronary territories, with notable performance in RCA and LCX regions. The integration of non-contrast imaging techniques, including T1/T2 mapping and strain analysis, proves valuable in enhancing viability assessment. Key features from these imaging techniques significantly contribute to predictive modeling, highlighting their potential to improve diagnostic accuracy for MI. This research underscores the promise of advanced imaging combined with ML to refine cardiac viability evaluation. Further studies should consider including a more diverse patient population from multiple centers and validating the promising findings of this study in various clinical settings, using multiple MR scanners and post-processing software. Additionally, performing radiomics analyses could potentially improve the model’s performance.
Data availability
The data supporting the findings of this study are available from the corresponding author (mralimohammadzadeh@yahoo.com) upon reasonable request.
References
Giovanni, A. et al. Global burden of cardiovascular diseases and risk factors, 1990–2019: update from the GBD 2019 study. J. Am. Coll. Cardiol. 76(25), 2982–3021 (2020).
Zhang, Q. et al. Artificial intelligence for contrast-free MRI: scar assessment in myocardial infarction using deep learning–based virtual native enhancement. Circulation 146(20), 1492–1503 (2022).
Roes, S. D. et al. Comparison of myocardial infarct size assessed with contrast-enhanced magnetic resonance imaging and left ventricular function and volumes to predict mortality in patients with healed myocardial infarction. Am. J. Cardiol. 100(6), 930–936 (2007).
Kelle, S. et al. Prognostic value of myocardial infarct size and contractile reserve using magnetic resonance imaging. J. Am. Coll. Cardiol. 54(19), 1770–1777 (2009).
Cau, R. et al. Artificial intelligence applications in cardiovascular magnetic resonance imaging: are we on the path to avoiding the administration of contrast media? Diagnostics 13(12), 2061 (2023).
Tantawy, S. W., Mohammad, S. A., Osman, A. M., El Mozy, W. & Ibrahim, A. S. Strain analysis using feature tracking cardiac magnetic resonance (FT-CMR) in the assessment of myocardial viability in chronic ischemic patients. Int. J. Cardiovasc. Imaging 37(2), 587–596 (2021).
Dastidar, A. G. et al. Native T1 mapping to detect extent of acute and chronic myocardial infarction: comparison with late gadolinium enhancement technique. Int. J. Cardiovasc. Imaging 35, 517–527 (2019).
Cau, R. et al. Potential role of artificial intelligence in cardiac magnetic resonance imaging: can it help clinicians in making a diagnosis? J. Thorac. Imaging. 36(3), 142–148 (2021).
Baessler, B. et al. Subacute and chronic left ventricular myocardial scar: accuracy of texture analysis on nonenhanced cine MR images. Radiology 286(1), 103–112 (2018).
Avard, E. et al. Non-contrast cine Cardiac magnetic resonance image radiomics features and machine learning algorithms for myocardial infarction detection. Comput. Biol. Med. 141, 105145 (2022).
Larroza, A. et al. Differentiation between acute and chronic myocardial infarction by means of texture analysis of late gadolinium enhancement and cine cardiac magnetic resonance imaging. Eur. J. Radiol. 92, 78–83 (2017).
Amzulescu, M. S. et al. Myocardial strain imaging: review of general principles, validation, and sources of discrepancies. Eur. Heart J. Cardiovasc. Imaging 20(6), 605–619 (2019).
Schuster, A., Hor, K. N., Kowallick, J. T., Beerbaum, P. & Kutty, S. Cardiovascular magnetic resonance myocardial feature tracking: concepts and clinical applications. Circ. Cardiovasc. Imaging 9(4), e004077 (2016).
Muser, D., Castro, S. A., Santangeli, P. & Nucifora, G. Clinical applications of feature-tracking cardiac magnetic resonance imaging. World J. Cardiol. 10(11), 210–221 (2018).
Pedrizzetti, G., Claus, P., Kilner, P. J. & Nagel, E. Principles of cardiovascular magnetic resonance feature tracking and echocardiographic speckle tracking for informed clinical use. J. Cardiovasc. Magn. Reson. 18(1), 51 (2016).
Garcia, M. J. et al. State of the art: imaging for myocardial viability: a Scientific Statement from the American Heart Association. Circ. Cardiovasc. Imaging 13(7), e000053 (2020).
Virani, S. S. et al. 2023 AHA/ACC/ACCP/ASPC/NLA/PCNA Guideline for the management of patients with chronic coronary disease: a report of the American Heart Association/American College of Cardiology Joint Committee on Clinical Practice guidelines. Circulation 148(9), e9–e119 (2023).
Taylor Andrew, J., Salerno, M., Dharmakumar, R. & Jerosch-Herold, M. T1 mapping. JACC: Cardiovasc. Imaging 9(1), 67–81 (2016).
Hamlin, S. A., Henry, T. S., Little, B. P., Lerakis, S. & Stillman, A. E. Mapping the future of Cardiac MR Imaging: case-based review of T1 and T2 mapping techniques. RadioGraphics 34(6), 1594–1611 (2014).
Schuster, A., Hor, K. N., Kowallick, J. T., Beerbaum, P. & Kutty, S. Cardiovascular Magnetic Resonance Myocardial Feature Tracking. Circulation: Cardiovascular Imaging 9(4), e004077 (2016).
Deferrari, G., Cipriani, A. & La Porta, E. Renal dysfunction in cardiovascular diseases and its consequences. J. Nephrol. 34(1), 137–153 (2021).
Laffin, L. J. & Bakris, G. L. Intersection between chronic kidney Disease and Cardiovascular Disease. Curr. Cardiol. Rep. 23(9), 117 (2021).
Chen, Z. et al. Prediction of myocardial infarction from patient features with machine learning. Front. Cardiovasc. Med. 9, 754609 (2022).
Xu, C. et al. Segmentation and quantification of infarction without contrast agents via spatiotemporal generative adversarial learning. Med. Image. Anal. 59, 101568 (2020).
Abdulkareem, M. et al. Predicting post-contrast information from contrast agent free cardiac MRI using machine learning: challenges and methods. Front. Cardiovasc. Med. 9, 894503 (2022).
Kihlberg, J., Haraldsson, H., Sigfridsson, A., Ebbers, T. & Engvall, J. E. Clinical experience of strain imaging using DENSE for detecting infarcted cardiac segments. J. Cardiovasc. Magn. Reson. 17(1), 50 (2015).
Morton, G. et al. Inter-study reproducibility of cardiovascular magnetic resonance myocardial feature tracking. J. Cardiovasc. Magn. Reson. 14(1), 34 (2012).
Lange, T. & Schuster, A. Quantification of myocardial deformation applying CMR-Feature-tracking—all about the left ventricle? Curr. Heart Fail. Rep. 18(4), 225–239 (2021).
Becker, M. et al. Myocardial deformation imaging based on ultrasonic pixel tracking to identify reversible myocardial dysfunction. J. Am. Coll. Cardiol. 51(15), 1473–1481 (2008).
Li, G. et al. Mapping myocardial viability using interleaved T1-T2* weighted imaging. Int. J. Cardiovasc. Imaging 20(2), 135–143 (2004).
Azzu, A. et al. Myocardial strain analysis by cardiac magnetic resonance 3D feature-tracking identifies subclinical abnormalities in patients with neuromuscular disease and no overt cardiac involvement. Eur. Heart J. Cardiovasc. Imaging 24(4), 503–511 (2023).
Rouzrokh, P. et al. Machine Learning in Cardiovascular Imaging: a scoping review of published literature. Curr. Radiol. Rep. 11(2), 34–45 (2023).
Xing, J. et al. JOINT DEEP LEARNING FOR IMPROVED MYOCARDIAL SCAR DETECTION FROM CARDIAC MRI. Proc. IEEE Int Symp Biomed Imaging. 2023. (2023).
Chudgar, P. D., Burkule, N. J., Kamat, N. V., Rege, G. M. & Jantre, M. N. Myocardial strain imaging using feature tracking method of Cardiac MRI: our initial experience of this Novel parameter as an additional Diagnostic Tool. Indian J. Radiol. Imaging 32(4), 479–487 (2022).
Taylor, R. J. et al. Myocardial strain measurement with feature-tracking cardiovascular magnetic resonance: normal values. Eur. Heart J. Cardiovasc. Imaging 16(8), 871–881 (2015).
Litjens, G. et al. A survey on deep learning in medical image analysis. Med. Image Anal. 42, 60–88 (2017).
Pennell, D. J. Cardiovascular magnetic resonance. Circulation 121(5), 692–705 (2010).
Fei, X., Wang, J., Ying, S., Hu, Z. & Shi, J. Projective parameter transfer based sparse multiple empirical kernel learning machine for diagnosis of brain disease. Neurocomputing 413, 271–283 (2020).
Shi, B. et al. Prediction of recurrent spontaneous abortion using evolutionary machine learning with joint self-adaptive sime mould algorithm. Comput. Biol. Med. 148, 105885 (2022).
Chen, M-R., Zeng, G-Q. & Lu, K-D. A many-objective population extremal optimization algorithm with an adaptive hybrid mutation operation. Inf. Sci. 498, 62–90 (2019).
Jin, X., He, T. & Lin, Y. Multi-objective model selection algorithm for online sequential ultimate learning machine. EURASIP J. Wirel. Commun. Netw. 2019, 1–7 (2019).
Zeng, N. et al. DPMSN: a dual-pathway multiscale network for image forgery detection. IEEE Trans. Industr. Inf. (2024).
Xiong, B. et al. TranSEMG: a Trans-Scale Hybrid Model for High-Accurate Hip Joint Moment Prediction. IEEE Trans. Instrum. Meas. (2024).
Wen, W. et al. Enhanced multi-label cardiology diagnosis with channel-wise recurrent fusion. Comput. Biol. Med. 171, 108210 (2024).
Acknowledgements
The authors wish to express their sincere gratitude to the Rajaie Cardiovascular Medical and Research Center, Department of Radiology, for providing the invaluable data used in this study. Special thanks are extended to Dr. Maedeh Dastmardi and Dr. Ghazaleh Salehabadi for their invaluable support and assistance throughout the research process.
Author information
Authors and Affiliations
Contributions
A.G.J. contributed to data formal analysis and writing - original draft. A.S. and K.H. contributed to data curation. M.M.B. and P.P. contributed to writing - review & editing. A.A. contributed to visualization. Conceptualization was carried out by A.M.
Corresponding author
Ethics declarations
Competing interests
The authors declare no competing interests.
Declaration of generative AI in scientific writing
During the preparation of this work the authors used Grammarly and ChatGPT in order to correct the text and make it fluent. After using this tool/service, the authors reviewed and edited the content as needed and take full responsibility for the content of the publication.
Additional information
Publisher’s note
Springer Nature remains neutral with regard to jurisdictional claims in published maps and institutional affiliations.
Rights and permissions
Open Access This article is licensed under a Creative Commons Attribution-NonCommercial-NoDerivatives 4.0 International License, which permits any non-commercial use, sharing, distribution and reproduction in any medium or format, as long as you give appropriate credit to the original author(s) and the source, provide a link to the Creative Commons licence, and indicate if you modified the licensed material. You do not have permission under this licence to share adapted material derived from this article or parts of it. The images or other third party material in this article are included in the article’s Creative Commons licence, unless indicated otherwise in a credit line to the material. If material is not included in the article’s Creative Commons licence and your intended use is not permitted by statutory regulation or exceeds the permitted use, you will need to obtain permission directly from the copyright holder. To view a copy of this licence, visit http://creativecommons.org/licenses/by-nc-nd/4.0/.
About this article

Cite this article
GhaffariJolfayi, A., Salmanipour, A., Heshmat-Ghahdarijani, K. et al. Machine learning-based interpretation of non-contrast feature tracking strain analysis and T1/T2 mapping for assessing myocardial viability. Sci Rep 15, 753 (2025). https://doi.org/10.1038/s41598-024-85029-0
Received:
Accepted:
Published:
Version of record:
DOI: https://doi.org/10.1038/s41598-024-85029-0
Keywords
This article is cited by
-
Time series analysis of ex-vivo ischemia-reperfused heart using Q-space imaging
Scientific Reports (2025)
