
Fig. 2
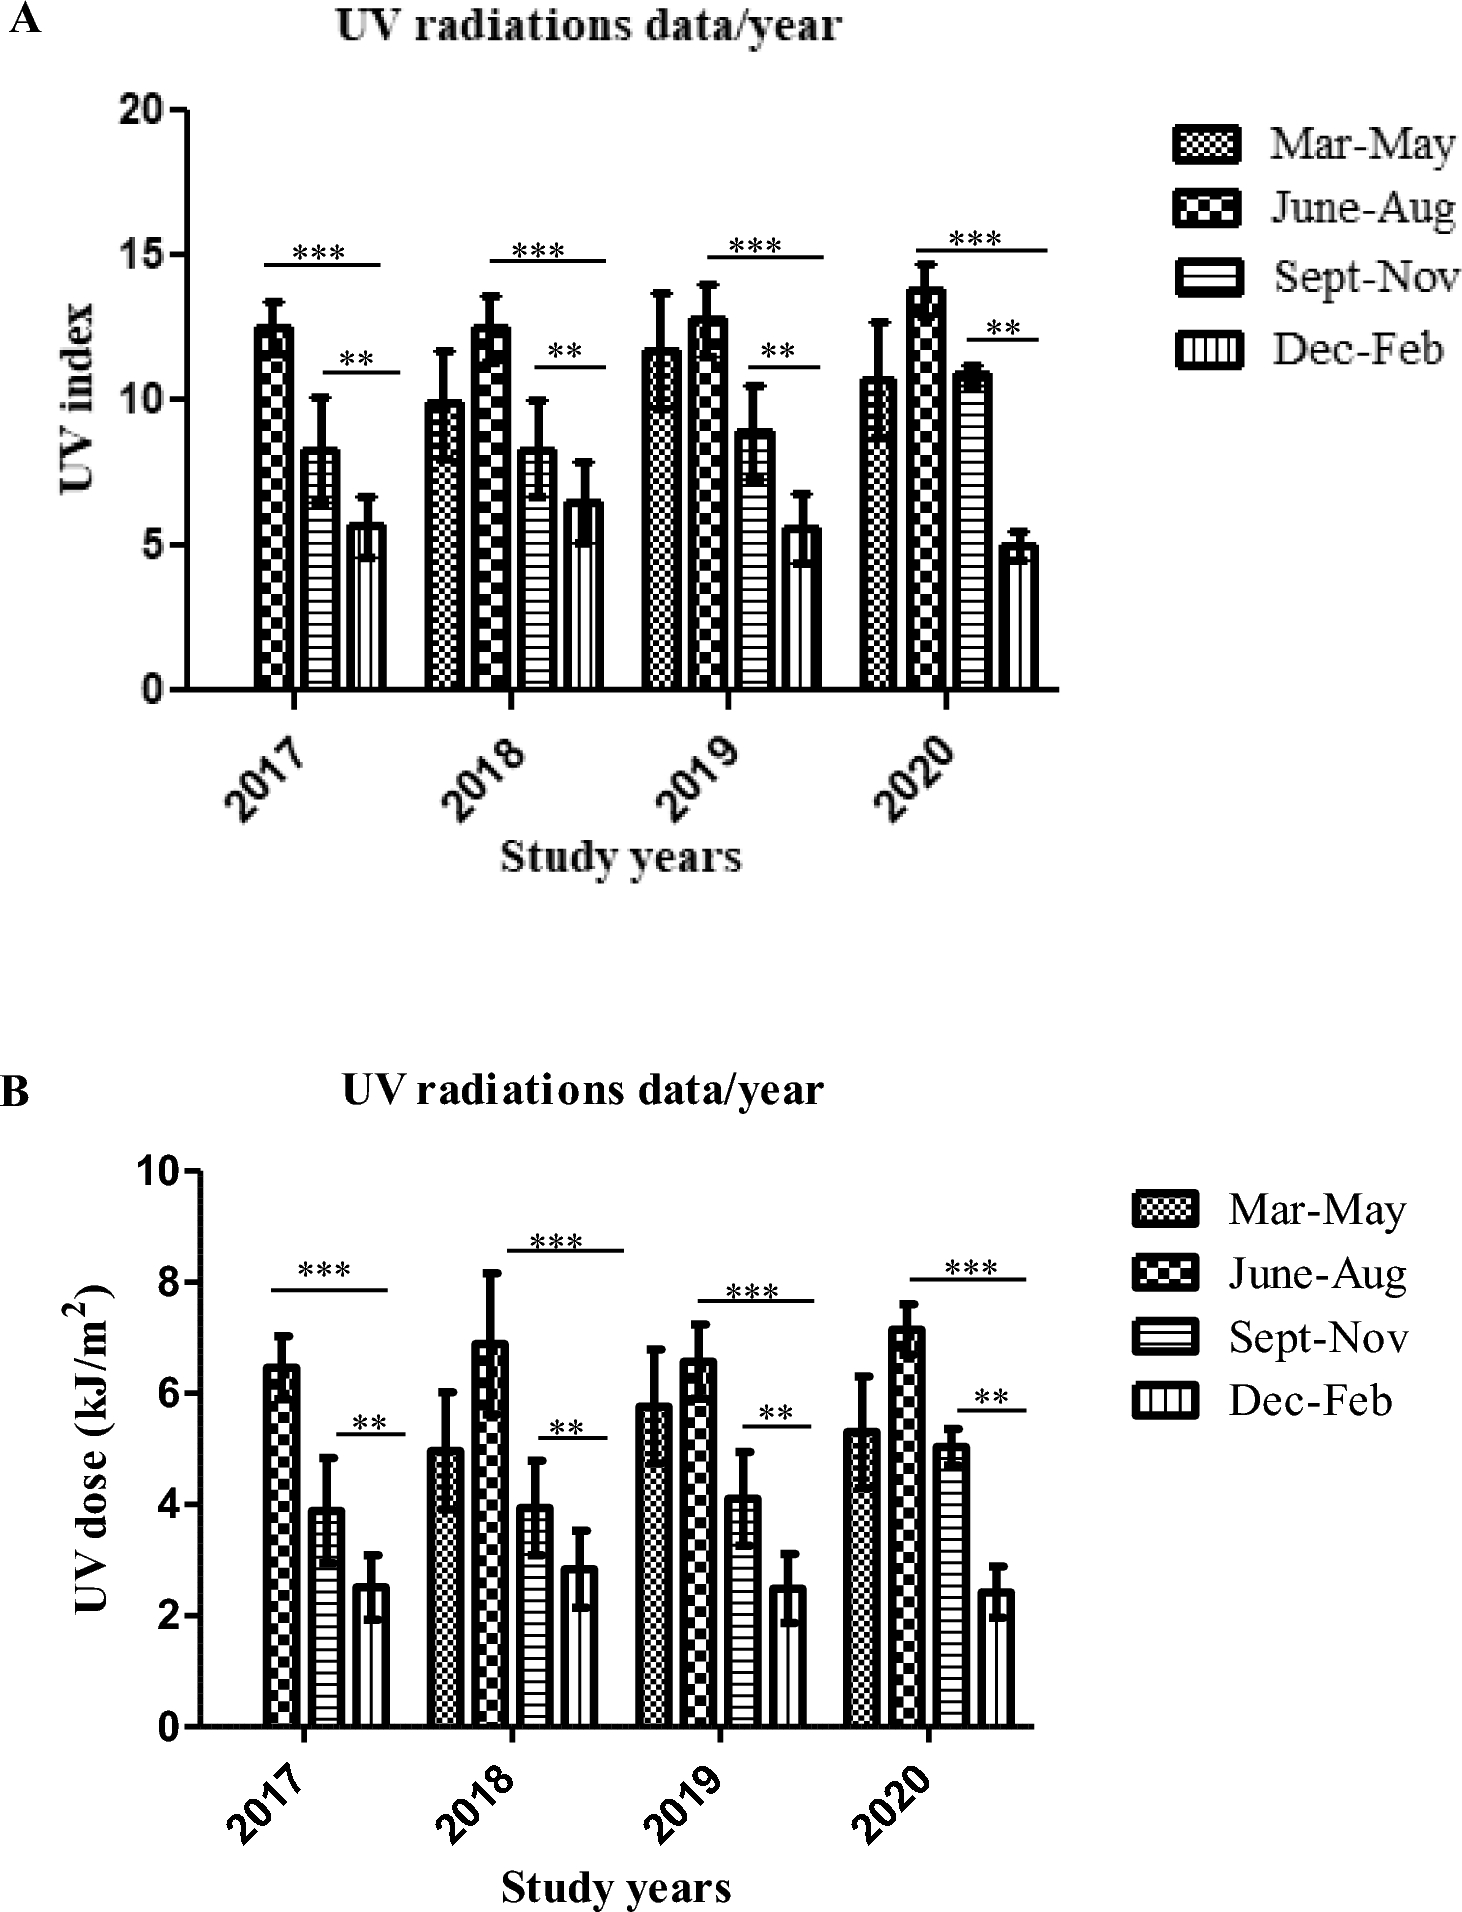
Graphical presentation of UV index and UV dose across seasons: The trends of sunlight UV radiations index were displayed in four seasons: March–May, June–Aug, Sept–Nov and Dec–Feb from 2017 to 2020 (A). Similarly, the patterns of sunlight UV radiations dose (kJ/m2) were demonstrated in four seasons: March–May, June–Aug, Sept–Nov and Dec–Feb from 2017 to 2020 (B). The daily datasets were made average each month and similarly the mean of the given three months were plotted with standard deviations for year-wise comparison. The statistical analysis shows as p-values p < 0.001 (**) significant and < 0.0001 (***) are highly significant.
