
Abstract
This research proposes an integrated optimization framework combining artificial neural networks (ANN) and Taguchi robust design for an eco-friendly deep eutectic solvent-based electrolyte. Five key process parameters—applied voltage, processing time, temperature, electrolyte composition (choline chloride to ethylene glycol ratio) and distilled water concentration—were systematically analyzed for their effects on the surface roughness of electropolished titanium. To address data scarcity and improve the generalization performance of the model, Gaussian noise with a mean of 0 and a standard deviation of 0.05 was applied to the input variables to augment the dataset. The multilayer perceptron-based ANN model effectively learned the nonlinear interactions between process parameters and achieved a high predictive accuracy with a coefficient of determination (R2) of 0.981. The optimal process conditions derived from the ANN model were 20 V applied voltage, 21 min of processing time, a 1:4 electrolyte ratio, 0% distilled water and 42℃, under which a minimum surface roughness of 4.162 nm was experimentally confirmed. This investigation provides a practical pathway for optimizing processes in environmentally sustainable manufacturing by quantitatively analyzing the nonlinear complexity of electrochemical surface treatments.
Introduction
Titanium is widely used in various high value-added industrial fields and applications, including aerospace, biomedicine and energy conversion devices, such as fuel cells, due to its excellent corrosion resistance and mechanical properties1,2. In particular, the advancement of industry has driven a requirement for excellent surface quality in specialized products, such as medical devices for human implantation, ultraprecision microcomponents and microsensors3,4. However, achieving outstanding surface finishes is challenging with conventional mechanical polishing technologies5. These technologies can improve surface roughness to some extent, but impurities, polishing marks, and processing-related altered layers remain, making them unsuitable for products that require clean and precise surface quality8. In the case of titanium, its considerable strength, ductility and relatively low thermal conductivity render it difficult to machine because it strongly adheres to machining tools during polishing6,7. Therefore, achieving superior surface quality necessitates the use of a highly effective technology called electropolishing, which does not require contact with a workpiece9. Electropolishing not only flattens surfaces but also removes surface defects and impurities, thereby enhancing the performance and durability of products10. Nevertheless, this technology also suffers from drawbacks, among which the greatest are the numerous and diverse process-related factors that affect it11. More specifically, variables such as voltage, current density, processing time, temperature, electrolyte type, and the addition of distilled water influence electropolishing results. The incorrect selection of these factors can degrade surface quality. Thus, it is essential to determine the optimal conditions for each factor in the electropolishing of titanium12. Additionally, due to the complexity of interactions between these factors, it is challenging to achieve surface flattening through simple experimental designs, and designing experiments that combine all possible factors and conditions is highly inefficient.
Conventional electropolishing has been conducted predominantly in strongly acidic solutions, but recent investigations have focused on optimizing titanium electropolishing using eco-friendly electrolytes13,14,15. For example, Karim et al. carried out electropolishing investigations in various organic solvents (ethanol, methanol, n-butanol) based on choline chloride and reduced surface roughness to the nanoscale level13. However, the process required a relatively long period of approximately 40 min and applied voltages of 1.2 and 2 V13. Ferreri et al. electropolished Ti alloy in a solution containing NaCl and ethylene glycol14 under a selected voltage, temperature and processing time of 25 V, 23 °C and 50 min, respectively14. Similarly, Kim et al. investigated pure Ti electropolishing in a solution of NaCl and ethylene glycol with varying ethanol concentrations15. The problem is that the processing conditions included a temperature of 20 °C, an applied voltage of 20 V and a processing time of 50 min15.
Conventional electropolishing has been conducted in various investigations, but these are often performed on the basis of experience. Moreover, optimization research aimed at simultaneously reducing processing time and improving surface quality remains a considerable challenge. These problems were addressed in Hwang et al.’s recent systematic exploration of electropolishing optimization, which involved the use of Taguchi robust design as an experimental design method16. This method enables the efficient analysis of the relationship between independent variables and responses as well the average effect of each factor and its interaction with other determinants16. Furthermore, design of experiments approaches such as the Taguchi robust design have been effectively applied to optimize various manufacturing processes17,18,19. For example, Al et al.17 employed Taguchi robust design for optimizing discharge machining of 2000-series aluminum using an eco-friendly dielectric fluid. Also, Farooq et al.18,19 conducted optimization studies using DOE and the Taguchi methodology to improve surface quality in titanium electrical discharge machining processes. Nevertheless, Taguchi robust design is confronted with challenges in the examination of sensitive interactions, including complex nonlinear relationships, and has limitations in reasonably predicting surface roughness according to various processing conditions20. Correspondingly, deep learning technologies based on artificial neural networks (ANNs) have recently been widely adopted in experimental design, prediction, and outcome optimization21.
With consideration for the abovementioned issues, the current inquiry was conducted to improve the surface quality of titanium while reducing processing time from 40 to 50 min to approximately 20 min using ANN-based deep learning technologies. The results of ANN modeling were then compared with those derived using conventional Taguchi robust design to analyze the differences between the two methodologies. On the basis of the ANN results, optimization and prediction were carried out to minimize the surface roughness of the material. Finally, the predicted surface roughness was experimentally verified under the newly designed electropolishing conditions. Especially, this investigation is to establish a practical ANN-based modeling framework capable of predicting and optimizing the electropolishing outcomes of titanium in a choline chloride-based eco-friendly electrolyte system, which has not been systematically analyzed to date.
Experimental method
Preparation of specimens
Grade 1 commercially pure titanium, conforming to ASTM B265, was used as the specimen material. Its chemical composition includes Ti ≥ 99.5%, Fe ≤ 0.20%, C ≤ 0.08%, N ≤ 0.03%, H ≤ 0.015% and O ≤ 0.18%, with trace impurities as listed in Table 1. Compared to higher-grade titanium, Grade 1 titanium exhibits higher purity and thus offers superior dissolution uniformity during electropolishing. Additionally, due to its excellent corrosion resistance, it is widely applied in various industries such as fuel cell bipolar plates, biomedical devices, chemical processing and marine components, making it a suitable material for the electropolishing experiments in this investigation22. To minimize its thermal deformation, it was processed into specimens with dimensions of 20 mm (W) × 20 mm (L) × 3 mm (t) using a fine-cutting machine supplied with cooling water. The machined specimens were prepared with an exposed surface area of 4 cm2 and mounted with epoxy resin. The machined specimens were prepared with an exposed surface area of 4 cm2 and mounted with epoxy resin. The specimens were mechanically polished in steps up to #600 emery paper. Foreign substances generated during polishing were removed by degreasing with acetone, followed by ultrasonic cleaning in distilled water for 3 min. Subsequently, the specimens were dried in a dryer at 70 °C for 24 h and then used as working electrodes for electropolishing. This specimen preparation ensured standardized initial surface conditions throughout the entire electropolishing process.
Taguchi robust design for electropolishing
The experimental data used for training the artificial neural network (ANN) model in this investigation were obtained through electropolishing experiments conducted on Grade 1 titanium specimens under potentiostatic polarization experiment conditions.
The electropolishing experiments were designed based on the Taguchi L27 orthogonal array (5 factors, 3 levels), resulting in 27 unique combinations of process parameters. To ensure reproducibility and minimize the effect of random errors, each experimental condition was repeated three times, acquiring a total of 81 data points. As shown in Table 2, the experiment was systematically designed using the L27 orthogonal array based on the Taguchi robust design methodology. The orthogonal array method in the Taguchi design allows for effective optimization of process conditions even with two-factor interactions, offering the advantage of significantly reducing the number of required experiments23.
The five key process parameters selected for the electropolishing procedure were: voltage (12, 16, 20 V), processing time (15, 20, 25 min), temperature (25, 35, 45 °C), ethylene glycol to choline chloride (EG: CC) ratio (1:2, 1:3, 1:4) and distilled water concentration (0, 15, 30%). The values 2, 3 and 4 for ethylene glycol (EG) represent the molar ratio mixed with choline chloride, corresponding to 1:2, 1:3 and 1:4 ratios of choline chloride to ethylene glycol, respectively. At this time, the distilled water concentration refers to the amount added to the electrolyte. The S1 represents the surface roughness measured under each electropolishing condition. These five parameters were considered critical factors that significantly influence the behavior of the electropolishing process and the final surface characteristics24,25,26,27. First, voltage is a key factor in electropolishing, and generally, higher voltages increase the dissolution rate of the specimen surface. However, excessive voltage may lead to localized damage, which can deteriorate surface flatness and increase surface roughness28. Processing time directly affects the material removal rate. While it contributes to surface leveling up to a certain point, overly long durations may induce surface imbalance29. In addition, temperature influences the viscosity and ionic mobility of the electrolyte. As temperature rises, ion migration accelerates, increasing reaction rates. Conversely, excessively high temperatures may destabilize ionic exchange at the surface, negatively impacting surface quality30. The molar ratio of ethylene glycol to choline chloride alters the physical properties of the electrolyte, such as conductivity and viscosity, affecting current density distribution and dissolution uniformity. Thus, this ratio is a critical parameter for ensuring processing consistency and reproducibility10. In particular, the addition of distilled water exhibits nonlinear effects. An appropriate concentration of distilled water can enhance the fluidity of the electrolyte, promote mass transport, and thereby contribute to improving process efficiency31. However, excessive addition dilutes ion concentration, reducing electropolishing efficiency. In this way, each variable in the electropolishing process operates independently, but interacts with each other to comprehensively affect the final surface roughness. Therefore, to improve the quality of the electropolishing process, it is essential to closely analyze these interactions and establish an optimization framework based on such insights.
Electropolishing was conducted as a potentiostatic experiment using a three-electrode cell configuration and a potentiostat/galvanostat (GAMRY, Reference 3000). The working, reference and counter electrodes used were titanium, silver/silver chloride (Ag/AgCl saturated 3.3 M KCl) and a platinum mesh electrode, respectively. The surface roughness for each condition was precisely measured after electropolishing using a 3D laser scanning microscope (OLS5000, Olympus), and the repeated measurements (three per condition) ensured the reliability of the dataset.
Figure 1 illustrates the loss function determined on the basis of the “the smaller the better” criterion in Taguchi robust design32,33. These components, which were used in a graph analysis, were defined as follows: The “the smaller the better” criterion sets a target value to 0 (or a specific minimum value), indicating that as the value approaches a target, product quality improves. The loss function quantitatively represents the decrease in product quality when the actual value (i.e., quality) (y) deviates from the target value (m). This deviation (Δ) is illustrated in Fig. 1 (x-axis). The y-axis represents the loss (Ao) corresponding to the deviation (Δ). As can be seen, the “the smaller the better” criterion is aimed at designing process conditions wherein both the deviation and loss function values approach 0, as denoted by the pink arrows in the figure. As observed in the graph, therefore, when the target value is set to 0, the deviation should converge to the blue dotted line. At this point, quality loss and the Taguchi criterion are defined using Eqs. (1) and (2), respectively32,33.
where n represents the number of repetitions, and yi denotes the response value, which corresponds to surface roughness.

Artificial neural network
Figure 2 displays the schematic structure of the ANN used in this investigation. This investigation aimed to employ an artificial neural network (ANN) model to quantitatively predict the surface roughness in the electropolishing process of titanium and to derive optimal process conditions through simulation.
The primary reason for adopting machine learning techniques in this investigation is due to the inherent complexity and high dimensionality of the electropolishing process. The electropolishing process involves five continuous process variables: applied voltage, processing time, temperature, ethylene glycol (EG) ratio and distilled water concentration, all of which form non-linear and multivariate dependencies. As a result, traditional statistical approaches, such as Taguchi robust design or linear regression, are limited in accurately capturing the complex response surface and in predicting conditions beyond the experimental design range.

Schematic diagram for ANN architecture used for modeling electropolishing (V : Voltage, Time : Process time, Temp. : Temperature, EG : Ethylene glycol ratio, DW : Distilled water concentration, Sa : Surface roughness).
Therefore, an artificial neural network (ANN), known as a universal function approximator, was adopted. ANN enables high prediction accuracy and process optimization even for unverified process conditions by learning complex non-linear relationships and interactions among variables directly from the data.
Meanwhile, alternative machine learning techniques such as support vector regression (SVR), random forest (RF) and gradient boosting (GB) were also considered in this investigation34,35,36. However, SVR requires complex kernel parameter tuning to model high-dimensional non-linear interactions, which can limit its practical applicability34. In addition, RF and GB, although excellent in predicting discrete or categorical data, are less suitable for continuous and smooth surface roughness values, as in this investigation35,36.
In fact, investigation by another researcher that predicted the fatigue life of titanium based on various surface finishing techniques reported that the ANN model presented the highest prediction accuracy compared to the SVR and RF models36. Based on these findings, this investigation ultimately selected an ANN architecture that can effectively learn continuous, non-linear and interactive patterns using an augmented dataset. Similarly, Sana et al.37,38 applied ANN models to aluminum and Inconel alloys in EDM processes, reporting improvements in both process efficiency and manufacturing competitiveness. Farooq et al.39 also applied wire electrical discharge machining (WEDM) to Ti6Al4V alloy and enhanced machining accuracy by combining Taguchi robust design and ANN for process optimization.
Accordingly, a supervised learning-based ANN approach was adopted in this investigation to effectively learn the relationship between input and output variables from experimental data. The input variables consisted of five parameters: voltage (V), processing time (min), ethylene glycol to choline chloride ratio and the concentration of added distilled water (%). The output variable was defined as the surface roughness (Ra) under each condition. The ANN framework was implemented in a Python-based deep learning environment using TensorFlow and Keras libraries.
The final dataset was structured to ensure robustness, enhance generalization, and provide a foundation for data expansion. For this purpose, data augmentation was performed by adding Gaussian noise with a mean of 0 and a standard deviation of 0.05 to the 81 experimental data points derived from Taguchi robust design. This augmentation process was repeated 20 times, resulting in a total of 1,620 data points.
This data augmentation strategy was not only intended to increase the data volume but also aimed to realistically reflect the inherent variability and experimental uncertainty in the electropolishing process. In practice, even under identical nominal process conditions, slight variations in applied voltage, electrolyte flow characteristics and localized temperature differences can lead to minor deviations in the experimental results. Hence, Gaussian noise was introduced to simulate such experimental uncertainties, thereby improving the generalization performance and robustness of the ANN model.
Y. Ye et al. and J. Ma reported that data augmentation using Gaussian noise applied to original datasets does not induce overfitting and, in fact, contributes to improved generalization performance of the model40,41. In addition, Q. Wang et al. emphasized that in materials science fields such as alloy design, inevitable process variability during material fabrication frequently leads to mismatches between actual and target compositions, and therefore the introduction of noise is essential to simulate such experimental variations42.
In line with these prior studies, the present work also adopted a Gaussian noise-based data augmentation strategy, which is consistent with methods effectively used in process modeling and predictive analysis for materials processing based on small sample sizes40,41,42.
To mitigate reductions in statistical independence and the risk of overfitting caused by noise application, the following measures were also implemented. First, the standard deviation of the noise was conservatively set at σ = 0.05 to ensure that the augmented data did not significantly deviate from the original distribution. Second, dropout regularization (rate: 20%) and early stopping were applied during the ANN model training to enhance generalization performance.
Prior to model training, Z-score standardization was applied to normalize input features, thereby eliminating scale differences and ensuring uniform input distribution. This data normalization step minimized the possibility of learning errors caused by scale imbalances.
Subsequently, the entire dataset was randomly divided into training (80%, 1,296 points) and test sets (20%), with 20% of the training data used as a separate validation set. This three-way split structure enabled independent performance evaluation of the model on both the validation and test sets.
To mitigate overfitting and bias, dropout regularization of 20% was applied to each hidden layer, and random shuffling was performed prior to data splitting to minimize distributional bias. This preprocessing workflow was designed to allow the ANN model to learn the variability of the experimental data under various input conditions, ensuring more accurate and reliable predictive performance.
ReLU (Rectified Linear Unit) was used as the activation function for the hidden layers43,44,45. The loss function during training was the mean squared error (MSE), which quantifies the squared difference between predicted and measured surface roughness, while the coefficient of determination (R2) was used as a supplementary metric to evaluate model explanatory power43,44,45. The Adam optimizer was employed as the optimization algorithm. To prevent overfitting and enhance model generalization, a dropout rate of 20% was applied to each hidden layer, and early stopping technic was implemented to avoid instability during initial training and excessive iterations46.
First, the Rectified Linear Unit (ReLU) activation function has the advantage of maintaining gradient flow during backpropagation, effectively preventing the vanishing gradient problem that often occurs in deep neural networks43. In particular, because the ReLU function does not impose an upper bound on the output, it is well suited for regression problems involving continuous and potentially infinite target variables, such as surface roughness in electropolishing. In this investigation, the characteristics of the ReLU function were considered effective for capturing the nonlinear and multivariate dependencies inherent in the electropolishing dataset. Accordingly, the ReLU function was selected as the activation function, instead of traditional functions such as Sigmoid or Tanh.
In addition, the ADAM (Adaptive Moment Estimation) optimization algorithm is a widely used and highly efficient alternative to traditional Stochastic Gradient Descent (SGD), offering the advantage of automatically adjusting individual learning rates for each parameter during the training process44. Since the electropolishing process variables differ in physical units, magnitudes and ranges of variation, the ADAM algorithm was employed in this investigation to automatically adjust appropriate learning rates for each variable, enabling stable and efficient convergence. Given the nonlinear and multivariate nature of the electropolishing data, this algorithm was considered highly appropriate and was thus applied in the present model.
Meanwhile, in regression-based prediction models where the output variable is a continuous scalar value, the mean squared error (MSE) is commonly used as the loss function to quantify prediction accuracy45. Accordingly, MSE was employed in this investigation to evaluate the prediction precision of the target variable, surface roughness.
Experimental results and discussion
ANN modeling
The number of nodes and the configuration of hidden layers directly influence the learning capacity, performance and computational efficiency of ANNs. In particular, increasing the number of nodes and hidden layers enhances an ANN’s ability to learn complex data, but this increase may lead to overfitting, thereby reducing the model’s performance when processing new data. Hence, determining an appropriate number of nodes and designing hidden layers are critical factors in optimizing ANN performance. In general, simple functions with output values that increase or decrease linearly based on input values can be adequately learned using only one hidden layer. However, electropolishing exhibits a complex pattern wherein surface roughness repeatedly increases due to surface damage under certain conditions. Thus, we determined that at least two hidden layers would be required in this investigation. To decide on the number of nodes in a hidden layer, we referred to the methodology based on Lachtermacher and Fuller’s empirical law, expressed in Eq. (3)47:
where P represents the size of the learning data, and I denotes the number of input variables.
The dataset size was increased using data augmentation technology48. The existing dataset was replicated 20 times, and random noise with a mean of 0 and a standard deviation of 0.05 was incorporated to create new data. This approach resolved the data scarcity issue and improved the model’s generalization performance without altering surface roughness. Consequently, 1,620 data points were secured (= 81 electropolishing conditions × 20 instances of data augmentation). The number of nodes calculated using Eq. (3) ranged from 29 to 81, on whose basis the node count was expanded from 10 to 100 to evaluate ANN performance across various configurations.
Table 3 compares model performance (fitness) under different numbers of nodes in the hidden layers. Performance was evaluated using the MSE and the coefficient of determination (R2). The closer the MSE and R2 were to 0 and 1, respectively, the better the performance of the ANN model. As evident from Table 3, increasing the number of nodes in the hidden layers improved the MSE and R2 values. In particular, under 70 nodes, the MSE decreased to 0.032070, and the R2 improved to 0.984776. With node count exceeding 70, however, performance improvements became negligible, and computation time increased. These effects elevated the risk of overfitting, potentially degrading prediction performance. Thus, the optimal model configurations determined in this examination were 5, 70 and 1 node in the input layer, two hidden layers and output layer, respectively.
ANN model validation
The ANN deep learning model for electropolishing was trained using a dataset of 1,620 data points, of which 1,296 (80%) were randomly selected for training, while 324 (20%) were used for validation49. The ANN was trained over 10,000 epochs50.
Figure 3 illustrates the variations in the loss function during the training process. Training loss represents the error between the actual value and the output value calculated using the model for the training data. The validation loss represents the error between the actual value and the output value calculated using the validation data, independent of the training data. Both the training and validation losses decreased significantly during the first 110 epochs before stabilizing at nearly constant values. The final training loss was 4.53 × 10⁻², and the validation loss was 3.74 × 10⁻². To mitigate overfitting concerns during training, early stopping and callback functions were implemented in this work51. Training was terminated early at approximately 800 epochs.

Loss functions for the training and validation for deep learning.
Figure 4 compares the surface roughness predicted using the ANN with the actual experimental results. In ideal conditions, when the predicted and actual values match perfectly, the slope of a regression line is 1, and the y-intercept is 0. In this investigation, the slope of the training data exceeded 0.94, with a y-intercept of 0.05246 and an R2 of 0.99168. The slope of the validation data exceeded 0.95, with a y-intercept of 0.0764 and an R2 of 0.99198. Jalal et al. used artificial intelligence to model the expansion strength of soil52. Among various prediction models, gene expression programming yielded R2 values of 0.91 and 0.95 for training and validation data, respectively, which were reported as indicators of high predictive performance52. Similarly, the ANN model developed in the present exploration was regarded as a reliable predictive tool for evaluating surface roughness during electropolishing given that the R2 values of both the training and validation data exceeded 0.94.

Comparison between the experimental and predicted roughness for (a) 1296 training data and (b) 324 validation data. Linearity is sufficiently high to regard the ANN model as accurate.
Optimization of the electropolishing process
As with the use of analytical tools in Taguchi robust design, this inquiry involved adopting an ANN to derive statistical results for estimating the main effects of each factor that influenced surface flatness. A dataset of 1,000 randomly generated electropolishing conditions was used, and surface roughness values were predicted using the ANN. The main effects of the factors were ascertained via local averaging (Fig. 5).
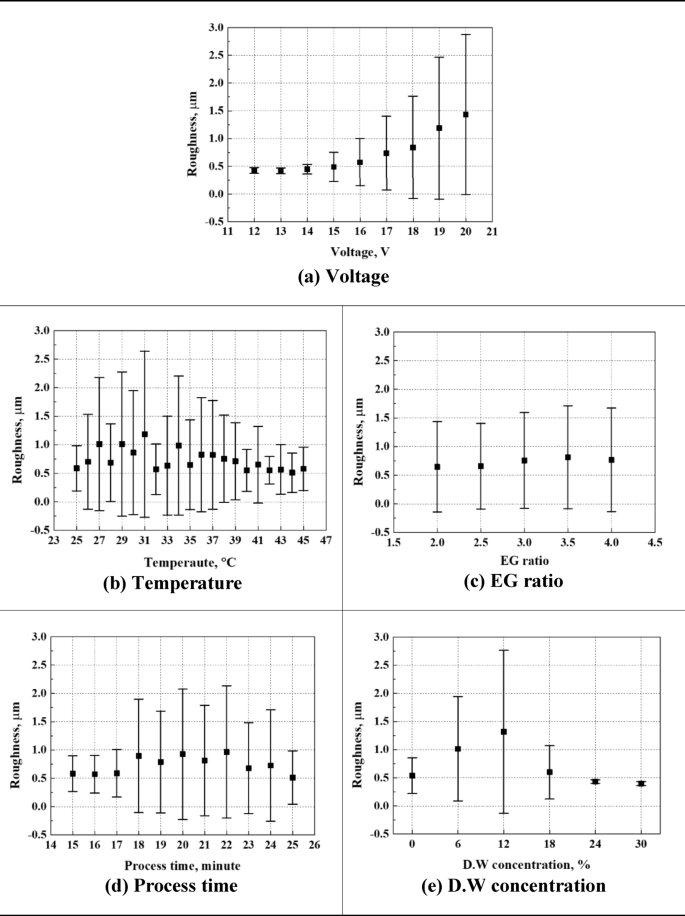
Main effects of the parameters on the roughness. The roughness were predicted using the ANN from 1000 random combinations of parameters and locally averaged for plotting.
Surface roughness increased with rising voltage (Fig. 5). In particular, in the initial voltage range of 12 to 14 V, surface roughness exhibited a small standard deviation (0.05–0.09), pointing to stable electropolishing conditions. Beyond 15 V, however, the standard deviation increased, reflecting diminished processing stability. This linear variation in surface roughness suggests that voltage is the most significant determinant of surface roughness.
In general, increasing temperature is expected to enhance ionization reactions and reduce surface roughness during electropolishing. However, the main effect analysis using the ANN model in this investigation revealed that temperature did not significantly affect surface roughness. This can be interpreted as the temperature range of 25–45 °C set in this investigation being appropriate for electropolishing, and the contribution of temperature being relatively limited from a data-driven perspective.
The ethylene glycol (EG) ratio directly influences the viscosity of the electrolyte due to hydrogen bonding between hydroxyl groups (-OH) in EG. When the EG ratio is low, the reduced viscosity enhances ion mobility and reaction activity, but may cause localized current concentration, leading to uneven surfaces. At higher EG ratios, mass transfer becomes more stabilized, enabling more uniform current distribution. However, excessive viscosity can cause uneven current density and localized damage such as pitting. In fact, in this investigation, increasing the EG ratio from 2.5 to 3.0 led to a slight increase in surface roughness from 0.65 μm to 0.75 μm, though not statistically significant. In addition, even at an EG ratio of 4.0, no severe effects were observed, suggesting that the process was relatively stable within the tested range.
Regarding processing time, surface roughness tended to stabilize beyond a certain threshold. Between 18 and 24 min, surface roughness presented consistent mean values and standard deviations, indicating that this range is suitable for stable processing. However, in ANN analysis, processing time was not learned as a dominant influencing variable, which is interpreted as a result of the safe time range used in the experiments that did not trigger excessive reactions.
When distilled water was added in the 6–12% range, it enhanced ion diffusivity in the electrolyte, promoting the electropolishing reaction. However, this also led to decreased uniformity of surface dissolution, increasing surface roughness variation. In particular, the lowest surface roughness was observed at the 12% concentration condition, which is considered to represent the optimal composition where the fluidity of the electrolyte and ion mobility are well balanced. In contrast, when the distilled water concentration increased to 18% or higher, the electrolyte became excessively diluted, leading to reduced electropolishing efficiency, and consequently, a deterioration in surface quality. This trend was also reflected in the ANN main effect analysis, where the influence of distilled water was significant up to 12%, but diminished rapidly beyond that point and was no longer considered a key factor.
The analysis conducted using Taguchi robust design reflected that only voltage significantly affected surface roughness and that all the other factors had little effect. However, the added distilled water had the highest effect next to voltage. These results demonstrate that the prediction results derived via Taguchi robust design and ANN modeling exhibited similar trends overall.
Figure 6 visualizes the interaction effects of the factors on two electropolishing processes. This image is similar to Fig. 5, which displays averaged results by region as a contour plot. Graphing was implemented using development software (Visual Studio) and Python. Graph generation with code execution was performed independently by creating a virtual environment in Anaconda software.

Interaction effects of binary electropolishing condition on the roughness. The roughness were predicted using the ANN from 1000 combinations of random electropolishing condition and locally averaged for plotting.
In the contour plot in Fig. 6, the x-axis and y-axis represent the factors affecting electropolishing. The surface roughness produced by the interaction of two factors is expressed in a color (red–blue) range, with the area marked in dark blue illustrating low surface roughness. In general, when contour lines are perpendicular or horizontal to each other, then two given factors have no interaction effect. In Fig. 6, the graphs corresponding to two given factors are labeled 1 to 10 to improve readability. The main results are as follows.:
First, the interaction between voltage and processing time (Fig. 6-(1)) revealed that short durations at high voltage (18–20 V) resulted in increased surface roughness due to rapid reactions driven by high current density. Even under long durations, excessive current led to surface damage.
The interaction between voltage and temperature (Fig. 6-(2)) indicated a synergistic effect, where increased values of both parameters accelerated reactions, and may cause localized damage such as pitting under aggressive conditions. In the voltage and EG ratio interaction (Fig. 6-(3)), higher voltage with increased EG ratio raised electrolyte viscosity, leading to localized overcurrent, and increased surface roughness.
However, the mostly vertical contour lines in Fig. 6(1)–(3) suggest that voltage had a more dominant individual effect than a strong interaction between parameters.
In the case of the interaction between voltage and distilled water concentration (Fig. 6-(4)), a significant increase in surface roughness was observed with increasing voltage when the distilled water concentration was 16% or below. This was likely due to enhanced ion diffusion triggering excessive reactions. In contrast, when the distilled water concentration was 16% or higher, the dilution effect of the electrolyte reduced the sensitivity to voltage changes, resulting in a weakened interaction.
In the interaction between temperature and processing time (Fig. 6-(5)), it is generally expected that higher temperatures enhance ion mobility, while prolonged processing times can lead to surface damage due to extended reaction duration. However, in this investigation, under processing times exceeding 25 min, the formation of a passivation layer between the electrolyte and the titanium surface appeared to stabilize surface reactions, resulting in uniformly low surface roughness overall. However, the irregular contour patterns in the ANN analysis suggest the absence of a clear interaction.
The interaction between processing time and EG ratio (Fig. 6-(6)) revealed that the lowest surface roughness occurred at 25 min and EG ratio 3.0, likely due to appropriate viscosity and flow conditions. However, contour lines were irregular when EG ratio was too low or high, indicating no distinct interaction pattern.
In the interaction between processing time and distilled water concentration (Fig. 6-(7)), when the distilled water concentration was 14% or below, surface roughness tended to increase as the processing time increased, due to the excessive progression of the reaction. In contrast, at concentrations of 14% or higher, the effect of processing time was diminished due to electrolyte dilution, resulting in relatively flat contour patterns.
The interaction of temperature and EG ratio (Fig. 6-(8)) presented that at high temperatures (35–45 ℃), elevated EG ratio reduced viscosity and enhanced ion mobility, causing excessive reactions and increased roughness. The combination of 25–35 ℃ and EG 2.5 offered balanced viscosity and mobility, resulting in the lowest surface roughness.
In the interaction of temperature and distilled water (Fig. 6-(9)), high water concentrations (20–30%) diluted the electrolyte, stabilizing surface roughness. However, in the region indicated by the blue arrows, a linear decrease in surface roughness was observed as the temperature increased from 35 to 45 °C and the distilled water concentration decreased to 10% or below.
In the EG ratio and distilled water interaction (Fig. 6-(10)), when both were high, dilution offset their effects, limiting surface roughness change. But, when the distilled water concentration was maintained at 15% or below, the increased ion diffusivity led to a higher reaction rate, which in turn resulted in a tendency for surface roughness to increase. Specifically, as indicated by the red arrow, when the EG ratio increased from 2.0 to 3.0 and the distilled water concentration increased from 0 to 10%, the surface roughness increased. In contrast, as shown by the blue arrow, when the EG ratio increased from 3.0 to 4.0 and the distilled water concentration decreased from 10 to 0%, the surface roughness decreased. Therefore, it can be confirmed that the distilled water concentration of 10% or below has a significant effect on surface roughness.
In reducing surface roughness, advantageous strategies are to lower voltage (graphs 1–4) and pair a high voltage with a distilled water concentration of 0%. Correspondingly, the interaction analysis performed via the ANN revealed that the red dotted lines in graphs 4, 9 and 10 reflect interaction between these two factors. In particular, graph 4 presents a strong interaction based on the linear increase in surface roughness with rising concentration of added distilled water over the entire voltage range.
The results of Taguchi-based interaction analysis conducted by other researchers mostly reflect trends similar to those uncovered via the ANN modeling in the current work16. In particular, both analyses uncovered interactions between voltage and added distilled water. However, the Taguchi robust design generated ambiguous interactions between temperature and distilled water concentration as well as that between the choline chloride-to-ethylene glycol ratio and distilled water concentration within the detailed range. These differences are attributed to the dissimilarities in design and process between the two technologies. In the case of Taguchi robust design, only two to three levels of interaction are considered based on experiments involving orthogonal arrays. However, ANNs can be used to analyze interactions among multiple variables by modeling the complex nonlinear relationships between them. Accordingly, the contour plots generated from the ANN model—visualizing the interactions among voltage, ethylene glycol ratio, processing time, distilled water concentration and temperature—clearly reveal nonlinear interdependencies between variables that were difficult to capture using the conventional Taguchi method, thereby enabling deeper process interpretation and insight.
Table 4 presents the results of ANN predictions regarding the five smallest conditions that resulted in surface roughness exceeding 10 nm. It is practically impossible to achieve a surface roughness of 0 nm in various material processing methods, such as electropolishing. It is especially difficult to precisely control all factor conditions during electropolishing, wherein even small fluctuations can generate differences in surface roughness of tens of nanometers or more. Accordingly, we set the lower limit for surface roughness to 10 nm in this investigation. The first ANN-derived conditions in Table 4 are the optimized conditions for electropolishing, resulting in the smallest surface roughness. These conditions were a voltage of 20 V, a processing time of 21 min, a temperature of 42 °C, an electrolyte with a choline chloride-to-ethylene glycol ratio of 1:4 and a distilled water concentration of 0%. Under these conditions, the voltage and choline chloride-to-ethylene glycol ratio were the highest, and the concentration of added distilled water was the lowest. In conditions 2 to 5, voltage, processing time and temperature were relatively high, while the concentration of added distilled water remained consistently low. In summary, reducing surface roughness necessitates high voltage, processing time and temperature, along with a low concentration of added distilled water.
Comparison of Taguchi robust design and ANN after electropolishing
Figure 7 presents the results of the 3D image and 2D profile analyses of the surfaces of the specimens after electropolishing. These analyses were carried out via atomic force microscopy under the five optimal conditions (Table 4) derived through ANN modeling. Height was calculated as the difference between the highest peak and the lowest valley in the 2D profile. Small values of surface roughness and height indicate a smooth surface. Micallef et al. reported that when surface roughness is less than 50 nm after electropolishing, the microcrystal grain orientation on the surface of a material is uniform, resulting in a mirror-like specular reflection shape53. In the present examination, post-electropolishing surface roughness under conditions 1 to 5 was at the nanoscale, with all values below 20 nm. As a result, optical microscopic observations revealed that all the specimens had a mirror-like shape (Fig. 8). A mirror-like surface appears to regularly reflect and minimally scatter light. Accordingly, for cases 1 to 3 in Fig. 8, the dark tones in the images are ascribed to the uniform reflections caused by the very smooth and flat surfaces of the specimens.

Results of 3D images and 2D profiles after electropolishing for the five optimal conditions derived from ANN.

Surface appearance after electropolishing for the five optimal conditions derived from ANN.
As illustrated in Fig. 7, both surface roughness and height values increased from cases 1 to 5. In particular, cases 1 and 2 are relatively more uniform than cases 4 and 5 in the 2D profile. The surface roughness and height values of specimen 1 were the smallest at 4.162 and 22.596 nm, respectively, indicating that these are optimal electropolishing conditions. Voltage extensively influences surface roughness. Accordingly, large voltage fluctuations are thought to cause greater variations in surface roughness. In consideration of this issue, we deployed an ANN model, whose results led us to conclude that it is important to minimize voltage variability in keeping surface roughness at the nanoscale. On this basis, the ANN model was regarded as having calculated the voltage to be 20 V in all electropolishing conditions. This prompted the conclusion that the ANN optimized surface roughness by changing the remaining conditions.
Figure 9 compares the surface roughness predicted by the ANN and Taguchi analyses with the experimentally measured values obtained through electropolishing. When the ANN model was trained, these experimental data were excluded from the training or validation data. The ANN predictions somewhat differed from the experimental data, but this discrepancy was negligible, falling within the range of 12 to 59 nm. In addition, the overall trend of increasing surface roughness from conditions 1 to 5 was consistent with both the predicted and experimental results. These outcomes demonstrate that ANN modeling can effectively predict surface roughness and the trends characterizing its changes. Conversely, the results predicted by Taguchi robust design differed from the actual measurements by 142 to 172 nm, confirming that its prediction performance was inferior to that of the ANN model16. In particular, the trend of surface roughness changes in conditions 2 and 4 was inconsistent with the experimental data. Therefore, an ANN model can predict surface roughness with higher accuracy than Taguchi robust design.

Comparison of actual electropolishing roughness with predicted data using Taguchi and ANN. (Experimental data were not included in the training and verification data for ANN).
The scientific contribution of this investigation lies in the application of an artificial neural network (ANN)-based predictive model to the eco-friendly electropolishing process of titanium, thereby overcoming the limitations of conventional statistical methods. In particular, the ANN model effectively learns the nonlinear and multivariate interactions among process parameters, demonstrating its potential as a data-driven optimization tool that cannot be realized through the conventional Taguchi robust design.
The Taguchi method, while advantageous for analysis within a fixed experimental design, has limitations in predictive capabilities for unexplored regions outside the design space. By contrast, the ANN model can capture complex nonlinear relationships from the training data and maintain high predictive performance for new, untested process conditions.
In fact, the ANN model developed in this investigation achieved a high coefficient of determination (R² > 0.98), and reduced the root mean square error (RMSE) by over 80% compared to conventional Taguchi analysis. Moreover, the optimal process conditions predicted by the ANN model were experimentally validated, successfully achieving a nanoscale surface roughness (Ra < 20 nm), thus verifying the model’s effectiveness.
Furthermore, the ANN-based data-driven framework proposed in this investigation is not limited to electropolishing; it can be extended to other surface treatment processes such as anodizing and additive manufacturing, where nonlinear interactions among variables are also critical.
Conclusion
We analyzed variations in surface roughness during the electropolishing of titanium using ANN-based deep learning technology and compared the results with those obtained via Taguchi robust design.
-
(1)
For the ANN modeling, a structure comprising an input layer, two hidden layers and an output layer was selected. In particular, when the number of nodes in the hidden layers was 70, the MSE decreased to 0.032070, and the R2 improved to 0.984776. Accordingly, this was adopted as the optimal structure.
-
(2)
The verification of the ANN model did not provide a clear regression equation, but it generated accurate predictions of surface roughness variations due to electropolishing.
-
(3)
The interaction between the electropolishing factors could not be estimated in detail under Taguchi robust design, but the ANN model could comprehensively and reliably interpret these interaction effects.
-
(4)
The experimental design of the initial orthogonal array under Taguchi robust design was suitable for the dataset when ANN-based deep learning technology was applied.
-
(5)
The optimized electropolishing conditions derived using ANN were a voltage of 20 V, a processing time of 21 min, a temperature of 42℃, an electrolyte containing a choline chloride-to-ethylene glycol ratio of 1:4 and a distilled water concentration of 0%.
-
(6)
The surface roughness predicted using ANN and Taguchi robust design was compared with that generated after electropolishing during the experiments. ANN effectively predicted surface roughness and the trend typifying its changes with higher accuracy than Taguchi robust design.
Artificial neural networks are generally regarded as black-box models due to their opaque internal computations, which limit the intuitive interpretation of each variable’s influence. To overcome this limitation, future work will integrate explainable artificial intelligence (XAI) techniques, such as SHapley Additive exPlanations (SHAP) values and permutation importance analysis, to enhance the interpretability and reliability of the ANN model. Furthermore, the smooth electropolished surface achieved under the optimized conditions will be applied as a pretreatment base for subsequent coating processes, with the aim of improving corrosion resistance, adhesion and durability.
Due to the inherent opacity of their internal computations, artificial neural networks are typically considered black-box models, which poses limitations in intuitively interpreting the contribution of each input variable. To compensate this constraint, future studies will incorporate explainable artificial intelligence (XAI) methods, such as SHapley Additive exPlanations (SHAP) and permutation importance, to improve the interpretability of the ANN model. In addition, the electropolished surface obtained under the optimized conditions of this examination will be utilized as a pretreatment layer for follow-up coating processes, with the goal of enhancing corrosion resistance, interfacial adhesion and durability.
Data availability
All data generated or analyzed during this study are included in this published article.
References
Choi, Y. & Jeong, C. Nano-engineering of hybrid titanium oxide structure (TiO2) using Pore-widening concentration for enhanced superhydrophilicity. Corros. Sci. Technol. 23 (1), 41–53. https://doi.org/10.14773/CST.2024.23.1.41 (2024).
Heo, H. S. & Kim, S. J. Electrochemical characteristics of MMO(Ti/Ru)-Coated titanium in a cathode environment of polymer electrolyte membrane fuel cell. Corros. Sci. Technol. 21 (5), 340–347. https://doi.org/10.14773/CST.2022.21.5.340 (2022).
Hwang, H. K. & Kim, S. J. Identifying factors affecting surface roughness with electropolishing condition using full factorial design for UNS S31603. Corros. Sci. Technol. 21 (4), 314–324. https://doi.org/10.14773/CST.2022.21.4.314 (2022).
Han, W. & Fang, F. Fundamental aspects and recent developments in electropolishing. Int. J. Mach. Tools Manuf. 139, 1–23. https://doi.org/10.1016/j.ijmachtools.2019.01.001 (2019).
Hwang, H. K. & Kim, S. J. Optimization of electropolishing conditions with statistical and surface analyses using Taguchi method for austenitic stainless steel. Corros. Sci. Technol. 21 (5), 360–371 (2022).
Oh, Y. S., Seo, D. I. & Lee, J. B. Effect of delayed oxygen evolution in anodic polarization on the passive film characteristic and localized corrosion resistance of titanium alloys. Corros. Sci. Technol. 19 (3), 156–162. https://doi.org/10.14773/CST.2020.19.3.156 (2020).
Zhong, Z. W. Advanced polishing, grinding and finishing processes for various manufacturing applications: a review. Mater. Manuf. Processes. 35 (12), 1279–1303. https://doi.org/10.1080/10426914.2020.1772481 (2020).
Hwang, H. K. & Kim, S. J. Electrochemical properties of austenitic stainless steel with initial delay time and surface roughness in electropolishing solution. Corros. Sci. Technol. 21 (2), 158–169. https://doi.org/10.14773/CST.2022.21.2.158 (2022).
Zaki, S., Zhang, N. & Gilchrist, M. D. Electropolishing and shaping of micro-scale metallic features. Micromachines 13, 468. https://doi.org/10.3390/mi13030468 (2022).
Kityk, A. A., Protsenko, V. S., Danilov, F. I., Kun, O. V. & Korniy, S. A. Electropolishing of aluminium in a deep eutectic solvent. Surf. Coat. Technol. 375, 143–149. https://doi.org/10.1016/j.surfcoat.2019.07.018 (2019).
Hwang, H. K. & Kim, S. J. Investigation on the effective factor calculation of electropolishing using full factorial design and mechanism model by microscopic analysis for super austenitic stainless steel. Surfaces and Interfaces 37, 102730. https://doi.org/10.1016/j.surfin.2023.102730 (2023).
Hwang, H. K. & Kim, S. J. Optimization of electropolishing process using Taguchi robust design for UNS N08367 in a mixed solution of sulfuric acid and phosphoric acid. Coatings 13, 312. https://doi.org/10.3390/coatings13020312 (2023).
Karim, W. O. et al. Novel electropolishing of pure metallic titanium in choline Chloride-Based various organic solvents. Electrochemistry 89(1), 67–70. https://doi.org/10.5796/electrochemistry.20-00120 (2021).
Ferreri, N. C., Savage, D. J. & Knezevic, M. Non-acid, alcohol-based electropolishing enables high-quality electron backscatter diffraction characterization of titanium and its alloys: Application to pure Ti and Ti-6Al-4V. Materials Characterization 166, 110406. https://doi.org/10.1016/j.matchar.2020.110406 (2020).
Kim, D., Son, K., Sung, D., Kim, Y. & Chung, W. Effect of added ethanol in ethylene glycol–NaCl electrolyte on titanium electropolishing. Corros. Sci. 98, 494–499. https://doi.org/10.1016/j.corsci.2015.05.057 (2015).
Hwang, H. K. & Kim, S. J. Optimization of the electropolishing process of titanium using Taguchi robust design and surface analysis in an eco-friendly electrolyte. Applied Surface Science 686, 162092 https://doi.org/10.1016/j.apsusc.2024.162092 (2025).
Ali, M. A. et al. Enhancing high-speed EDM performance of hybrid aluminium matrix composite by genetic algorithm integrated neural network optimization. J. Mater. Res. Technol. 31, 4113–4127. https://doi.org/10.1016/j.jmrt.2024.07.077 (2024).
Farooq, M. U., Anwar, S. & Hurairah, A. Reducing micro-machining errors during electric discharge machining of titanium alloy using nonionic liquids. Mater. Manuf. Processes. 39 (4), 449–464. https://doi.org/10.1080/10426914.2023.2236199 (2023).
Farooq, M. U., Anwar, S., Ali, M. A. & Khan, A. Exploring wide-parametric range for tool electrode selection based on surface characterization and machining rate employing powder-mixed electric discharge machining process for Ti6Al4V ELI, Int. J. Adv. Manuf. Technol. 129, 2823–2841. https://doi.org/10.1007/s00170-023-12469-9 (2023).
Demirci, H. H. & Coulter, J. P. A comparative study of nonlinear optimization and Taguchi methods applied to the intelligent control of manufacturing processes. J. Intell. Manuf. 7, 23–38. https://doi.org/10.1007/BF00114136 (1996).
Yagiz, S., Sezer, E. A. & Gokceoglu, C. Artificial neural networks and nonlinear regression technologys to assess the influence of slake durability cycles on the prediction of uniaxial compressive strength and modulus of elasticity for carbonate rocks. Int. J. Numer. Anal. Methods Geomech. 36 (14), 1636-1650 (2011). https://doi.org/10.1002/nag.1066
Casanova, L., Gruarin, M., Pedeferri, M. & Ormellese, M. A comparison between corrosion performances of titanium grade 2 and 7 in strong reducing acids. Mater. Corros. 72, 1441–1572. https://doi.org/10.1002/maco.202112392 (2021).
Huynh, T. V. Orthogonal array experiment in systems engineering and architecting. Syst. Eng. 14, 208–222. https://doi.org/10.1002/sys.20172 (2011).
Lin, C. C. & Hu, C. C. Electropolishing of 304 stainless steel: surface roughness control using experimental design strategies and a summarized electropolishing model. Electrochimica Acta 53, 3356. https://doi.org/10.1016/j.electacta.2007.11.075 (2008).
Tyagi, P. et al. Roughness reduction of additively manufactured steel by electropolishing. Int. J. Adv. Manuf. Technol. 106, 1337–1344. https://doi.org/10.1007/s00170-019-04720-z (2020).
Alrbaey, K., Wimpenny, D. I., Al-Barzinjy, A. A. & Moroz, A. Electropolishing of re-melted SLM stainless steel 316L parts using deep eutectic solvents: 3 × 3 full factorial design. J. Mater. Eng. Perform. 25, 2836–2846. https://doi.org/10.1007/s11665-016-2140-2 (2016).
Yang, G. et al. Electropolishing of surfaces: theory and applications. Surf. Eng. 33, 149–166. https://doi.org/10.1080/02670844.2016.1198452 (2016).
Syahputra, M. K. et al. Optimization of process parameters in electropolishing of SS 316L utilizing Taguchi robust design. J. Manuf. Mater. Process. 9 (127). https://doi.org/10.3390/jmmp9040127 (2025).
Jeong, J. U. et al. Study of surface roughness change of AlSi10Mg based on selective laser melting (SLM) using electro-polishing technique. J. Mech. Sci. Technol. 38, 4579–4585. https://doi.org/10.1007/s12206-024-2412-y (2024).
López, M., Barriobero–Vila, J., Balcázar, F. & García–Guiñez, F. A. Castro–Guillén, Electropolishing stainless steel: optimization using surface quality, dimensional accuracy and electrical consumption criteria. Materials 16(5), 1770. https://doi.org/10.3390/ma16051770 (2023).
Sun, X. et al. Experimental investigation of electropolishing in ethylene glycol–NaCl electrolyte for surface integrity of Nitinol cardiovascular stents, Electrochemistry 88(4), 325–329. https://doi.org/10.5796/electrochemistry.20-00047 (2020).
Bhamare, S. S., Yadav, O. P. & Rathore, A. A hybrid quality loss Function–Based Multi-Objective design optimization approach. Qual. Eng. 21 (3), 277–289. https://doi.org/10.1080/08982110902762626 (2009).
Sharma, N. & Ragsdell, K. Quality loss Function - Common methodology for Nominal-The-Best, Smaller-The-Better, and Larger-The-Better cases. SAE Tech. Paper. 2007-01-0797 https://doi.org/10.4271/2007-01-0797 (2007).
Ahmad, M. W., Mourshed, M. & Rezgui, Y. Trees vs neurons: comparison between random forest and ANN for high-resolution prediction of Building energy consumption. Energy Build. 147, 77–89. https://doi.org/10.1016/j.enbuild.2017.04.038 (2017).
Shadkani, S. et al. Comparative study of multilayer perceptron-stochastic gradient descent and gradient boosted trees for predicting daily suspended sediment load: the case study of the Mississippi river, U.S. Int. J. Sedim. Res. 36 (4), 512–523. https://doi.org/10.1016/j.ijsrc.2020.10.001 (2021).
Horňas, J. et al. Modelling fatigue life prediction of additively manufactured Ti-6Al-4V samples using machine learning approach. Int. J. Fatigue. 169, 107483. https://doi.org/10.1016/j.ijfatigue.2022.107483 (2023).
Sana, M., Asad, M., Farooq, M. U., Anwar, S. & Talha, M. Sustainable electric discharge machining using alumina-mixed deionized water as dielectric: process modelling by artificial neural networks underpinning net-zero from industry. J. Clean. Prod. 441, 140926. https://doi.org/10.1016/j.jclepro.2024.140926 (2024).
Sana, M., Khan, A., Farooq, M. U. & Anwar, S. Artificial neural networks-based modelling of effects of cryogenic electrode treatment, nano-powder, and surfactant-mixed dielectrics on wear performance and dimensional errors on superalloy machining. J. Braz. Soc. Mech. 46, 539. https://doi.org/10.1007/s40430-024-05100-9 (2024).
Farooq, M. U., Ali, M. A., Anwar, S. & Khan, A. Process parameters optimization and performance analysis of micro-complex geometry machining on Ti6Al4V. Int. J. Interact. Des. Manuf. 18, 4573–4593. https://doi.org/10.1007/s12008-023-01711-z (2024).
Ye, Y. et al. Improving machine learning based phase and hardness prediction of high-entropy alloys by using Gaussian noise augmented data. Computational Materials Science, 223, 112140. https://doi.org/10.1016/j.commatsci.2023.112140 (2023).
Ma, J. et al. Review of image augmentation used in deep learning-based material microscopic image segmentation. Appl. Sci. 13, 6478. https://doi.org/10.3390/app13116478 (2023).
Wang, Q. et al. Interpretable machine learning excavates a low-alloyed magnesium alloy with strength-ductility synergy based on data augmentation and reconstruction. J. Magnes. Alloy. https://doi.org/10.1016/j.jma.2025.01.003 (2025).
Tollner, D., Wang, Z., Zöldy, M. & Török, Á. Demonstrating a new evaluation method on ReLU based Neural Networks for classification problems, Expert. Syst. Appl. 250, 123905. https://doi.org/10.1016/j.eswa.2024.123905 (2024).
Reyad, M., Sarhan, A. & Arafa, M. A modified Adam algorithm for deep neural network optimization. Neural Comput. Appl. 35, 17095–17112. https://doi.org/10.1007/s00521-023-08568-z (2023).
Mjalli, F. S., Al-Asheh, S. & Alfadala, H. E. Use of artificial neural network black-box modeling for the prediction of wastewater treatment plants performance, J. Environ. Manage. 83(3), 329–338. https://doi.org/10.1016/j.jenvman.2006.03.004 (2007).
Srivastava, N. Improving neural networks with dropout. Univ. Tor. 182 (566), 7 (2013).
Lachtermacher, G. & Fuller, J. D. Back propagation in time series forecasting. J. Forecast. 14, 381 https://doi.org/10.1002/for.3980140405 (1995).
Abayomi-Alli, O. O., Damaševičius, R., Qazi, A., Adedoyin-Olowe, M. & Misra, S. Data augmentation and deep learning methods in sound classification: a systematic review. Electronics 11, 3795. https://doi.org/10.3390/electronics11223795 (2022).
Mohamed, Z. E. Using the artificial neural networks for prediction and validating solar radiation. J. Egypt. Math. Soc. 27 (1), 1–13. https://doi.org/10.1186/s42787-019-0043-8 (2019).
Kim, H. S. et al. Regression analysis of high-temperature oxidation of Ni-based superalloys using artificial neural network. Corrosion Science 180, 109207. https://doi.org/10.1016/j.corsci.2020.109207 (2021).
Kazi, M. K., Eljack, F. & Mahdi, E. Predictive ANN models for varying filler content for cotton fiber/PVC composites based on experimental load displacement curves, Composite Structures 254, 112885. https://doi.org/10.1016/j.compstruct.2020.112885 (2020).
Jalal, F. E., Xu, Y., Iqbal, M., Javed, M. F. & Jamhiri, B. Predictive modeling of swell-strength of expansive soils using artificial intelligence approaches: ANN, ANFIS and GEP, J. Environ. Manage. 289, 112420. https://doi.org/10.1016/j.jenvman.2021.112420 (2021).
Micallef, C., Chiu, C. W., Zhuk, Y. & Aria, A. I. Rapid surface finishing of chemical vapour deposited tungsten carbide hard coatings by electropolishing. Surf. Coat. Technol. 428, 127900 https://doi.org/10.1016/j.surfcoat.2021.127900 (2021).
Acknowledgements
This research was a part of the project titled ‘Training Blue Tech Leaders for Eco-Friendly Ships (No. RS-2025-02220459)’, funded by the Ministry of Oceans and Fisheries, Korea.
Author information
Authors and Affiliations
Contributions
Hyun-Kyu Hwang: Conceptualization, Methodology, Investigation, Data curation, Validation, Writing-original draft. Seong-Jong Kim: Conceptualization, Investigation, Data curation, Validation, Formal analysis, Funding acquisition, Writing-Reviewing & Editing. All authors reviewed and approved the manuscript.
Corresponding author
Ethics declarations
Competing interests
The authors declare no competing interests.
Additional information
Publisher’s note
Springer Nature remains neutral with regard to jurisdictional claims in published maps and institutional affiliations.
Rights and permissions
Open Access This article is licensed under a Creative Commons Attribution-NonCommercial-NoDerivatives 4.0 International License, which permits any non-commercial use, sharing, distribution and reproduction in any medium or format, as long as you give appropriate credit to the original author(s) and the source, provide a link to the Creative Commons licence, and indicate if you modified the licensed material. You do not have permission under this licence to share adapted material derived from this article or parts of it. The images or other third party material in this article are included in the article’s Creative Commons licence, unless indicated otherwise in a credit line to the material. If material is not included in the article’s Creative Commons licence and your intended use is not permitted by statutory regulation or exceeds the permitted use, you will need to obtain permission directly from the copyright holder. To view a copy of this licence, visit http://creativecommons.org/licenses/by-nc-nd/4.0/.
About this article

Cite this article
Hwang, HK., Kim, SJ. Machine learning based optimization of titanium electropolishing using artificial neural networks and Taguchi design in eco-friendly electrolytes. Sci Rep 15, 28561 (2025). https://doi.org/10.1038/s41598-025-09416-x
Received:
Accepted:
Published:
Version of record:
DOI: https://doi.org/10.1038/s41598-025-09416-x
