
Abstract
Despite advancements in in vitro fertilization (IVF) over the past 30 years, its outcome effectiveness remains low (20–40%). This study introduces a microfluidic-based machine learning framework to improve predictive accuracy in oocyte quality assessment. Immature oocytes were recorded as they passed through a custom-designed microfluidic channel under controlled flow. Using image processing, two biomechanical features—Cortical Tension (CT) and Deformation Index (DI)—were extracted. Additionally, oocyte diameter and the critical flow rate (Q)—defined as the minimum flow rate necessary for an oocyte to pass through the channel—were included as predictive variables. A dataset of 54 oocytes was labeled based on maturation, fertilization, and cleavage outcomes. Supervised learning models (Random Forest, Decision Tree, K-Nearest Neighbors, eXtreme Gradient Boosting, Logistic Regression, Naive Bayes, Support Vector Machines, and Light Gradient Boosting Machine were evaluated. Random Forest achieved the best classification accuracy: 76.10% (K-Fold) and 75.93% (Leave-One-Out). For unsupervised learning, K-Means, DBSCAN, Agglomerative Clustering, and Gaussian Mixture Models were applied. Among them, Agglomerative Clustering yielded the best performance (Silhouette = 0.49, Davies–Bouldin = 0.73), showing meaningful grouping patterns among oocytes. These results demonstrate that integrating biomechanical profiling with machine learning can significantly improve the objectivity and accuracy of oocyte quality prediction. This approach holds promise for enhancing embryo selection strategies in Assisted Reproductive Technology (ART) and optimizing In Vitro Fertilization (IVF) outcomes.
Introduction
In recent decades, infertility treatment methods have advanced rapidly. According to reports, over 10 million children worldwide have been born using assisted reproductive techniques (ART)1. However, the global average success rate of ART in patients under 35 years old is about 31 percent, and for patients between 40 and 42 years old, it is about 11 percent. The overall global average for live birth or fetal product is approximately 23%2. Despite the high cost of treatment and the health risks to the mother, this success rate is considered low. In recent years, researchers have made significant efforts to find the best way to assess the quality of embryos and oocytes. Since the embryo is the result of sperm and oocyte fertilization, separately examining the quality of these two components can predict the quality of the resulting embryo. Therefore, achieving reliable methods to determine the quality of oocytes and sperm is crucial. In assisted reproductive technologies, the quality of human oocytes plays a vital role in the initial growth of the embryo and consequently has a profound impact on the success of assisted reproductive technology. Morphological methods were the first solutions that researchers used to evaluate oocyte quality. The morphological criteria that defined an ideal oocyte include: structure of the cumulus-corona complex, cytoplasmic appearance (especially color), cleavage patterns, extracellular structures such as the zona pellucida, the first polar body, and the perivitelline space. However, these methods are highly subjective and often yield inconsistent results. Their accuracy largely depends on the expertise of the embryologist, resulting in significant inter-observer variability. Additionally, morphological methods are highly dependent on the individual and the success rate largely depends on the skill of the embryologist, making it variable from one individual to another. Recently, researchers and engineers have attempted to assist embryologists by employing artificial intelligence (AI) to provide faster, more objective, and accurate evaluations of gamete and embryo quality.
AI techniques for oocyte evaluation and classification
AI is a branch of computer science that aims to understand the nature of intelligence and create a new type of intelligent machine that responds similarly to human intelligence. AI is rapidly advancing due to its extraordinary power in solving problems that are not easily solvable by humans or traditional computational structures. AI tools can process and analyze vast amounts of data in a short period. The adoption of AI techniques in fertility clinics has the potential to significantly improve the success rates of in vitro fertilization (IVF). For example, AI has the potential to assist embryologists in providing quick, objective, and accurate assessments of gamete and embryo health3,4,5,6,7,8. AI in this field can be transformative, removing human subjectivity from the decision-making process and objectively ranking gametes based on quality. AI methods currently applied for oocyte or embryo quality evaluation typically involve either analysis of static microscopic images using deep learning algorithms, or video-based analysis from time-lapse microscopy during the developmental process of the oocyte or embryo6,9,10,11,12.
Static microscopy and image processing
Image-based analyses are typically conducted on large datasets of pre-acquired microscopic images stored in standardized databases. The data used in these methods are usually pre-prepared, and researchers focus solely on developing AI algorithms. Recently, promising efforts have been made to use the potential of deep learning for predicting embryo selection potential. Mana et al.13 used convolutional neural networks for scoring oocytes and embryos (including 269 oocytes and 269 corresponding embryos from 104 women). Although their results were preliminary, their research showed an interesting classification of high-quality embryos. Miyagi et al.14 developed a machine learning-based system including logistic regression, naive Bayes, K-nearest neighbors, random forest, neural network, and support vector machine algorithms for predicting the probability of live birth from images of embryos at the blastocyst stage. Their dataset included 80 blastocyst images associated with live births and 80 images linked to aneuploid miscarriages. Among the tested models, logistic regression achieved the highest performance, with an accuracy of 0.65 and a sensitivity of 0.60. Additionally, Saeedi et al. proposed an algorithm for the automated classification of the two main components of the human blastocyst: trophectoderm (TE) and inner cell mass (ICM)15. Automatic identification of these features and their separation from each other is even challenging for an experienced embryologist. This research was tested on a set of 211 blastocyst images, showing 86.6% accuracy for TE identification and 91.3% for ICM identification. José et al. introduced a novel embryo analysis framework that combined genetic algorithms with artificial neural networks (ANNs), reporting an accuracy of 76.4%. In contrast, expert embryologists performing the same task achieved only 54.0% accuracy16.
In a large-scale study, Li et al.17 evaluated human embryos using four machine learning algorithms—random forest (RF), gradient boosting decision trees (GBDT), AdaBoost, and multilayer perceptron (MLP)—on a dataset of 45,921 embryo images sourced from the Human Fertilization and Embryology Authority (HFEA) database. The data were divided into two groups A and B based on the number of transferred embryos. Group A included 34,175 cycles with two transferred embryos, while group B included 11,746 cycles with only one transferred embryo, each containing 44 features and a predictive label (pregnancy). The results showed that the AdaBoost model had the best performance in group A, while the GBDT model was the best-performing model in group B. Itzaki et al. utilized support vector machine (SVM) and artificial neural network (ANN) algorithms to predict IVF outcomes (β-HCG, clinical pregnancies, live births, etc.)18. Raef et al. explored six machine learning approaches based on a dataset consisting of 82 features from IVF cycles for prediction, concluding that random forest (RF) was the best classification algorithm19. Furthermore, Khosravi et al.3 reported that using an AI-trained platform (on blastocyst images scored by experienced embryologists) could predict pregnancy chance with probabilities ranging from 13.8% to 66.3% depending on the blastocyst and predicted patient. More recently, VerMilyea et al. combined AI predictions with embryologist expertise, resulting in a 42% improvement over conventional evaluation methods20. Fjeldstad et al. developed a hybrid system comprising a segmentation model (accuracy = 0.63) and a deep learning model (accuracy = 0.64); when integrated, the combined model achieved an accuracy of 0.67 in predicting high-quality blastocysts from mature oocyte images21,22. These cumulative efforts underscore the growing role of AI in embryo assessment and prediction, and suggest that further advancements in this field are both promising and inevitable.
Dynamic microscopy and image processing
AI techniques leveraging time-lapse microscopy (TLM) enable objective and accurate classification and ranking of embryos based on dynamic developmental features. Furthermore, AI can analyze metabolic and secretion profiles of embryos during culture. Before the introduction of dynamic imaging technologies, all embryo evaluations were limited to specific features during the first 5 days of embryo development. It was evident that most of the developmental events in this time window were not recorded. TLM systems revealed that numerous key developmental events—such as cleavage timing and cavitation dynamics—were not observable in static images or were difficult to quantify23. This point has recently received a lot of attention from researchers as it appears to be associated with both metabolic activity and aneuploidy in embryos24. This method has shown great potential, as critical morphological events may occur during embryo growth that are not usually observable. Reports to date have shown that this method can be influential in embryo selection, and its effectiveness has been studied in various research studies25,26.
Giovanni et al.27 evaluated 230 pre-implantation human embryos using an artificial neural network. They placed the embryos under time-lapse observation for 44 h after sperm intracytoplasmic injection. Then, experimentally, they recorded the speed of cytoplasmic movement during the first 44 h of cultivation and used the speedometer algorithm to analyze the image particles for quantitative information. They used three main AI approaches, including K-Nearest Neighbors (KNN), long short-term memory (LSTM) neural network, and ensemble grouping classification, to classify the embryos. The results of their research showed 82.6% accuracy, 79.4% sensitivity, 85.7% specificity, 84.4% precision, and 81.8% F1 score. Tran et al. in 2019, for the first time, used time-lapse microscopy (TLM) and AI in human IVF28. Their method was based on deep learning and images captured by the TLM system of embryos developed to the blastocyst stage. In this study, researchers demonstrated that the likelihood of achieving clinical pregnancy could be predicted with high accuracy using machine learning algorithms. Dirvanauskas et al. used a convolutional neural network (CNN)-based method for classifying embryos using time-lapse imaging29. They employed various methods including KNN, decision tree, naive Bayes, discriminant analysis, and other combined methods. Ultimately, they succeeded in improving the accuracy from 96.58% to 97.62% using a combination of CNN and discriminant classification method, showing a 1.04% improvement.
Importance of innovative engineering methods for oocyte evaluation and classification
AI and machine learning (ML) have revolutionized various fields, including biology and reproductive medicine, by enabling sophisticated analysis of complex datasets. Recent studies in ART mostly have relied on morphological features and image processing to predict the success of oocyte maturation, fertilization, and embryo development. Despite employing AI, morphological classifications remain inadequate, with embryos failing to implant, even when categorized as high-quality based on morphology30. The morphological classification of oocytes cannot be deemed reliable or comprehensive for assessing oocyte quality. Furthermore, it has been shown that non-morphological characteristics can also be utilized to evaluate oocyte quality31,32. There is an urgent need for further advancements and innovative solutions in this area. Therefore, the main goal in this research is to identify a solution to increase the success rate in fertility assistance processes using engineering methods. In our previous work, we showed that the mechanical properties derived from microfluidic construction channels significantly influence the cellular fate during the growth stage33. Recently, Meyer et al. combined the biomechanical properties of mature oocytes, assessed using the Traditional Micro-pipette Aspiration Method (TMAM), with a supervised machine learning algorithm applied to video analysis. Their study aimed to determine whether these biomechanical properties could better predict usable blastocyst formation compared to traditional morphological assessments. Their model achieved an accuracy of 0.71, which was significantly higher than the performance of experienced embryologists in their study34. This suggests that integrating innovative techniques, such as biomechanical property assessment and machine learning algorithms, could enhance the outcomes of traditional stages of assisted reproductive technology (ART) and make them more practical. However, TMAM has a complex procedure that is neither fast nor fully automated, relying heavily on the operator’s performance and introducing further potential for errors. Additionally, they only examined SVM classification combined with mechanical properties.
In the current study, we propose a new approach aimed at developing a fully automated and simplified procedure to reduce experimental time. We employed a microfluidic-based aspiration technique to analyze the mechanical properties of immature germinal vesicle (GV) stage oocytes from videos, comparing the use of various AI-based algorithms. It is anticipated that this multi-dimensional approach will provide deeper insights into cell behavior and contribute to more precise predictions. The features analyzed in this research include Cell size, Cortical Tension (CT) value, Q value (the minimal flow rate at which an oocyte is able to pass through the channel), and Deformation Index (DI) value, with particular emphasis on integrating mechanical characteristics into the predictive framework. To achieve this, we utilized both classification and clustering algorithms. Classification methods such as Decision Tree, Random Forest, KNN, SVM, Naive Bayes, eXtreme Gradient Boosting (XGBoost), and Light Gradient Boosting Machine (LightGBM) were applied to the dataset. Leave-One-Out (LOO) Cross-Validation and k-fold Cross-Validation were employed to evaluate the performance of each model, ensuring robustness and reliability. In addition, clustering techniques like K-Means, DBSCAN, Agglomerative Clustering, and Gaussian Mixture Models were used to identify natural groupings among the data points. Custom algorithms were developed to compare and evaluate the performance of these clustering methods, providing a comprehensive view of the data’s structure. By combining mechanical and morphological data, this study marks a significant p forward in cell analysis and prediction in ART. The integration of non-morphological features is expected to lead to more accurate and reliable models, ultimately advancing the field of reproductive medicine. The following sections will discuss the methodology, results, and implications of this novel approach for improving ART outcomes.
Materials and methods
All methods were performed in accordance with the relevant guidelines and regulations. This study adhered to the ARRIVE guidelines and was approved by the Research Ethics Committees of Royan Institute, Academic Center for Education, Culture and Research in Tehran, Iran (IR.ACECR.ROYAN.REC.1400.108).
Device fabrication
We developed a microfluidic device for measuring oocyte hardness. Figure 1 schematically shows the proposed microfluidic channel for evaluating CT. This design consists of a main channel and a trap channel for trapping the oocyte. The trap channel is designed with a bottleneck to prevent damage to the oocyte. In our microfluidic device, the trapping mechanism is based on a carefully designed balance between the hydraulic resistance of the trap and main channels, as well as the geometric features of the trap entrance. When the trap is empty, its hydraulic resistance is slightly lower than that of the main channel. This configuration causes the oocyte to follow the path of least resistance and enter the trap channel instead of continuing along the main channel. Our previous simulations demonstrated that reliable trapping occurs when the resistance ratio (RTrap < RMain) is below approximately 1.133. The trap entrance is also tapered and dimensioned to match the average oocyte diameter, which helps guide the oocyte smoothly into the trap. As soon as the oocyte is trapped inside the channel, the resistance of this channel increases. As this channel becomes blocked, its flow gradually decreases to zero, and all the flow enters the main channel. In this case, the pressure applied to both ends of the oocyte is equal to the product of the inlet flow into the chip and the resistance of the main channel, P = RMain × QIN.

Depicts a schematic representation of the proposed microfluidic device.
Therefore, the oocyte will pass through the channel under a constant applied pressure. Once the oocyte exits the trap channel, the shear forces created by the channel walls are removed, and as a result, the oocyte gradually regains its initial shape. The channel height is uniformly set to 130 µm. A filter is embedded at the inlet and outlet of the designed device to prevent unwanted particles from entering the device. The resistances of the main and trap channels must be selected so that the oocyte is trapped. In this regard, the proposed microfluidic device has been simulated using the Finite Element Method (FEM) based on hyper-elastic models. There are various options for modeling the behavior of hyper-elastic materials, including Arruda Boyce, Mooney Rivlin, Neo Hooke, and Ogden. Here, the Neo Hooke model is used for hyper-elastic materials. The Kelvin-Voigt model is also used for viscoelastic modeling. The simulation process for trapping the oocyte in the microfluidic device was performed for a constant WTrap = 75um and a wide range of WMain from 60 to 150 µm. The simulation results showed that the oocyte is trapped when WMain < 140 um. Using this diagram, the desired geometric dimensions for trapping the oocyte have been selected. One notable point in the proposed device is to minimize the stress applied to the oocyte to prevent damage. In this study, oocyte trapping channels with two simple and hyperbolic structures were simulated under the same conditions, resulting in maximum stress values (VM) of 260 Pa and 640 Pa for the oocyte in the trapping channel, respectively. Therefore, simulations showed that less stress is applied to the oocyte during passage through the hyperbolic channel. Therefore, the inlet of the trapping channel was designed in a hyperbolic shape.
The proposed device was fabricated using polydimethylsiloxane (PDMS) layers on a glass slide using standard soft lithography. For this purpose, a 4-inch wafer was coated with 125 µm of SU-8 material (MicroChem, Newton, MA, USA). Then, the coated silicon wafer was placed at 65 °C for 15 min and then at 90 °C for 30 min. Afterward, the wafer was exposed to light with a mask placed on top of it. After this step, the wafer was placed inside the oven. Once the mold was created, PDMS (Sylgard 184) was poured onto it and placed in an oven at 60 °C for three hours. Then, the PDMS was peeled off the mold and bonded onto the glass slide using oxygen plasma.
Experimental setup
The experimental stages include obtaining the sample, maturation, fertilization, and examining the level of cellular division, which was fully performed by the embryologist at the Royan Institute’s embryology laboratory according to its protocols. At first, after dissection (a process in which oocytes are collected from the ovaries of adult NMRI mice from the Royan Institute), GV oocytes that appeared morphologically healthy were collected as the experimental samples. The experimental setup for this stage of the research is shown in the Fig. 2. A microfluidic channel was placed on a microscope, and the experiment was recorded using a high-speed camera. The samples, or immature oocytes, were injected into the device by a syringe pump, which accurately delivers fluid volumes from 0.001 µl per minute to 100 ml per minute. We calculated the CT in order to determine the mechanical properties of the oocytes. For this purpose, we needed to calculate the minimum flow rate at which an oocyte passes through the channel. Note that depending on the CT or size of the oocyte, the passage time through the channel can vary; therefore, to calculate the critical flow, initially, each oocyte was individually injected into the channel with a very low flow rate of about 0.05 µl per minute. The flow was then increased stepwise at intervals of 10 s. This time interval was to ensure whether the oocyte would pass through the channel at the applied flow rate or not. This process continued until ultimately, for a specific flow rate, the oocyte passed through the channel, and thus the critical flow for each oocyte was calculated.

The illustration of the experimental setup. The stages of the procedure are oocyte sample collection, maturation, fertilization, and cellular division. GV oocytes were collected from adult mice post-dissection. The oocytes were injected into a microfluidic channel system using a syringe pump to evaluate the size, and CT based on deformation and critical flow rate of the moving oocytes. After these assessments, immature oocytes were cultured and incubated. Subsequently, mature MII oocytes were fertilized with capacitated sperm and observed for up to five days, with results documented. This figure was generated by the authors for the purpose of this study.
After tests, all immature oocytes were placed in droplets of 20 µl from the culture medium containing αMEM (Gibco, USA), 0.01 IU/ml FSH (Merck, Germany), 7.5 IU/ml hCG, and 5% FBS, covered with oil (FertiPro, Belgium), and incubated for 15–18 h at 37 °C in an environment containing 5% CO2. Then, the oocytes with a visible polar body were identified as mature oocytes. A schematic of this stage is shown in Fig. 2. After that, MII oocytes identified as mature oocytes in the previous stage were placed in T6 modified Tyrode’s medium with 10% bovine serum albumin (BSA) and approximately 2 µl of mouse sperm35. It should be noted that sperm from adult NMRI male mice in T6 medium with 10% BSA had been capacitated for one hour beforehand. Then fertilized oocytes were individually placed in 30-µl drops of SAGE and their growth was monitored for up to 5 days. Finally, the status of the oocytes was reported as their fate. A schematic of all stage is demonstrated in Fig. 2.
Feature extraction
Images of the oocytes passing through the channel were recorded by a video camera mounted on the microscope. The recorded videos (which captured oocyte deformation inside the microfluidic channel at a rate of 30 frames per second) were converted into sequences of individual frames (601 × 901 pixels) for further processing and analysis. The deformation of each oocyte in each frame was recorded and evaluated separately. Three features, including oocyte size, CT, and the amount of deformation of the oocyte in critical flow (Fig. 3d), were extracted as experimental data using image processing methods. Additionally, the critical flow was recorded as input data during the experimental procedure, which was added to these features; thus, a total of 4 features were used as input data for the KNN method. A schematic of the measured parameters is shown in Fig. 3.

Schematic of the features measured in the experiment. Three features were obtained as experimental data through image processing techniques: oocyte size, Cortical tension, and deformation of the oocyte during critical flow. Furthermore, critical flow data was captured as input during the experimental process and incorporated with these features. This figure was generated by the authors for the purpose of this study.
As mentioned, the CT is calculated to assess the intrinsic hardness of the oocyte. For this purpose, the minimum flow rate at which the oocyte passes through the trapping channel must be calculated. In this case, the oocyte is modeled as a combination of two connected circles, where RA and RB are the radii of the front and rear curvature of the oocyte, respectively. Therefore, to use Eq. (2), the radii of these two circles must be determined. This was done by identifying the circles and measuring their radii from processed images (when they are at the threshold of passing through the trapping channel under critical flow injection) using image processing. After detecting the oocyte according to the explanations provided so far, the radii of the circles were determined. Given the specified sizes, the CT was ultimately calculated from Eq. (2). The critical flow rates for 54 oocytes are reported in Supplementary Table S1. Subsequently, based on the electrical model presented for the microfluidic channel, the pressure at the two ends of the channel was calculated using the equation ΔP = Q × RMain. Finally, the CT values were calculated, which will be discussed below.
The cross-sectional area of the microfluidic channel used is rectangular, while the cross-sectional area of the pipette used in the micropipette aspiration method is circular. Figure 3a shows oocyte before entering the trapping channel and also Fig. 3b shows an oocyte in the mouth of the trapping channel. Figure 3c show the size of the oocyte before entering the trapping channel. In addition, Fig. 3e illustrates the height and width of the rectangular cross-sectional area of the trap channel as HT and WT, respectively.
At RA = RH, CT can be calculated from the following equation:
where RA and RB represent the respective frontal and rear radii of curvature. ΔP is the critical pressure, calculated through the relationship ΔP = Q × RMain, where Q is the minimum flow rate at which the oocyte passes through the channel.
Biological evaluation of oocytes before and after experimental test
Various criteria were considered to evaluate oocyte viability and ensure no damage occurred during the oocyte passage through the channel. The first step in morphological evaluation was performed before experimentation and morphologically healthy oocytes were selected. For this purpose, any parts of the oocyte, including the cell structure, cytoplasmic morphology, and extra-cytoplasmic structures such as the zona pellucida and perivitelline space, were evaluated under a microscope.
After passing through the channel, oocytes were assessed to ensure their internal structure was undamaged. Transmission Electron Microscopy (TEM) was utilized to examine the ultrastructure of matured oocytes that had passed through the microfluidic channel and were then subjected to laboratory in vitro maturation (IVM). Matured oocytes were fixed using methods related to TEM. They were incubated in 1% agar gel and preserved in 2.5% glutaraldehyde until further processing. The prepared resin blocks were sectioned, and semi-thin sections were obtained. Subsequently, TEM grids were coated with ultrathin sections for examination under an electron microscope (obtained by TEM CM120, Netherland).
Supervised machine learning models and evaluation strategy
To evaluate the predictive potential of the extracted features (Cell Size, CT, Q value, and DI), we implemented a variety of supervised machine learning algorithms. The following models were trained and tested: Logistic Regression, Decision Tree, Random Forest, KNN, SVM, Naive Bayes, XGBoost, and LightGBM. The models were developed using the scikit-learn, XGBoost, and LightGBM libraries in Python. For evaluation, we employed LOO Cross-Validation and k-Fold Cross-Validation (k = 7) to ensure the robustness and generalizability of the models. The evaluation metric reported in this study was accuracy, which reflects the proportion of correctly predicted instances over the total number of predictions. The detailed hyperparameter settings for each model are provided in Supplementary Table S2.
Unsupervised machine learning and clustering algorithms
To explore natural groupings within the dataset and discover potential sub-populations among the oocytes, we applied several unsupervised clustering algorithms, including: K-Means Clustering, Density-Based Spatial Clustering of Applications with Noise (DBSCAN), Agglomerative Hierarchical Clustering and Gaussian Mixture Models (GMM). These models were implemented using the scikit-learn library. The input dataset included the same four extracted features as in the classification task. All features were standardized using z-score normalization prior to clustering. All features were standardized using z-score normalization before clustering. The clustering performance was evaluated using the following metrics: Silhouette Score, Davies–Bouldin Score, Calinski–Harabasz Score and Adjusted Rand Index (ARI). These scores provided quantitative insight into the compactness, separation, and cluster agreement of different algorithms. The list of unsupervised machine learning algorithms and their main parameters is provided in Supplementary Table S3.
Results and discussion
The experimental test was carried out for 54 immature oocytes. At first, each oocyte was individually injected into the channel with a very low flow rate of about 0.05 µl per minute. The flow was then increased stepwise at intervals of 10 s. This time interval was to ensure whether the oocyte would pass through the channel at the applied flow rate or not. This process continued until ultimately, for a specific flow rate, the oocyte passed through the channel, and thus the critical flow for each oocyte was calculated.
Oocyte size is one of the parameters that can be analyzed as a characteristic in evaluating the oocyte. It should be noted that the size should be processed from the images of the oocyte before entering the trap channel (where the oocyte is almost spherical). For this purpose, the image was cropped so that only the desired cell remained in the frame. In the case of high-volume images, for example, when it is intended to process all the recorded images from the video, this is important because larger images require more processing time. Then, the center of the oocyte was identified in the binary image. In the next step, the number of pixels in the horizontal and vertical directions in the binary image was counted. After measuring the length (LO) and width of the oocyte (WO), the size of the oocyte is presented as the average of these two parameters as follows:
The value of oocyte deformation is one of the parameters extracted in this study as a characteristic feature of the oocyte when subjected to critical flow conditions within the entrapment channel. A binary image of the oocyte at the threshold of entering the trap channel under critical flow (similar to the position considered for measuring surface stress) is used to measure this parameter. An image of the oocyte at the threshold of entering the channel under critical flow, along with its maximum length and maximum width, is depicted in Fig. 3g.
Therefore, based on the Fig. 3e, the deformability index (DI) is calculated as follows:
Furthermore, after proceeding with the biological experiments, the GV, MII, Zygote, and Cleaved Embryo stages were recorded as the fate of the development of oocytes in Supplementary Table S1. Also, the CT values for 54 oocytes at the GV stage are reported in Supplementary Table S1. Additionally, this table illustrates the critical pressure levels for various samples. It should also be noted that the oocyte’s passage speed remains nearly constant during its transit through the channel; thus, it can be assumed that the oocyte is trapped in a stable state during its passage through the channel (in terms of mechanical equilibrium—due to zero acceleration. Considering the above discussions, the features of size, CT, critical flow, and DI were measured for 54 immature oocytes at the GV stage.
Statistical analysis
This section focuses on the statistical analysis of the experimental data obtained from the study. As evident from Fig. 4a, the maturation rate in the experimental samples was 72%, indicating that a substantial majority of the collected immature GV oocytes were capable of progressing to the MII stage under the applied in vitro conditions. This maturation capability is a crucial indicator of oocyte developmental competence. Additionally, the fertilization rate was approximately 85%, suggesting that a high proportion of the matured oocytes retained functional integrity and were receptive to sperm penetration and subsequent zygote formation. Finally, 79% of the successfully fertilized oocytes reached the cleavage embryo stage, which signifies further embryonic development and is often considered a positive prognostic marker in assisted reproduction. Collectively, these developmental milestones reflect the biological relevance of the mechanical features studied in this work, validating their potential as predictors of oocyte quality and developmental fate.

(a) Maturation, Fertilization, and cleavage embryo stage. (b) The correlation between different features was analyzed using a Correlation Matrix and a Heatmap. (c–f) Distribution of key features including (c) Cell size, (d) CT, (e) Q, and (f) DI values. The histogram of cell size shows a concentration in the range of 105–115, indicating that most cells fall within this size range. The CT value distribution is primarily concentrated between 1 and 4, but with a wider spread for higher values. The Q value shows an asymmetrical distribution with a concentration around 0.1–0.5, suggesting low Q values for most cells. Finally, the DI distribution is focused between 1.2 and 1.3, implying relative consistency in this feature across the dataset.
Also, to analyze the data related to the evaluated cells, we employed both statistical and graphical methods to gain a deeper understanding of the key features. This analysis included examining the distribution of the data and investigating the correlation between variables. Initially, we assessed the distribution of four main features—Cell size, CT, Q, and DI values by utilizing histograms. These histograms provided us with valuable insights into the distribution patterns of each feature.
Figure 4b illustrates the histograms representing the distribution of four key features: Cell size, CT, Q, and DI. In general, a strong correlation between features indicates a direct relationship, meaning that an increase in one feature corresponds to a rise or decline in another. For instance, CT and Q have a very strong and direct correlation with a coefficient of 0.9, demonstrating a close relationship between the two. On the other hand, CT and DI show a significant negative correlation (-0.74), suggesting that an increase in CT leads to a decrease in DI. These correlation relationships highlight that some parameters have a greater influence on predicting cell categorization. For example, the strong correlation between CT and Q may play an essential role in predictive models, as a change in one is likely to lead to a similar shift in the other. Consequently, correlation analysis enhances the accuracy of predictive models and identifies which features are more relevant for future evaluations or machine learning models. In the next step, we analyzed the distribution of key features, including (Fig. 4c) Cell size, (Fig. 4d) CT, (Fig. 4e) Q, and (Fig. 4f) DI values. As shown in the figures, the Cell size feature exhibits a distribution concentrated within the 105 to 115 range, indicating that most cells fall within this size bracket. The CT values are primarily clustered between 1 and 4, though the distribution is skewed, with more scattered data points at higher values. Similarly, the Q feature exhibits a skewed distribution, with values concentrated between 0.1 and 0.5, suggesting that most cells have a low Q value. Lastly, the DI feature is concentrated between 1.2 and 1.3, indicating a relative uniformity in this feature across most cells. These distributions help us identify the overall behavior of the features and their potential impact on subsequent predictive models. The analysis of feature distribution and correlation provided valuable insights into the behavior and relationships among the various cell features. This information can aid in identifying hidden patterns within the data and contribute to better cell classification based on specific characteristics. Furthermore, the presence of correlations between features can serve as a guide for designing future experiments or refining predictive models.
Image processing
This section includes four steps, which are outlined below:
Local thresholding in images
In the first step, local thresholding method has been employed for oocyte identification. For example, consider the Fig. 5a as the initial input. Figure 5b shows the output image of this step. As can be seen from this figure, the edges of the oocyte and the channel walls are determined in this image.

Image processing steps. (a) A frame of oocyte on the verge of entering the trap channel. (b) Local thresholding stage in image processing. (c) Hole filling stage. The salt noise filter is applied at this stage. (d) Background image when no oocyte has entered the channel. (e) Stage of removing intersecting lines and background removal. In this image, the lines related to the channel have been removed. (f) Binary image of the detected oocyte after smoothing.
Filling holes
As depicted in Fig. 5b the oocyte in the previous stage was identified as hollow. In this step, to detect oocytes, the image was first binarized using the im2bw function with a threshold rate of 0.2, and then all the holes and closed curves were filled using the imfill (IMAGE2,‘holes’) function. In this stage, objects with an area smaller than 100 pixels were considered as noise and removed from the image (note that the area of the oocytes was greater than 300). For example, if the output of the image from the previous stage is used as the input of this stage, the result will be as shown in Fig. 5c. As is observed, the oocyte along with the remaining lines from the channel are clearly delineated. Moreover, all the noise has been removed from the image, leaving only the oocyte and the channel edges.
Removing intersecting lines and background image
As evident in the Fig. 5c, besides the oocyte, lines from the channel, mostly perpendicular or horizontal, connected to the oocyte remained. In this step, these lines were removed. Using the imclearborder (newImg, 18) function in MATLAB, any object connected to the edge of the image could be removed. In this stage, the background image was also removed by subtracting the images from the channel (when no oocyte had entered it). The background image and the output image are shown in Fig. 5d and e, respectively.
Smoothing the oocyte surface
As seen in Fig. 5f, the oocyte surface appeared uneven. To improve the clarity of the detected image and make it more similar to the oocyte image, the edges of the images were smoothed using the strel (‘disk’, 2, 8) function. Now this image is ready for extracting the required information.
Analysis and prediction of cell behavior using machine learning algorithms
In this study, both classification and clustering techniques were utilized to categorize and predict cell behavior based on various features. In the initial phase, we applied several classification algorithms, including Decision Tree, Random Forest, KNN, SVM, Naive Bayes, logistic Regression, XGBoost, and LightGBM, to the dataset. These methods were chosen for their strong performance in handling complex and nonlinear relationships within data. To evaluate the effectiveness of each classification method, we employed two validation techniques: LOO Cross-Validation and k-fold Cross-Validation. These methods allowed us to assess the accuracy and robustness of the models, helping us determine which algorithm produced the best predictive results for our dataset. The following sections provide a detailed analysis of the results obtained from both the classification and clustering methods, along with a discussion on their implications for cell categorization and prediction.
Phase I: classification algorithm
In the first phase, we focus on the implementation of various classification algorithms to analyze the mechanical properties of oocytes and their impact on cellular categorization. The objective is to leverage machine learning techniques to accurately classify oocytes based on their features, such as size, CT, and deformation under critical flow conditions. To achieve this, we employed several popular classification algorithms, including Random Forest, KNN, and XGBoost. These algorithms were chosen for their ability to handle complex datasets and their proven effectiveness in various classification tasks. The performance of each algorithm was evaluated through robust cross-validation methods, specifically K-fold and LOO validation, to ensure the reliability and generalizability of the results. The analysis begins with an examination of the correlation between key features, identifying significant relationships that may influence the classification outcomes. By training the algorithms on our dataset, we aimed to determine the most accurate model for predicting oocyte fate. This phase is crucial for establishing a foundation for subsequent analyses, where the insights gained will inform the understanding of oocyte behavior and enhance IVF outcomes. Overall, the implementation of classification algorithms in this phase highlights the potential of machine learning in improving the precision of oocyte assessments, ultimately contributing to advancements in reproductive technology.
Figure 6a illustrates a comparison of K-fold and LOO cross-validation results for classification algorithms. As shown in Fig. 6a (Left), in K-fold cross-validation, Random Forest achieves the highest accuracy at 75.96%, followed closely by KNN at 74.04%. Naive Bayes performs well with 70.19%, while SVM and Logistic Regression score 66.62% each. XGBoost achieves 68.41%, while Decision Tree lags at 64.56%. LightGBM has the lowest accuracy at 55.49%. This indicates that ensemble methods like Random Forest and KNN perform consistently well when trained on larger subsets of the data, whereas LightGBM struggles. Also, as shown in Fig. 6a (Right), in LOO cross-validation, KNN, Random Forest, and XGBoost all achieve the highest accuracy at 68.52%, showing a balanced performance. Naive Bayes follows closely at 66.67%, and Logistic Regression achieves 64.81%. SVM and Decision Tree perform similarly at 59.26%, and LightGBM shows a moderate improvement to 61.11%. The ensemble methods and Naive Bayes perform better in this setup, as they generalize well from the smaller data points used for training in LOO. Therefore, K-fold cross-validation favors Random Forest and KNN, which demonstrate strong performance when trained on larger portions of the dataset. In contrast, LOO validation highlights the strengths of ensemble methods like XGBoost and Random Forest, as these models adapt effectively to smaller training data points. LightGBM struggles in K-fold cross-validation but shows slight improvement in LOO, indicating its sensitivity to data partitioning. Given that Random Forest yielded the best results in our evaluation, we used this method to analyze the impact of different parameters. When comparing the Random Forest results using K-fold and LOO cross-validation, several insights emerged regarding the algorithm’s behavior and the importance of various features. The classification accuracy of the Random Forest algorithm based on different parameter combinations is presented in Fig. 6b. This figure demonstrates the accuracy rates achieved using both K-Fold and LOO validation methods. Notably, the combination of CT, Q value, and DI value achieves the highest accuracy of 76.10% in K-Fold validation, indicating the significant impact of these parameters on the model’s performance. We will now highlight these insights in the following:

(a) Comparison of K-fold and LOO Cross-Validation Results for Classification Algorithms. The chart illustrates the performance of various classification algorithms, including Random Forest, KNN, Decision Tree, SVM, Logistic Regression, Naive Bayes, XGBoost, and LightGBM. Results are displayed for two validation methods: (a) K-fold and (b) LOO. The accuracy varies across methods, with Random Forest and KNN performing best in K-fold, while ensemble models like XGBoost excel in LOO. LightGBM shows significant improvement in LOO compared to K-fold, where it performed the weakest. (b) Accuracy of Random Forest Classification Using K-Fold and LOO Validation. This chart illustrates the classification accuracy of the Random Forest algorithm based on various parameter combinations, evaluated using K-Fold and LOO methods. The combination of CT, Q, and DI yields the highest accuracy of 76.10% in K-Fold validation, showcasing the effectiveness of these features in enhancing classification performance.
Highest accuracy: In K-fold, the highest accuracy (76.10%) is achieved using the combination of “CT, Q, and DI.” In LOO, however, the highest accuracy (75.93%) is obtained with just "CT and DI." This suggests that in K-fold, the “Q” feature adds value to the model’s performance, whereas in LOO, “Q” does not significantly enhance the model, and “CT and DI” alone are sufficient for optimal results.
Sensitivity to feature combinations: In K-fold, the inclusion of all parameters (Cell size, CT, Q, and DI) leads to an accuracy of 75.96%, slightly lower than using “CT, Q, and DI.” This suggests that in K-fold, adding “Cell size” can slightly dilute the performance. However, in LOO, using all four parameters leads to an accuracy of 68.52%, equal to several other combinations (e.g., “CT, Q, and DI” and “Cell size, CT, and DI”). This indicates that LOO is less sensitive to the number of parameters and more dependent on specific key features, such as “CT and DI.”
Performance drop with fewer features: In both K-fold and LOO, removing certain key parameters significantly impacts the model’s accuracy. For example, in K-fold, using only “CT and Q” results in an accuracy of 57.55%, while in LOO, the same combination drops even further to 48.15%. Similarly, “CT alone” yields weak results in both K-fold (57.55%) and LOO (46.30%). This suggests that “CT” is not a strong standalone feature in either validation method and requires the presence of “DI” for better performance.
Importance of the “DI” parameter: In both validation methods, the “DI” parameter plays a crucial role in improving accuracy. In K-fold, “DI” alone gives a relatively high accuracy of 66.48%, while in LOO, it also performs well with 66.67%. Additionally, “CT and DI” combinations show strong performance in both K-fold (68.54%) and LOO (75.93%). This consistency highlights “DI” as a critical feature across different cross-validation strategies.
Sensitivity of LOO to smaller feature sets: LOO tends to show more drastic fluctuations in accuracy when fewer parameters are used. For example, when only “Cell size and CT” are used, K-fold yields 62.77%, but LOO results in just 57.41%. This indicates that LOO is more sensitive to the loss of key features, particularly when the dataset is partitioned into very small training sets (as happens in LOO).
Therefore, “CT and DI” are crucial in both methods, but K-fold benefits more from additional features like “Q,” whereas LOO relies more on a few strong features. LOO is more sensitive to feature combinations and individual feature performance, as it works with fewer training data points at a time. K-fold generally shows more stable performance across different feature combinations, while LOO exhibits greater variability, with a steeper decline in accuracy when weaker features are used. In conclusion, while both methods highlight the importance of feature selection, LOO demonstrates a greater sensitivity to key features like “DI” and shows less improvement with the inclusion of secondary features like “Cell size” and “Q” compared to K-fold. The bar charts in Fig. 5b (both K-Fold and LOO CV) demonstrate how different combinations of CT and Q affect classification accuracy. For instance, the combination of CT, Q, and DI yields the highest K-Fold accuracy (76.1%), indicating that Q contributes complementary information despite its correlation with CT. Conversely, using CT or Q alone leads to slightly lower accuracy. These results suggest that while CT and Q are strongly correlated, their joint inclusion, particularly when combined with features like DI, enhances the model’s performance.
Phase II: clustering algorithm implementation
In the second phase of the analysis, we focused on clustering techniques to group similar data points. The clustering algorithms used were K-Means, DBSCAN, Agglomerative Clustering, and Gaussian Mixture Models. Each of these algorithms offered a unique perspective on the structure of the data and helped in identifying natural groupings among the samples. This comprehensive approach enabled us to understand the patterns and relationships within the data more effectively, guiding us toward more accurate predictive models for future work.
Supplementary Fig. S1 presents the results of clustering analysis using four different algorithms: K-Means, DBSCAN, Agglomerative Clustering, and Gaussian Mixture. The data points represent cell size and CT, which are the key features used in this analysis. Blue points indicate correctly clustered data, while gray points represent misclassified instances. K-Means, a widely used algorithm for clustering, shows some success in assigning correct clusters but also has several misclassifications. DBSCAN performed poorly in this study, struggling to correctly cluster the data and leading to a higher rate of misclassifications compared to other methods. Agglomerative Clustering, a hierarchical method, performs relatively better than K-Means and DBSCAN, with fewer misclassifications and a more accurate identification of clusters. The Gaussian Mixture algorithm, based on probabilistic models, also demonstrates good clustering accuracy but still exhibits some degree of error. Overall, this visual comparison of clustering performance aids in determining which algorithm best categorizes the oocyte data.
In evaluating the clustering performance of different algorithms, we utilized four key metrics: Silhouette Score, Davies–Bouldin Score, Calinski–Harabasz Score, and Adjusted Rand Index (ARI). Silhouette Score ranges from − 1 to 1, where values closer to 1 indicate well-clustered data, 0 indicates overlapping clusters, and negative values suggest incorrect clustering. Davies–Bouldin Score is non-negative and lower values indicate better clustering, with 0 representing perfectly separated clusters. Calinski–Harabasz Score has no fixed upper bound, and higher values indicate better-defined and more separated clusters. Adjusted Rand Index (ARI) ranges from -1 to 1, with 1 representing perfect agreement with ground truth, 0 indicating random labeling, and negative values suggesting worse-than-random clustering.
These metrics provide comprehensive insights into the quality of the clusters formed by each algorithm. Table 1 presents the performance comparison of the four clustering algorithms—K-Means, DBSCAN, Agglomerative Clustering, and Gaussian Mixture Models—across various evaluation metrics, including Silhouette Score, Davies–Bouldin Score, Calinski–Harabasz Score, and Adjusted Rand Index (ARI). This table provides a detailed overview of each algorithm’s ability to form well-defined clusters.
Among the algorithms, Agglomerative Clustering consistently outperformed others across multiple metrics. It achieved the highest Silhouette Score of 0.49, indicating well-separated clusters, and the lowest Davies–Bouldin Score of 0.73, signifying compact and distinct groupings. Its performance on the Calinski–Harabasz Score was also strong, with a value of 41.18, reflecting a good balance between cluster cohesion and separation. K-Means also demonstrated competitive performance, particularly excelling in the Calinski–Harabasz Score, where it achieved the highest value of 42.88. Additionally, K-Means performed well in the Silhouette Score (0.46) and Davies–Bouldin Score (0.88), showcasing its ability to form relatively distinct and well-separated clusters. However, it lagged slightly behind Agglomerative Clustering in these two metrics. The Adjusted Rand Index (ARI) further highlighted K-Means as the best performer with a score of 0.18, suggesting reasonable alignment between the predicted clusters and the true labels. Gaussian Mixture Models showed results comparable to K-Means in most metrics, achieving a Silhouette Score of 0.46, a Davies–Bouldin Score of 0.90, and a Calinski–Harabasz Score of 41.97. While its performance was solid, it did not significantly outperform either K-Means or Agglomerative Clustering. In contrast, DBSCAN struggled across all metrics. It produced a negative Silhouette Score (− 0.13) and a high Davies–Bouldin Score (1.8), indicating poorly defined clusters. Additionally, DBSCAN’s performance in the Calinski–Harabasz Score (1.54) and ARI (− 0.01) was notably low, suggesting that it failed to identify meaningful patterns in the dataset.
Overall, the analysis highlights Agglomerative Clustering and K-Means as the most effective methods for this dataset, with Agglomerative Clustering slightly edging out in cluster separation, while K-Means shows stronger performance in forming compact clusters and aligning with true labels. DBSCAN, on the other hand, is not well-suited for this clustering task, given its poor performance across all evaluation metrics. These results provide important insights for selecting appropriate clustering techniques in future analyses and predictive modeling efforts.
Although the focus of this study is biomechanical classification, preliminary tracking suggests that oocytes flagged as high-quality by the model tend to achieve higher fertilization and cleavage rates. A comprehensive statistical analysis linking these predictions to downstream embryonic and implantation outcomes is currently being planned and will be addressed in future work.
Assessment of method’s non-destructiveness via oocyte ultrastructure
The images related to this section are shown in Fig. 7A–F. This examination indicated that the cytoplasm of the oocytes remained intact, with uniformity preserved, and no signs of vacuolization were observed. The mitochondria were in a healthy state, with consistent sizes next to each other and interacting with other organelles. Cristae were uniform and regular, displaying the appearance of a healthy mitochondrion. The rough endoplasmic reticulum was well-visible in the cytoplasm, maintaining its connection with other intracytoplasmic components. Cortical granules (CG) were significantly produced in mature oocytes, accumulated beneath the oolemma. The oolemma remained relatively intact, and its microvilli were well-defined in the sub-zonal space. The sub-zonal space around the oocyte was uniform, with only minimal expansion observed in very limited areas. The zona pellucida section indicated its complete health, with its uniformity remaining untouched.
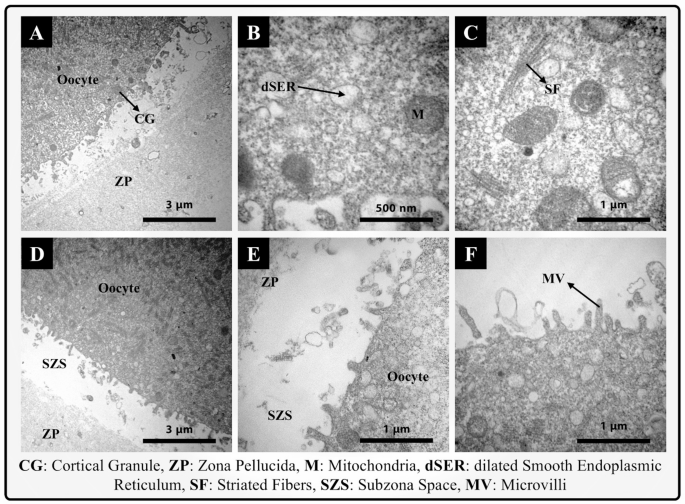
The assessment of the ultrastructure of an experimental oocyte after passing through the fabricated microfluidic chip.
Comparison of methods
While the integration of AI with dynamic imaging methods has recently achieved successes in selecting high-quality oocytes or embryos, all these evaluation models, whether static or dynamic, rely on large-scale morphological features of oocytes and embryos such as pronuclear position, cell number, fragmentation degree, blastocoel expansion rate, and the timing of specific events (cleavage, compaction, blastocoel formation initiation). This reliance leads to the complete disregard of other intracellular characteristics that are not visible with a conventional microscope. Also, dynamic imaging methods based on time-lapse microscopes are very time-consuming and expensive. To evaluate each oocyte, a full-time time-lapse imaging system needs to be dedicated solely to evaluating one oocyte. Moreover, these methods usually focus on evaluating embryos and have not been able to establish a relationship between oocyte quality and success in the IVF process. While evaluating oocytes in the early stages can significantly reduce ancillary costs such as maintenance, fertilization, and cultivation.
It has been proven that measuring the deformation of oocytes can provide insights into fundamental cellular processes such as migration, division, and signaling. The mechanical properties of cells are evaluated by measuring and analyzing the deformation of cells (oocyte resistance to deformation) when subjected to mechanical forces. In fact, evaluating the mechanical properties of cells requires describing the deformation of cells in response to mechanical forces over time, which can be described by the theory of stress and strain. Various parameters (such as Young’s modulus and CT) can be measured to calculate the mechanical properties of cells. To provide a more objective comparison, Table 2 summarizes key characteristics of three approaches used in oocyte and embryo assessment: static image-based AI methods, time-lapse microscopy (TLM)-based dynamic analysis, and our proposed microfluidic-AI integrated method. Unlike static microscopy, which relies solely on 2D morphological features such as solidity or circularity, and TLM which tracks developmental timepoints (e.g., time to polar body appearance), our method extracts mechanical features such as CT and DI during microfluidic passage. In terms of predictive performance, static AI methods such as those in Fjeldstad et al.21 report AUC values around 0.67, while TLM-based systems (Kalyani et al.36) have achieved classification accuracy up to 93% (sensitivity = 97%, specificity = 77%). Our method yields 76.1% accuracy (K-Fold CV) and 75.9% accuracy (LOO CV), with a minimal training dataset of just 54 oocytes. Importantly, while TLM systems require high-cost equipment (~ 100,000 USD), our method achieves real-time mechanical assessment using a low-cost microfluidic setup (~ 5,000 USD), comparable to static image systems. Additionally, it offers rapid analysis (~ 2 min per oocyte) without requiring long-term culture or multi-frame labeling.
These results support the practical superiority of our method in terms of cost-efficiency, speed, and reduced data requirements, while maintaining competitive classification accuracy compared to existing advanced techniques.”
In recent years, various methods have been used to evaluate the mechanical properties of oocytes, including the TMAM, atomic force microscopy, and microelectromechanical systems. In this study, a microfluidic channel was used to evaluate the mechanical properties of oocytes. Microfluidics, due to features such as rapid sample processing and precise flow control, can potentially serve as an alternative to conventional experimental methods.
In TMAM, measuring pressure is a difficult and complex process. We propose a simpler and more accurate process for measuring oocyte hardness using a microfluidic device. The oocyte trapping method in the proposed microfluidic device, using a hydrodynamic mechanism, is faster and more accurate compared to traditional methods, and significantly reduces human intervention.
Supplementary Fig. S2a illustrates the TMAM. The operation mechanism of this method is that initially, under the influence of a suction pressure, the cell is partially pulled into the micro-pipette. By applying pressure, the fluid level is displaced. By measuring this displacement, the fluid pressure is ultimately calculated through the equation P = ρgh. Any vibration or evaporation from the fluid surface can cause measurement errors. Additionally, this method requires high-quality equipment and technical skills. To the contrary, Supplementary Fig. S2b shows our proposed method. Based on the provided explanations, the pressure measurement process in this method is simpler. Unlike the TMAM, it does not require complex equipment. Additionally, there are no errors related to liquid surface evaporation and vibration, resulting in higher measurement accuracy. The measurement time in this method is less than five minutes, which is shorter compared to TMAM. Furthermore, the applied stress in this method is less than that in TMAM.
Conclusion
This study introduced a novel approach to predicting the fate of oocytes in assisted reproductive technologies ART by integrating mechanical properties alongside morphological features. The inclusion of mechanical data, obtained through a microfluidic chip, could provide a deeper understanding of cell behavior. Our analysis revealed that mechanical characteristics such as CT, Q value, and DI play a critical role in improving the predictive models for oocyte and embryo development. Through both K-fold and LOO cross-validation, it was found that the combination of CT, Q, and DI provided the highest accuracy, with Random Forest achieving the best overall results. The importance of specific features, particularly DI, was highlighted, as it consistently contributed to higher model accuracy across different validation methods. Moreover, correlation analysis indicated strong relationships between certain features, such as CT and Q, which further emphasized their predictive power.
In addition to classification, clustering algorithms such as K-Means and DBSCAN were employed to identify natural groupings within the dataset. These methods offered valuable insights into the structure of the data and its potential for future applications in ART. By clustering similar cells, we were able to provide a comprehensive view of oocyte behavior, which can aid in optimizing ART procedures. In conclusion, the integration of mechanical properties with morphological data significantly enhances the accuracy and reliability of predictive models in ART. This multi-dimensional approach has the potential to improve the assessment and selection of oocytes, ultimately contributing to better reproductive outcomes. Future work could further explore the role of additional mechanical parameters and refine machine learning models to improve the precision of ART predictions.
Data availability
The data that support the findings of this study are available from the corresponding author upon reasonable request.
Code availability
The Python scripts used for data preprocessing, analysis, and machine learning model development are publicly available at: https://github.com/hassansaffari/Oocyte-Quality-Prediction
References
Hart, R. J. & Wijs, L. A. The longer-term effects of IVF on offspring from childhood to adolescence. Front. Reprod. Health 4, 1045762. https://doi.org/10.3389/frph.2022.1045762 (2022).
Abdullah, K. A. L., Atazhanova, T., Chavez-Badiola, A. & Shivhare, S. B. Automation in ART: paving the way for the future of infertility treatment. Reprod. Sci. 30, 1006–1016 (2023).
Khosravi, P. et al. Deep learning enables robust assessment and selection of human blastocysts after in vitro fertilization. NPJ Digit. Med. 2, 21. https://doi.org/10.1038/s41746-019-0096-y (2019).
Khan, H. L., Khan, S., Bhatti, S. & Abbas, S. Role of artificial intelligence in quality assurance in ART: A review. Fertil. Reproduct. 05, 1–7. https://doi.org/10.1142/S2661318223300015 (2022).
Zaninovic, N. & Rosenwaks, Z. Artificial intelligence in human in vitro fertilization and embryology. Fertil. Steril. 114, 914–920. https://doi.org/10.1016/j.fertnstert.2020.09.157 (2020).
Dimitriadis, I., Zaninovic, N., Badiola, A. C. & Bormann, C. L. Artificial intelligence in the embryology laboratory: A review. Reprod BioMed Online 44, 435–448. https://doi.org/10.1016/j.rbmo.2021.11.003 (2022).
Jiang, V. S. & Bormann, C. L. Artificial intelligence in the in vitro fertilization laboratory: A review of advancements over the last decade. Fertil. Steril. 120, 17–23. https://doi.org/10.1016/j.fertnstert.2023.05.149 (2023).
Gardner, D. K. & Sakkas, D. Making and selecting the best embryo in the laboratory. Fertil. Steril. 120, 457–466. https://doi.org/10.1016/j.fertnstert.2022.11.007 (2023).
Ibrahim, H. A., Thamilvanan, M. N., Zaian, A. & Supriyanto, E. in 2022 International Conference on Healthcare Engineering (ICHE). 1–4 (IEEE).
Jiang, V. S. et al. The use of voting ensembles to improve the accuracy of deep neural networks as a non-invasive method to predict embryo ploidy status. J. Assist. Reprod. Genet. 40, 301–308 (2023).
Garg, A., Valera, M. Á. & Meseguer, M. in Textbook of Assisted Reproductive Techniques 182–201 (CRC Press, 2023).
Lundin, K. & Park, H. Time-lapse technology for embryo culture and selection. Upsala J. Med. Sci. 125, 77–84 (2020).
Manna, C., Nanni, L., Lumini, A. & Pappalardo, S. Artificial intelligence techniques for embryo and oocyte classification. Reprod. BioMed. Online 26, 42–49. https://doi.org/10.1016/j.rbmo.2012.09.015 (2013).
Miyagi, Y., Habara, T., Hirata, R. & Hayashi, N. Feasibility of artificial intelligence for predicting live birth without aneuploidy from a blastocyst image. Reprod. Med. Biol. 18, 204–211. https://doi.org/10.1002/rmb2.12267 (2019).
Saeedi, P., Yee, D., Au, J. & Havelock, J. Automatic identification of human blastocyst components via texture. IEEE Trans. Biomed. Eng. 64, 2968–2978. https://doi.org/10.1109/TBME.2017.2759665 (2017).
Rocha, J. C. et al. A method based on artificial intelligence to fully automatize the evaluation of bovine blastocyst images. Sci. Rep. 7, 7659. https://doi.org/10.1038/s41598-017-08104-9 (2017).
Shen, L., Zhang, Y., Chen, W. & Yin, X. The application of artificial intelligence in predicting embryo transfer outcome of recurrent implantation failure. Front. Physiol. 13, 885661 (2022).
Barnett-Itzhaki, Z. et al. Machine learning vs. classic statistics for the prediction of IVF outcomes. J. Assist. Reprod. Genet. 37, 2405–2412 (2020).
Raef, B., Maleki, M. & Ferdousi, R. Computational prediction of implantation outcome after embryo transfer. Health Inform. J. 26, 1810–1826 (2020).
VerMilyea, M. et al. Development of an artificial intelligence-based assessment model for prediction of embryo viability using static images captured by optical light microscopy during IVF. Hum. Reprod. 35, 770–784. https://doi.org/10.1093/humrep/deaa013 (2020).
Fjeldstad, J. et al. Segmentation of mature human oocytes provides interpretable and improved blastocyst outcome predictions by a machine learning model. Sci. Rep. 14, 10569. https://doi.org/10.1038/s41598-024-60901-1 (2024).
Fjeldstad, J. et al. An artificial intelligence tool predicts blastocyst development from static images of fresh mature oocytes. Reprod. BioMed. Online https://doi.org/10.1016/j.rbmo.2024.103842 (2024).
Rubio, I. et al. Limited implantation success of direct-cleaved human zygotes: A time-lapse study. Fertil. Steril. 98, 1458–1463. https://doi.org/10.1016/j.fertnstert.2012.07.1135 (2012).
Desai, N., Goldberg, J. M., Austin, C. & Falcone, T. Are cleavage anomalies, multinucleation, or specific cell cycle kinetics observed with time-lapse imaging predictive of embryo developmental capacity or ploidy?. Fertil. Steril. 109, 665–674. https://doi.org/10.1016/j.fertnstert.2017.12.025 (2018).
Rubio, I. et al. Clinical validation of embryo culture and selection by morphokinetic analysis: a randomized, controlled trial of the EmbryoScope. Fertil. Steril. 102, 1287-1294.e1285. https://doi.org/10.1016/j.fertnstert.2014.07.738 (2014).
Goodman, L. R., Goldberg, J., Falcone, T., Austin, C. & Desai, N. Does the addition of time-lapse morphokinetics in the selection of embryos for transfer improve pregnancy rates? A randomized controlled trial. Fertil. Steril. 105, 275-285.e210. https://doi.org/10.1016/j.fertnstert.2015.10.013 (2016).
Coticchio, G. et al. Cytoplasmic movements of the early human embryo: Imaging and artificial intelligence to predict blastocyst development. Reprod. BioMed. Online 42, 521–528. https://doi.org/10.1016/j.rbmo.2020.12.008 (2021).
Tran, D., Cooke, S., Illingworth, P. J. & Gardner, D. K. Deep learning as a predictive tool for fetal heart pregnancy following time-lapse incubation and blastocyst transfer. Hum. Reprod. 34, 1011–1018. https://doi.org/10.1093/humrep/dez064 (2019).
Dirvanauskas, D., Maskeliunas, R., Raudonis, V. & Damasevicius, R. Embryo development stage prediction algorithm for automated time lapse incubators. Comput. Methods Progr. Biomed. 177, 161–174. https://doi.org/10.1016/j.cmpb.2019.05.027 (2019).
Sciorio, R., Miranian, D. & Smith, G. D. Non-invasive oocyte quality assessment. Biol. Reprod. 106, 274–290. https://doi.org/10.1093/biolre/ioac009 (2022).
Palay, P. et al. Simple bioelectrical microsensor: Oocyte quality prediction via membrane electrophysiological characterization. Lab. Chip 24, 3909–3929. https://doi.org/10.1039/D3LC01120H (2024).
Palay, P., Fathi, D. & Fathi, R. Oocyte quality evaluation: a review of engineering approaches toward clinical challenges. Biol. Reprod. 108, 393–407. https://doi.org/10.1093/biolre/ioac219 (2023).
Saffari, H. et al. Design and fabrication of aspiration microfluidic channel for oocyte characterization. Talanta 254, 124098. https://doi.org/10.1016/j.talanta.2022.124098 (2023).
Meyer, D. et al. Development and evaluation of a usable blastocyst predictive model using the biomechanical properties of human oocytes. PLoS ONE 19, e0299602. https://doi.org/10.1371/journal.pone.0299602 (2024).
Baniasadi, F., Hajiaghalou, S., Shahverdi, A., Pirhajati, V. & Fathi, R. Static magnetic field halves cryoinjuries of vitrified mouse COCs, improves their functions and modulates pluripotency of derived blastocysts. Theriogenology 163, 31–42. https://doi.org/10.1016/j.theriogenology.2020.12.025 (2021).
Kalyani, K. & Deshpande, P. S. A deep learning model for predicting blastocyst formation from cleavage-stage human embryos using time-lapse images. Sci. Rep. 14, 28019. https://doi.org/10.1038/s41598-024-79175-8 (2024).
Funding
This work receives no external funding.
Author information
Authors and Affiliations
Contributions
Hassan Saffari: conceptualization, data curation, formal analysis, investigation, methodology, software, validation, visualization, writing—original draft. Davood Fathi: conceptualization, data curation, formal analysis, investigation, methodology, software, Resources, validation, visualization, project administration, funding acquisition, supervision, writing—review & editing. Peyman Palay: visualization, writing—review & editing, investigation, methodology. Hamid Gourabi: visualization, writing—review & editing. Rouhollah Fathi: conceptualization, data curation, formal analysis, investigation, methodology, validation, visualization, project administration, funding acquisition, supervision, writing—review & editing.
Corresponding authors
Ethics declarations
Competing interests
The authors declare no conflict of interest.
Additional information
Publisher’s note
Springer Nature remains neutral with regard to jurisdictional claims in published maps and institutional affiliations.
Electronic supplementary material
Below is the link to the electronic supplementary material.
Rights and permissions
Open Access This article is licensed under a Creative Commons Attribution-NonCommercial-NoDerivatives 4.0 International License, which permits any non-commercial use, sharing, distribution and reproduction in any medium or format, as long as you give appropriate credit to the original author(s) and the source, provide a link to the Creative Commons licence, and indicate if you modified the licensed material. You do not have permission under this licence to share adapted material derived from this article or parts of it. The images or other third party material in this article are included in the article’s Creative Commons licence, unless indicated otherwise in a credit line to the material. If material is not included in the article’s Creative Commons licence and your intended use is not permitted by statutory regulation or exceeds the permitted use, you will need to obtain permission directly from the copyright holder. To view a copy of this licence, visit http://creativecommons.org/licenses/by-nc-nd/4.0/.
About this article

Cite this article
Saffari, H., Fathi, D., Palay, P. et al. Machine learning and microfluidic integration for oocyte quality prediction. Sci Rep 15, 26532 (2025). https://doi.org/10.1038/s41598-025-11810-4
Received:
Accepted:
Published:
Version of record:
DOI: https://doi.org/10.1038/s41598-025-11810-4
