
Abstract
The market entry of collective owned commercialised construction land (CCCL) is a crucial element of China’s ongoing rural land system reform. However, traditional appraisal methods struggle with efficiency and accuracy in the context of batch appraisals for CCCL market-entry prices. This study addresses this challenge by leveraging machine learning techniques to develop a batch appraisal model that enhances both efficiency and precision. Focusing on Beiliu City, a representative reform pilot area, we implemented three models—Random Forest (RF), Back Propagation Neural Network (BPNN), and Support Vector Machine (SVM)—to develop a tailored indicator system for price prediction. The results demonstrate that the RF model exhibits superior performance, achieving a mean absolute error of 17.50 yuan and a prediction accuracy of 94.77%, compared with 91.21% for BPNN and 91.94% for SVM. Moreover, this research reveals that CCCL prices display unique characteristics distinct from those of other land types, with significant influences from factors such as township economic levels and the specific approaches used for market entry. These findings validate the effective application of machine learning models in this context, offer a scientific foundation for standardising the land market, and serve as a guide for relevant policy formulation.
Introduction
The acceleration of urbanisation and drive towards integrated urban-rural development in China have positioned the market entry of CCCL as a vital mechanism for revitalising rural land assets, facilitating equitable urban-rural exchange, and augmenting farmers’ property income. Defined as rural construction land designated for production and operational purposes1, CCCL plays a significant role in optimising land resource allocation and fostering rural economic development2. Since 2015, China has implemented extensive pilot reforms in its rural land system3. The 2020 revision of the Land Management Law explicitly permits the transfer and leasing of CCCL, dismantling institutional barriers to the establishment of a unified urban-rural construction land market4. As CCCL market-entry policies have gained traction, transaction volumes have surged, underscoring the urgent need for efficient and accurate batch-valuation methods.
However, the distinctive characteristics of CCCL—including its abundance, low per-unit value, and fragmented distribution5—coupled with its marked differences from state-owned construction land in terms of ownership, rights, and infrastructure2, present challenges for traditional valuation approaches. Methods such as market comparison, income capitalisation, and cost analysis falter due to a scarcity of comparable cases, subjective parameter choices, and unreliable income and depreciation estimates6,7,8,9. These limitations compromise the objectivity and consistency of valuation outcomes, hindering an accurate reflection of CCCL’s market value and undermining the scientific rigour and efficiency of market entry assessments.
Over the past two decades, in parallel with the rapid advancement of big data and artificial intelligence technologies, machine learning methods have shown considerable potential for transforming the field of real estate appraisal. A growing body of research, both domestic and international, has applied models such as artificial neural networks10,11,12, BPNN13,14,15,16, RF17,18,19, SVM20,21,22, XGBoost23,24,25, and deep learning26]– [27 to enhance real estate and land price assessments. These studies have highlighted the notable advantages of ML in capturing complex nonlinear relationships28 and improving appraisal accuracy and efficiency, particularly in the context of urban or state-owned land markets. Further refinements include integrating multiple machine learning algorithms to develop more precise residential land price prediction models29,30, offering increasingly sophisticated methodological approaches. However, despite these significant strides, the application of ML in this domain has remained largely concentrated on state-owned construction land and urban residential properties24,25,29. Consequently, the specific complexities associated with CCCL valuation have received comparatively little attention. Research explicitly focusing on the batch appraisal of CCCL market-entry prices remains scarce31. While the existing literature touches upon the systems, policies, and influencing factors of CCCL market entry3,32, systematic investigations that develop, validate, and analyse the influencing factors for ML-based batch appraisal models tailored to CCCL are notably lacking. Specifically, empirical studies applying machine learning techniques to the batch appraisal of CCCL market-entry prices in China—with model optimisation and accuracy verification tailored to its unique characteristics—represent an underexplored yet critical research area.
To address this research gap, this study develops a machine learning-based batch appraisal model for CCCL market-entry prices, aiming to overcome the limitations of traditional methods regarding efficiency and accuracy. Beiliu City in Guangxi—one of the 33 pilot areas for rural land system reform in China and the county-level city with the strongest economy in Guangxi—has achieved notable success in its CCCL market-entry reforms, making it a representative and typical case for investigation. This study constructs a tailored batch appraisal indicator system using transaction data from 118 legally marketed CCCL parcels in Beiliu City between 2015 and 2022. Three machine learning models—RF, BPNN, and SVM—are employed for price simulation, prediction, and performance comparison to identify the batch appraisal methods suited to the characteristics of CCCL market entry. The marginal contributions of this study are threefold: (1) it presents an initial exploration of applying machine learning techniques to the batch appraisal of CCCL market-entry prices; (2) it develops a specialised appraisal indicator system tailored to the unique features of CCCL; and (3) it provides a comparative analysis of the applicability of three widely used machine learning models in this context, offering empirical insights for model selection. The findings are expected to provide a scientific foundation for government decision-making on CCCL market-entry pricing, enhance appraisal efficiency, and support the standardisation and sustainable development of the land market.
Data and methods
Study area overview
Beiliu City, situated in Yulin City in southeastern Guangxi, features a topography that is higher in the north and lower in the south. It has a subtropical monsoon climate and is located at the juncture of the Beibu Gulf Economic Zone and the Pearl River-West River Economic Belt. Covering a total area of 2,457 km², it comprises 25 towns (or sub-districts) and 311 administrative villages (communities), supporting a total population of 1.56 million. In 2022, Beiliu City’s GDP reached 41.642 billion yuan, making it the first county-level city in Guangxi to surpass 40 billion yuan. The city is characterised by high economic activity, relatively abundant circulating capital, and rapid industrial development. Beiliu City is also one of the 33 pilot counties (cities and districts) for China’s rural land system reform initiated in 2015, serving as a crucial area for comprehensive rural reform both in Guangxi and nationally. Notably, the scale of CCCL’ market entry ranks among the highest of the 33 pilot areas. Beiliu City has successfully leveraged land system reform to unlock land resources, and its economic dynamism and mobile capital have indirectly stimulated the demand for CCCL market entry. It has developed a positive feedback loop of “policy breakthrough—market response—capital participation”, offering a “strong economy + land reform” model that serves as a reference for similar regions across the country. Therefore, the CCCL market entry test set samples used in this study are drawn from 16 villages and towns. The training set samples are illustrated in Fig. 1.

Study area and sample distribution of the training set. (a) Map of China. Note: The basic map of China is derived from the standard map service website (http://bzdt.ch.mnr.gov.cn ) with approval number GS(2023) 2763 produced by the Ministry of Natural Resources of the People’s Republic of China, and the base map has not been modified. (b) Schematic diagram of Guangxi counties and Beiliu City. (c) Sample distribution of towns and training sets in Beiliu City. Note The map was generated using GIS 10.8 (https://www.gscloud.cn/).
Data sources and processing
The data for this study originated from four primary sources. First, the publicly listed transaction data for CCCL market entry from 2015 to 2020 are available on the Beiliu Municipal Government’s official website. Second, data were sourced from the Beiliu Municipal Natural Resources Bureau, including information on land value increment revenue adjustment funds (2015–2022), revenue from rural CCCL (2015–2022), and transaction records for agricultural land entering the market (2015–2022). Third, field surveys conducted in November 2020 and December 2022 provided data on road accessibility, external transportation links, infrastructure, and public service facilities. Fourth, supplementary data for relevant appraisal indicators were obtained from CCCL market-entry announcements on the official website of the Beiliu Municipal Natural Resources Bureau (http://zrzyj.yulin.gov.cn/). Field investigations confirmed that the listed prices of CCCL closely approximated their actual market values, indicating a high degree of data authenticity and effectively reflecting the real market conditions of CCCL entry.
Recognising that the performance of machine learning models depends heavily on sample quality, high-quality data are crucial for ensuring the scientific validity and reliability of experimental results. This study systematically preprocessed a panel dataset of 146 CCCL market entry transactions collected between 2015 and 2022. Preprocessing encompassed data integration, cleaning, transformation, and partitioning. Specifically, samples with missing key information or significant discrepancies between recorded and announced land prices were eliminated. Duplicate data were removed to ensure uniqueness of the dataset. Finally, Min-Max normalisation was applied to the numerical variables to mitigate the impact of different scales on model training. Following the data cleaning process, 118 valid samples were retained.
Given that CCCL market entry was still in the preliminary stage of development as of 2022, the sample size is relatively limited. To ensure that the machine learning models could be adequately trained, this study adopted a comparatively large proportion for the training set. Moreover, considering the balance of sample characteristics for the land-type indicators, 16 samples were selected for the test set during the dataset partitioning process, and the remaining samples were allocated to the training set. This partitioning strategy aimed to balance the sufficiency of model training with the reliability of the test set evaluation, thereby providing a scientific basis for the subsequent model performance analysis.
Methods
Compared with traditional land valuation methods, machine learning models demonstrate significant advantages in terms of appraisal efficiency and accuracy. This study selected RF, BPNN, and SVM—three machine learning models—for batch appraisal based on sample size, algorithm characteristics, and general applicability. This selection is primarily justified for two reasons. First, compared to deep learning and ensemble models, these traditional machine learning models have a lower dependence on large sample sizes and are more computationally economical, aligning well with the currently limited sample size of CCCL market entry transactions. Second, each of the three models has unique strengths, enabling them to address the research needs from different perspectives. Specifically, RF, while ensuring robust model performance, can reveal the dominant factors influencing CCCL market-entry prices through feature importance ranking, providing data support for optimising market entry regulations. Owing to its powerful nonlinear modelling capabilities, the BPNN can effectively capture the complex relationships between land prices and their influencing factors, avoiding valuation distortions that may arise from traditional linear formulas. Through the flexible selection of kernel functions, SVMs can achieve stable extrapolated predictions, even with small sample sizes, ensuring the reliability of appraisal results in the pilot areas.
Result analysis
Variable selection and importance ranking
Selection of model variables
The principles of “same land”, “same rights”, and “same price” in the CCCL market entry process provide a reference framework analogous to that used for state-owned construction land in land price appraisal. Land price appraisal typically necessitates the consideration of multiple dimensions, including regional location, land attributes, economic and market conditions, and policy and regulatory factors. Specifically, regional location determines a land parcel’s accessibility, surrounding amenities, and development potential. Land attributes—such as topography, area, geological conditions, and other natural characteristics—directly influence development costs and utilisation value, thereby determining price levels. Economic and market factors—including regional economic development level, population density, and the relationship between supply and demand—affect land prices by influencing land demand and investment expectations. Policy and regulatory elements, such as land use planning, tax policies, and environmental restrictions, indirectly regulate land prices by constraining land development and usage. However, due to the immature development of the CCCL market and difficulty in quantifying policy factors, this study does not consider the impact of market and policy factors in the appraisal process.
Therefore, building on traditional land price appraisal methods and existing research on batch land price appraisal—while also considering the unique characteristics of the CCCL and the availability of influencing factors—this study selected 13 sub-categories of influencing factors across three main categories: socioeconomic, locational, and individual factors. At the specific indicator level, township per capita net income (X1), as a core indicator of regional economic affordability, reflects the potential effective market demand after the capitalisation of collective land assets. Per capita cultivated land area (X2) measures the scarcity of agricultural land resources and the opportunity cost of land conversion, constraining the elasticity of market entry supply. Township population density (X3) reflects the intensity of land demand, while the degree of prosperity (X4) assesses the level of regional commercial activity. Road accessibility (X5) and external transportation convenience (X6) represent the parcel’s internal and external accessibility, respectively. The completeness of infrastructure (X7) and public service facilities (X8) reflect both the sunk costs of development and the externalities of human capital, which jointly constitute the implicit value of land development and directly affect land development costs and use value. Parcel area (X9) determines the scale and intended use of development, while planned floor area ratio (X10) and planned building density (X11) measure land development intensity and utilisation efficiency, respectively. The market-entry approach (X12) and planned market-entry use (X13) reflect cost heterogeneity and differences in use-based discount rates across different transaction models. The market-entry approach influences transaction transparency and the degree of market competition, while planned market-entry use directly determines the development potential and market value of the land. The specific variables and quantification standards are listed in Table 1.
Variables in order of importance
Based on R software, this study used the importance function in the RF model to calculate and rank the importance of each characteristic variable affecting the price of collective operating land in the market. The importance of the variables in RF model was measured by the ‘Percentage of increase of mean square error’ (IncMSE). A higher IncMSE indicates greater variable importance, and the size of this value reflects the significance of each variable. Using the final optimisation parameters of the RF model, the price assessment model for Beiliu City’s CCCL market entry was established. The calculation results of the IncMSE values for each characteristic variable are shown in Fig. 2.
According to the calculation results of the characteristic importance, the top five variables affecting the market price of CCCL in Beiliu City are, in order: parcel area (IncMSE = 35.26), per capita net income of the township (IncMSE = 18.5), planned building density (IncMSE = 14.58), planned use in the market (IncMSE = 9.4), and township population density (IncMSE = 8.8).

Importance ranking of feature variables.
Among the socioeconomic factors, per capita net income and population density had a greater impact on the price of land entering the market, with IncMSE values of 18.5 and 8.8, respectively. Per capita net income reflects the average net income of residents in a region and, as an important economic indicator, has a significant positive impact on the price of land entering the market. A higher population density increases the demand for land use, which, in turn, increases land prices, making it an important factor influencing the price of land on the market. Among the location factors, the degree of prosperity and road accessibility reflect the convenience of traffic and transportation in the vicinity of land parcels. The value-added effect of these factors is particularly noticeable for commercial and residential land and industrial and mining land, with IncMSE values of 7.83 and 6.48, respectively. Among the individual factors, the IncMSE values for parcel area and planned building density were 35.26 and 14.58, respectively. The effect of these two factors on CCCL land prices is highly significant. The plot area and planned building density are important individual characteristics of a plot; in general, the larger the plot area and the lower the building density, the higher the land price.
Based on the characteristics of collectively managed construction land, this study added two indicators—, market access and planned market use—to make the land price assessment index system more targeted. The IncMSE values for planned market use and market access, as calculated by the RF model, were 9.4 and 8.34, respectively, ranking fourth and sixth among the characteristic variables affecting the market price of collectively managed construction land. This indicated that both variables have a greater degree of influence on the market price of the land. Planned market use determines the economic returns and service life of future land development. Variations in planned land use are one of the primary reasons for differences in the value-added returns of CCCL33. For CCCL, land price is primarily composed of three components: land acquisition compensation, land value-added income adjustment, and land reclamation fees. Among these, land acquisition compensation and land value-added income adjustment together account for 70% of the total market price34. The planned market use of the land directly determines the proportion of value-added income adjustment, which has a direct impact on the transaction price. Generally, commercial and residential land command higher unit prices, while industrial and public administration land are priced relatively lower. In Beiliu City’s land system reform pilot, the method of market entry for CCCL directly impacts transaction costs. Both adjustment and remediation include land reclamation fees, a proportion of which is determined by the planned market use of the land. Consequently, this indicator also significantly influences the final transaction price.
Construction of the batch assessment model of collective business Building land entering the market
RF land value bulk assessment model construction
Constructing a batch appraisal system for CCCL prices using RF depends on fine-tuning model parameters, including the number of decision trees, the feature selection method, and the depth of the trees. Through iterative training and validation, the model was optimised to achieve a high degree of fit on the training set while demonstrating strong predictive accuracy on the test set. Once training was complete, the core parameters and model structure were saved, enabling its application to the feature data of the parcels to be appraised, thereby achieving batch appraisal.
The RF land price model based on R, after variable selection, was primarily influenced by two factors: the number of variables selected for the decision tree bifurcation nodes (mtry) and the number of decision trees used for training and prediction in the RF (ntree). The mtry parameter determines the number of variables considered for each binary split in the decision trees of the RF model, while ntree represents the number of decision trees used for training and prediction. In this study, mtry was set to 5 and ntree to 500. These parameter values were selected based on two considerations. First, the characteristics of the data and the attributes of the appraisal objects were carefully evaluated. Specifically: (1) Feature dimensionality suitability: Thirteen feature factors were used in this study (X1-X13). According to the original design of the RF model, the default value for regression tasks was p/3 ≈ 4.33. Rounding this up to 5 follows theoretical convention. Under this condition, RF can retain sufficient information (avoiding high bias from using too few features) while mitigating feature collinearity (e.g., potential spatial correlation between X5, road accessibility, and X6, external transportation convenience) through random sampling. (2) Data characteristics suitability: CCCL market entry encompasses diverse types, requiring the model to capture nonlinear interaction effects (e.g., the interaction between X12, market entry approach, and X13, planned use). Moderately increasing mtry above the default value of 4 enhances the expressive power of individual trees while avoiding overfitting. (3) Convergence assurance: CCCL is characterised by “small parcel size and large quantity”, leading to significant data noise. Setting ntree to 500 ensures sufficient error convergence, preventing small-sample noise from interfering with the model’s generalisation ability.
Second, the parameter selection was also based on parameter testing and optimisation. The parameter mtry determines the number of variables for each bifurcation in the decision trees of the RF model, while ntree is the number of decision trees used for training and prediction. In this study, the optimal mtry value was determined using the following steps: (1) Set the ntree value to 200, vary mtry from 1 to 13, and perform modelling 13 times to obtain the corresponding goodness-of-fit results. (2) Set the ntree value to 500, repeat the steps in (1), and repeat the above operation in increments of 500 trees. This was repeated until there was no obvious change in the model’s goodness-of-fit curve. The training results are shown in Fig. 3, where the model achieves maximum goodness-of-fit when the mtry value is around 5, and the curves are more concentrated. Therefore, this study adopted the mtry value of 5 as the optimal parameter.

Model goodness of fit versus mtry value.
Based on the R software, the mtry value was set to 5 to explore the relationship between the residual sum of squares and the number of ntree of the RF model, and the graph of their quantitative relationship is shown in Fig. 4.
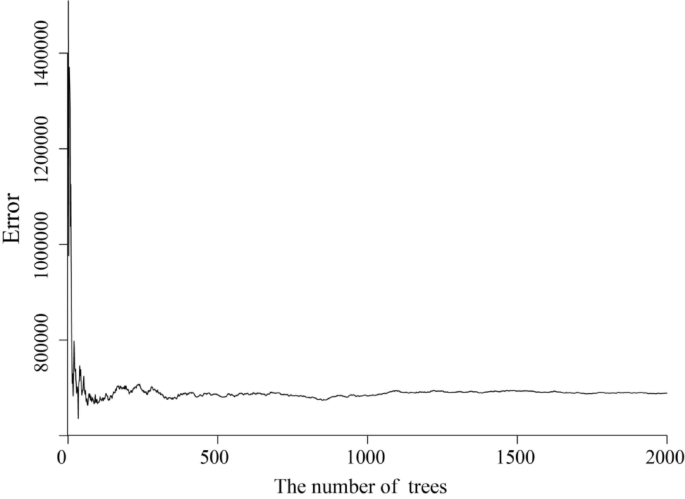
Model residual sum of squares versus ntree values.
Figure 4 shows that the model tends to stabilise when the ntree value exceeds 500. Therefore, this study set the ntree value to 500 as the final optimised parameter. The parameters of the RF land price batch appraisal model are shown in Table 2.
BPNN land value bulk evaluation model construction
The BPNN was used to conduct batch appraisal of CCCL prices. This required repeated adjustments to key parameters including the activation function, training function, training target error, and the maximum number of training iterations. This continued until the training set fit test was qualified, and through the prediction set accuracy test, the training could be ended to save the network weights and the queue value matrix, and to enter the characteristics of the parcel to be evaluated for values for the bulk assessment of CCCL.
This study selected 13 model variables for CCCL batch appraisal. Consequently, the input layer of the BPNN model contained 13 nodes. The output layer, representing the CCCL market-entry price, had one node. Based on this, and through the application of empirical formulas combined with grid search validation, the number of hidden layer nodes was set to 21. This configuration maintained the nonlinear modelling capabilities while avoiding overfitting. The network architecture comprised three layers: input, hidden, and output layers. The key parameter settings for constructing the BPNN-based batch appraisal model for land prices are presented in Table 3.
SVM land value bulk assessment model construction
This study was based on the MATLAB software, using the libsvm-mat-2 [1]0.89 − 3 [FarutoUltimate3.0Mcode] version of the toolbox to perform model training and prediction. The dataset comprised a training set of 102 samples and a test set of 16 samples. The mapminmax function in MATLAB 2018a was used for normalisation, followed by data transposition before inputting the data into the SVM model. Regarding the choice of kernel function, due to the current lack of research on CCCL market entry indicators in China and the absence of prior knowledge about the data, this study employed the Radial Basis Function (RBF) kernel, known for its smoothing properties, as the kernel function for the SVM model. When the SVM prediction is a smooth estimate, the computational cost is reduced while maintaining good predictive performance. The key SVM parameters, penalty (C) and kernel (gamma), were selected based on both theoretical and empirical considerations, with final values of 32 and 0.1768, respectively. On the one hand, these values were obtained through optimisation using a mesh grid search. On the other hand, the CCCL market is subject to policy intervention noise (e.g., administrative directives on the market entry approach, X12). A higher penalty value allows for the misclassification of a small number of outliers, which prevents overfitting and avoids an overly lenient model (e.g., underfitting in the training set when C < 10). Using standardised data, the theoretically optimal kernel value was 1/(13 × average variance). Given the substantial proportion of land-related indicators in the indicator system, and considering that the variance of these indicators after scaling often falls between 0.2 and 0.6, taking the average variance as 0.4 yielded a theoretically optimal kernel of 0.1923. A reasonable kernel parameter should be close to this value. The specific model parameter settings are shown in Table 4.
Comparison of forecast results
Currently, the number of collective operating land transactions in Beiliu City is limited, and the characteristics of the traded land vary widely. To ensure the comprehensiveness of the bulk assessment model, the representative characteristics of the traded objects should be thoroughly selected as test samples. Among the 118 CCCL transaction samples in Beiliu City’s, there are four market-entry methods: in-situ entry, remediation entry, adjustment entry, and entry after approval for agricultural land conversion to new construction land. There are five planned uses for entering the market: industrial and mining land, public administration and public land, commercial land, and commercial and residential land; and five planned uses for the samples. The transaction samples can be classified by entry zones, including Beiliu Town (the outskirts of Beiliu City), Dali Town (suburbs), Dali Town (the north of Beiliu City), Beiliu Town (suburb of Beiliu City), Dali Town (northwestern part of Beiliu), Liujing Town (southern part of Beiliu), Longsheng Town (central part of Beiliu), Minan Town (eastern part of Beiliu City), Qingshuikou Town (central part of Beiliu), Tangshi Town (southwestern part of Beiliu), and Xinweizhen Town (northwestern part of Beiliu), and other major areas. The 16 sample parcels selected for the test set, based on the four characteristics of market-entry time, market-entry location, market-entry use, and market-entry route, along with the absolute error of the model’s predictions, are shown in Table 5.
Based on the results presented in Table 5, we conducted a detailed analysis of the prediction accuracy of the machine learning models for CCCL market-entry prices. The absolute prediction errors in the table revealed significant variations in the performance of different models across different land-use types and regions. First, RF exhibited a relatively balanced predictive performance across all land use types, particularly for commercial residential land, industrial mining warehousing land, and residential land, where its errors are relatively small, demonstrating an advantage over other models. By contrast, the BPNN showed greater fluctuations in prediction errors, suggesting that it may struggle to capture accurate predictions in certain complex nonlinear relationships. The SVM performed poorly in some areas with high market uncertainty, possibly because it struggles to capture more nuanced price variation patterns. From a geographical perspective, the prediction errors for the CCCL market-entry prices in the western and suburban areas of Beiliu City were generally higher.
This trend was particularly evident in the predictions of the BPNN and SVM models, indicating that the RF still possesses a degree of adaptability when dealing with these complex markets. Furthermore, for newly developed areas, larger prediction errors may stem from incomplete data, as these areas have not yet established stable market trends. Examining different market-entry approaches, variations in land prediction errors reflect the uncertainty of market information and the complexity of land policies. “On-site market entry” land exhibited smaller prediction errors due to the relative stability of the market and clearer information; however, “adjusted market entry” and, especially, “consolidated market entry” land showed larger prediction errors due to the complexity of policy changes and market adjustment periods. Therefore, the performance of prediction models varied significantly across different land market entry approaches. For “consolidated market entry” land, in particular, more market data and policy background information are needed to improve prediction accuracy. Looking at the individual test samples, Samples 6, 7, 9, 12, and 16 in the test set showed greater dispersion between the model’s predicted values and the actual values (Fig. 6), indicating a larger deviation between the model’s overall prediction results and the true values. According to Table 5, the market entry time for Sample 6 and the subsequent samples was three years or later after the policy pilot, and their errors were significantly higher than those in the early stages of policy implementation.

Comparison of true and predicted values of the training set.
Figures 5 and 6 show that the RF, BPNN, and SVM models exhibited varying predictive capabilities when forecasting CCCL prices. RF demonstrated a relatively stable fit to the training set, and the fluctuations in its predicted values aligned with those of the actual values, indicating that RF has a good ability to capture the underlying trends in the data. The training set error was relatively small, particularly in areas with more volatile price fluctuations. For the test set, the RF model maintained relatively stable predictions that closely matched the fluctuations in the actual values. This demonstrates good generalisation ability and predictive accuracy, effectively reducing overfitting and maintaining good performance in predicting new data. The BPNN exhibited a relatively smooth fitting curve for the training set. Although deviations were observed in the predicted values for certain peaks and troughs, the overall trend was relatively accurate. The BPNN can predict more accurately in areas with fewer price fluctuations, but in areas with significant price fluctuations (as seen in the middle section of Figure b), its prediction errors increase significantly, showing some signs of overfitting. For the test set, the BPNN prediction errors were relatively large, particularly in areas with significant price fluctuations where the difference between the model’s predictions and actual values was more pronounced. This suggests that the BPNN may be affected by overfitting when dealing with complex market fluctuations and is more sensitive to local changes. The SVM prediction results were relatively consistent with the fluctuations in the actual values. However, compared with the RF and BPNN, the SVM’s fitting curve appears smoother and fails to accurately capture drastic price changes in some highly volatile areas. This reveals SVM’s limitations when dealing with highly volatile data, possibly because its implicit assumption of linearity does not adapt well to the nonlinear characteristics of the data. The SVM’s performance was slightly inferior to those of the RF and BPNN, especially in test set intervals with significant price fluctuations, where there was a larger deviation between the SVM’s predictions and actual values.

Comparison of predicted results and real values.
Precision comparison
To test the simulation accuracy of the three models, this study selected R2, RMSE, MAE, and RA as evaluation metrics. R2 represents the degree of fit between the predicted and actual results; the closer R2 is to 1, the better the model prediction effect. RMSE measures the deviation between predicted and actual values, while MAE is the mean absolute error. MAE is less sensitive and more inclusive than the outlier samples, meaning smaller RMSE and MAE values indicate more accurate prediction results. RA indicates the degree of proximity between the predicted quantity and the actual situation, the higher the RA, the more accurate the prediction. Detailed results of the accuracy test are shown in Table 6.
As shown in Table 6, the model fit (R²) of RF, BPNN, and SVM in the training set was 96.6%, 89.0%, and 93.8%, respectively; the root mean square error (RMSE) was 17.8 RMB, 24.1 RMB, and 22.9 RMB, respectively; the mean absolute error (MAE) was 14.8 RMB, 20.4 RMB, and 18.2 RMB, respectively; and the prediction accuracy (RA) was 96.6%, 92.5%, and 95.6%, respectively. In the test set, the R² values for RF, BPNN, and SVM were 90.42%, 83.29%, and 86.63%, respectively; the RMSE was 21.37 RMB, 30.23 RMB, and 28.11 RMB, respectively; the MAE was 17.50 RMB, 25.58 RMB, and 24.26 RMB, respectively; and the prediction accuracy RA was 94.77%, 91.21%, and 91.94%, respectively.
In summary, among the three machine learning models used for the price assessment of Beiliu City’s collective operating land for market entry, RF had the strongest generalisation ability, followed by SVM, while BPNN performed the weakest. RF had the best performance in terms of goodness-of-fit and prediction accuracy.
Discussion
Studies have indicated that CCCL’s entry into the urban state-owned land market has a relatively weak impact on existing market structures35. This suggests that under the policy framework of integrated urban-rural land markets, the short-term price appraisal of CCCL should primarily reference the CCCL market. Currently, research on CCCL price appraisals is limited and relies predominantly on traditional methods, such as the market comparison approach. Although some studies have attempted to construct CCCL appraisal models using the market comparison approach36, these methods face challenges due to the absence of a well-established transaction market, which adversely affects parameter adjustments. Additionally, socioeconomic differences across pilot regions further limit the generalisability of such methods. Relevant studies have suggested that land appraisal based on machine learning models is an effective and scientific approach37,38,39. For instance, some scholars have used features such as economic development, geographic location, and infrastructure to build CCCL price appraisal models using ordinary least squares (OLS) to achieve regression results (R²=0.759) with moderate explanatory power. However, the price formation mechanism of CCCL often involves complex nonlinear relationships, and linear models such as OLS have limited fitting capabilities for such problems, necessitating further optimisation. These findings indicate that, compared to traditional appraisal methods and linear models, machine learning offers superior applicability and accuracy for evaluating CCCL market-entry prices.
To highlight the differences from other studies, this study selected two indicators specific to CCCL market entry: the market entry approach (X12) and planned market entry use (X13). RF’s variable importance analysis revealed that both contribute significantly to price. Planned market entry use determines the future economic benefits and service life of the land development. The difference in planned market entry use is one of the main reasons for the variation in value-added income from CCCL market entry33. For CCCL, the land price is mainly composed of land acquisition compensation, land value increment revenue adjustment fees, and land reclamation fees. Among these, the land acquisition compensation and land value increment revenue adjustment fees account for 70% of the total market entry price39. The planned market-entry use of a parcel directly determines the proportion of the value-added income adjustment fee levied, which directly impacts land transaction price. Generally, the unit prices of commercial and residential land are higher, whereas those of industrial land and land for public administration and services are relatively lower. In the land system reform pilot in Beiliu City, the market-entry approach for CCCL directly affects transaction costs. Both adjusted and consolidated market entry methods include land reclamation fees, with the collection ratio determined by the intended market entry use. Therefore, this indicator also significantly impacts the transaction price of land market entry. Beiliu City, one of the most market-oriented regions among the 33 national land system reform pilot projects, has a vibrant market economy. This study provides a reference or supplement for CCCL market entry into other pilot areas.
Despite the additions to the indicator system, this study has some limitations. First, the impact of policy factors on the model’s predictive ability was not fully addressed. During the CCCL market-entry process—from pilot programmes to formal implementation—policy implementation methods and regulatory mechanisms underwent several adjustments, significantly influencing the formation mechanism of land prices. The results showed that in the early stages of policy implementation, machine learning models could capture the features influencing prices and make accurate predictions using 13 variables. However, as the policy pilot entered its third year and beyond, the model’s prediction accuracy began to decline. This phenomenon reflects a high degree of consistency between market responses and policy objectives in the early stages of policy implementation. However, with frequent policy adjustments (e.g., changes in revenue distribution rules39 and optimisation of market entry approaches), the market environment has become more complex, and the model has failed to capture these dynamic changes in a timely manner. Therefore, for land markets significantly affected by policies, future research should incorporate variations in policy environments into model construction to improve their adaptability to policy changes. Second, the limitations in data quantity and structure affected the stability and generalisability of the model. Because CCCL market entry is still in its initial stages, the number of valid samples collected in this study was only 118, which is a relatively limited data scale. Furthermore, regarding data structure, commercial land and mixed commercial-residential land samples account for a relatively high proportion, while industrial-mining-warehousing land and land for public administration and public services have fewer samples. This proportional bias may introduce noise during model training, leading to overfitting and affecting prediction accuracy. As CCCL market entry progresses and the market gradually develops, it is expected that more comprehensive and representative sample data will become available, thus providing a stronger foundation for model optimisation.
Overall, the application of machine learning to CCCL market-entry appraisals is feasible. Further analysis revealed significant price heterogeneity resulting from a combination of factors, including policy changes, regional characteristics, and data limitations. The research demonstrated that RF performed relatively steadily in complex market environments, while BPNN and SVM showed significantly increased prediction errors in certain areas (such as the western and suburban areas of Beiliu City), especially for land prices under the “adjusted market entry” and “consolidated market entry” approaches. Price appraisals in the early stages of policy implementation was relatively stable; however, with frequent policy adjustments, the model accuracy declined significantly, reflecting the amplifying effect of policy changes on price heterogeneity. Furthermore, insufficient sample sizes and differences in data structure (e.g., a higher proportion of commercial land samples and fewer industrial-mining and warehousing land samples) may further exacerbate prediction errors.
Conclusion
This study simulated and trained 118 CCCL market-entry prices in Beiliu City, Guangxi. After selecting the appropriate model variables, batch appraisal models were constructed using three machine learning methods (RF, BPNN, and SVM). The optimal parameters for each model were determined using iterative learning and training. These optimised models were then used to test the batch appraisal of CCCL market-entry prices and to comparatively analyse the predictive accuracy of the three models. This process demonstrated the feasibility of applying machine learning models to CCCL market-entry price appraisals. The following conclusions were drawn from the study:
(1) Based on the variable importance analysis from the RF model, the factors influencing the market-entry price of CCCL in Beiliu City, in order of importance, were: land plot area, township per capita net income, building density, market-entry usage, township population density, market-entry method, degree of economic prosperity, degree of road accessibility, the plot ratio, per capita cultivated land area, degree of infrastructure development, degree of external transport accessibility, and degree of public utility development.
(2) This study constructed a bulk assessment model for CCCL based on three machine learning models. The results demonstrated that all three models achieved high predictive accuracy. The price errors for all 16 test samples were within 30 yuan/m², with MAEs of 17.50, 25.58, and 24.26 yuan/m² for the RF, BPNN, and SVM models, respectively. The coefficients of determination (R²) for RF, BPNN, and SVM were 94.77%, 91.21%, and 91.94%, respectively.
(3) Significant heterogeneity exists in CCCL market-entry prices. The test set results revealed that the prediction errors for RF, BPNN, and SVM were generally higher for “consolidated market entry” and “adjusted market entry” approaches compared to “on-site market entry”. This was particularly evident in areas with frequent policy changes and complex market adjustment periods, such as the western and suburban regions of Beiliu City, where prediction errors increased significantly. Furthermore, price appraisals during the early stages of policy implementation were more stable than those in later stages.
Data availability
The experimental data of this study is divided into three parts, which are market transaction information of individual collective-operated construction land, land plot economy and location information. First, the market transaction information of individual collective-operated construction land is derived from the data of the Table of Value-added Income of Rural collective-operated construction Land in the market provided by the People’s Government of Beiliu City, Yulin, Guangxi, China, which is mainly used to obtain key basic information of land valuation, such as: A ground area, entry time, the market approach, plan in the market use public data, such as market price but not belong to the government, in addition the rest of the basic information, for example, plot ratio, building density, the formula of the plot area can flow through the north municipal people’s government portal website (http://www.beiliu.gov.cn/), the second, Block economy by the National Bureau of Statistics web site (https://www.stats.gov.cn/), county of China statistical yearbook from 2016 to 2022 can be cultivated land area and population data, extracting common third, bustling location information mainly through remote sensing image measurement and prosper.The first part of the data belongs to the undisclosed data provided by the government separately, and only a small part of the land parcel information can be obtained from the link of the relevant land parcel transaction announcement; The second part can be obtained from China County Statistical Yearbook for 2016-2022, that is, public data; The third part is the targeted micro data obtained from the geographic survey of satellite map according to the actual research situation of the research place.Data sets used and/or analyzed in the current study are available upon reasonable request by the corresponding author. The first part includes the data, including the market access of the transaction land, the area of the transaction land and other indicators. In the third part, the location index data of the land collected and calculated by the author for the land can be contacted by email huanglicheng0128@163.com. The second part of the data can be downloaded from the National Bureau of Statistics portal (https://www.stats.gov.cn/sj/) if necessary.
References
Zhou, Y., Li, X. & Liu, Y. Rural land system reforms in china: history, issues, measures and prospects. Land. Use Policy. 91, 104330 (2020).
Wen, L., Yang, S., Qi, M. & Zhang, A. How does china’s rural collective commercialized land market run? New evidence from 26 pilot areas, China. Land. Use Policy. 136, 106969 (2024).
Yang, R. & Yang, Q. Restructuring the state: policy transition of construction land supply in urban and rural China. Land 10 (1), 15 (2020).
Hu, D. Balanced jurisprudence and institutional arrangement of interest coordination between land acquisition and Collective-owned construction land marketization. China Land. Sci. 34 (9), 10–16 (2020). (Chinese).
Jiao, M. & Xu, H. How do collective operating construction land (COCL) transactions affect rural residents’ property income? Evidence from rural Deqing county, China. Land. Use Policy. 113, 105897 (2022).
Shan, S. & You, J. Market comparison method and Lts application toagricultural land appraisement. J. Tongji University(Natural Science). 30 (11), 1397–1401 (2002). (Chinese).
Cai, J. & Zhu, D. Error propagation of income approach in land evaluation. Sci. Surveying Mapp. 39 (1), 117–120 (2014). (Chinese).
Shan, S. THE COST APPROACHANDITS APPLICATION TOAGRICULTURAL LAND EVALUATION. Resour. Sci. 24 (6), 18–21 (2002). (Chinese).
Qu, W. & Yu, Y. Using the hypothetical development method based on Monte Carlo simulation to improve the valuation of base price of land leasing. China Land. Sci. 28 (11), 11–18 (2014). (in Chinese).
Wiśniewski, R. Selected aspects of the use of artificial neural networks for the mass appraisal of real estates in Poland. Argumenta oeconomica 21(2), 125–152.
Mankad, M. D. Comparing OLS based hedonic model and ANN in house price Estimation using relative location. Spat. Inform. Res. 30 (1), 107–116 (2022).
Nazemi, B. & Rafiean, M. Modelling the affecting factors of housing price using GMDH-type artificial neural networks in Isfahan City of Iran. Int. J. Hous. Markets Anal. 15 (1), 4–18 (2022).
Hu, X. & Zhong, M. Applied research on real estate price prediction by the neural network. 2nd Conf. on Environ. Sci. & Info. Appl. Tech., Article(5567321), 384–386. (2010).
Shen, L. & Tang, A. A method of real estate market comparison approach appraisal based on neural networks. Syst. Engineering-Theory Pract. 18 (5), 52–55 (1998). (in Chinese).
Gao, M. & Zhang, R. Analysis of house price prediction based on genetic algorithm and BP neural network. Comput. Eng. 40 (4), 187–191 (2014). (in Chinese).
Sun, Z. & Zhang, J. Research on prediction of housing prices based on GA-PSO-BP neural network model: evidence from chongqing, China. Int. J. Found. Comput. Sci. 33 (06n07), 805–818 (2022).
Antipov, E. A. & Pokryshevskaya, E. B. Mass appraisal of residential apartments: an application of random forest for valuation and a CART-based approach for model diagnostics. Expert Syst. Appl. 39 (2), 1772–1778 (2012).
Ding, Y. & Cao, H. Housing prices evaluation using random forest algorithm combing with simulated annealing. Appl. Res. Comput. 37 (03), 784–788 (2020). (in Chinese).
Adetunji, A. B. et al. House price prediction using random forest machine learning technique. Procedia Comput. Sci. 199, 806–813 (2022).
Li, Z., Li, J. & Ji, W. Discriminant analysis and prediction of house prices based on support vector machines. J. Hubei Normal Univ. Nat. Sei. 31, 60–65 (2011).
Dong, Q., Sun, N. & Li, W. Real estate price prediction based on web search data. Stat. Res. 31 (10), 81–88 (2014).
Gu, J., Zhu, M. & Jiang, L. Housing price forecasting based on genetic algorithm and support vector machine. Expert Syst. Appl. 38 (4), 3383–3386 (2011).
Zhan, B. Land value appraisal based on machine learning. J. Syst. Sci. Math. Sci. 43 (4), 841–857 (2023). (in Chinese).
Kim, J., Won, J., Kim, H. & Heo, J. Machine-learning-based prediction of land prices in seoul, South Korea. Sustainability 13 (23), 13088 (2021).
Li, S., Jiang, Y., Ke, S., Nie, K. & Wu, C. Understanding the effects of influential factors on housing prices by combining extreme gradient boosting and a hedonic price model (XGBoost-HPM). Land 10 (5), 533 (2021).
Wang, H., Luo, P. & Zhang, J. A new appraisal model for urban land benchmark price based on deep learning. China Land. Sci. 32 (9), 59–65 (2018). (in Chinese).
Shen, H., Li, L., Zhu, H., Liu, Y. & Luo, Z. Exploring a pricing model for urban rental houses from a geographical perspective. Land 11 (1), 4 (2021).
Wang, P. Y., Chen, C. T., Su, J. W., Wang, T. Y. & Huang, S. H. Deep learning model for house price prediction using heterogeneous data analysis along with joint self-attention mechanism. IEEE Access. 9, 55244–55259 (2021).
Zhang, P., Hu, S., Yang, S. & Cheng, P. Modeling urban residential land price distribution using multi-source data and ensemble learning: Acase of Wuhan Citt. Progress Geogr. 40 (10), 1664–1677 (2021). (in Chinese).
Shi, D., Guan, J., Zurada, J. & Levitan, A. S. Predicting home sale prices: A review of existing methods and illustration of data stream methods for improved performance. Wiley Interdisc. Rev. Data Min. Knowl. Discov. 12(2), e1435 (2022).
Yan, L., Hong, K., Chen, K., Li, H. & Liao, L. Benefit distribution of collectively-owned operating construction land entering the market in rural china: A multiple principal–agent theory-based analysis. Habitat Int. 109, 102328 (2021).
Zou, Y., Zhao, W. & Mason, R. Marketization of collective-owned rural land: A breakthrough in Shenzhen. China Sustain. 6 (12), 9114–9123 (2014).
Wang, X. On the distribution of proceeds from the transfer of rural collective operating construction land to the market. Rural Econ. 10, 3–7 (2014). (in Chinese).
Wang, X., He, M. & Gao, Y. An empirical study on land revenue distribution in agricultural land conversion in China——an analysis based on a sample survey in Kunshan. J. Manage. World. 10, 88–95 (2006). (in Chinese).
Derdouri, A. & Murayama, Y. A comparative study of land price Estimation and mapping using regression kriging and machine learning algorithms across Fukushima prefecture, Japan. J. Geog. Sci. 30, 794–822 (2020).
Jafary, P., Shojaei, D., Rajabifard, A. & Ngo, T. Automated land valuation models: A comparative study of four machine learning and deep learning methods based on a comprehensive range of influential factors. Cities 151, 105115 (2024).
Yan, H., Wang, J. & Sun, J. How does the entry of collective construction land into the market affect the State-Owned construction land market. J. Quant. Technological Econ. 40 (06), 195–216 (2023). (in Chinese).
Wang, L. & Xu, C. Research on market comparative valuation of Collectively-owned business construction land. J. Chizhou Univ. 34 (01), 69–71 (2020). (in Chinese).
Lee, H., Han, H., Pettit, C., Gao, Q. & Shi, V. Machine learning approach to residential valuation: A convolutional neural network model for geographic variation. Ann. Reg. Sci. 72 (2), 579–599 (2024).
Acknowledgements
We extend our heartfelt gratitude to the editors and anonymous reviewers whose invaluable support and insightful suggestions significantly contributed to this work.
Funding
National Natural Science Foundation of China (NSFC): Study on the Evolution of Land Morphology of Sino-Vietnamese Estuarine Delta in terms of Siltation and Dilution and Borderland Security (42261043); NSFC: Study on the Influencing Effects and Mechanisms of Changes in Land Morphology of Sino-Vietnamese Boundary Rivers on the Security of the Land Boundary (42361047); Project of the Central Government Guiding the Local Funds for Science and Technology Development: Study on the Explicit/Hidden Processes of Borderland Loss in Sino-Vietnamese Estuarine Delta and its Driving Mechanisms Research (Gui Ke ZY23055016); This study was funded by the 19th Student Research Project of Jiangxi University of Finance and Economics (20241129113559984).
Author information
Authors and Affiliations
Contributions
Author contributionsL. H (Co-first author) and S. L (Co-first author) completing the manuscript, building the machine learning model and interpreting and analyzing the results; W. Z (Co-first author) and B. W fieldwork, data acquisition, and funding acquisition; S. D compilation of datasets, creation of maps and visualization of results. Y. W Verification and inspection. All authors have read and agreed to the published version of the manuscript. L.H and S. L are co-corresponding authors.
Corresponding authors
Ethics declarations
Competing interests
The authors declare no competing interests.
Additional information
Publisher’s note
Springer Nature remains neutral with regard to jurisdictional claims in published maps and institutional affiliations.
Rights and permissions
Open Access This article is licensed under a Creative Commons Attribution-NonCommercial-NoDerivatives 4.0 International License, which permits any non-commercial use, sharing, distribution and reproduction in any medium or format, as long as you give appropriate credit to the original author(s) and the source, provide a link to the Creative Commons licence, and indicate if you modified the licensed material. You do not have permission under this licence to share adapted material derived from this article or parts of it. The images or other third party material in this article are included in the article’s Creative Commons licence, unless indicated otherwise in a credit line to the material. If material is not included in the article’s Creative Commons licence and your intended use is not permitted by statutory regulation or exceeds the permitted use, you will need to obtain permission directly from the copyright holder. To view a copy of this licence, visit http://creativecommons.org/licenses/by-nc-nd/4.0/.
About this article

Cite this article
Zhang, W., Huang, L., Lu, S. et al. Batch evaluation of collective owned commercialised construction land using machine learning. Sci Rep 15, 28884 (2025). https://doi.org/10.1038/s41598-025-11958-z
Received:
Accepted:
Published:
Version of record:
DOI: https://doi.org/10.1038/s41598-025-11958-z
