
Abstract
Studies on the association between body mass index (BMI) and dental caries among adults are limited. Moreover, individuals with a high BMI may be either physically active or inactive, but the impact of these combinations on dental caries remains unexplored. In this study, we aimed to investigate the associations between BMI, its combination with physical activity (PA), and dental caries in the adult population. We conducted a cross-sectional analysis using data from Norwegian HUNT4 Oral Health Survey (2017–2019). BMI was categorized as < 25.0 (normal), 25.0–29.9 (overweight), or ≥ 30.0 kg/m2 (obese). The combination of BMI and PA was classified into 4 groups: (1) normal weight and active; (2) normal weight and inactive; (3) overweight-obese and active; and (4) overweight-obese and inactive. Main outcomes included the total number of decayed, missing, and filled teeth (D3MFT) and decayed teeth (D3T), while missing and sound teeth were secondary outcomes. Ratios of means (RM) with 95% confidence intervals (CI) were calculated using negative binomial regression. Effect modification by age (< 65 vs. ≥ 65 years) was assessed via the likelihood ratio test. We included 4752 individuals with a mean age of 51.9 years (SD 15.9). Compared to individuals with BMI < 25 kg/m2, those with BMI ≥ 30.0 kg/m2 was associated with an increased mean number of D3MFT (adjusted RM: 1.10, 95% CI 1.07–1.13), D3T (1.19, 95% CI 1.07–1.32), and missing teeth (1.11, 95% CI 1.00–1.22), but inversely with sound teeth (0.96, 95% CI 0.92–0.99). No combined effect of BMI and PA was observed. The association between BMI and dental caries was modified by age, with an association observed in individuals under 65 years (Plikelihood ratio test < 0.001). We observed that a higher BMI was associated with a higher dental caries experience and missing teeth. However, there was no evidence of a combined effect between BMI and PA on dental caries.
Introduction
Dental caries is the most common non-communicable disease globally1,2. Nearly 2.3 billion individuals were reported to have untreated caries in the permanent dentition according to a recent Global Burden of Disease Study3. Although oral health has improved over the last four decades in Norway, dental caries is still prevalent among adults4. It is a leading cause of tooth loss, significantly diminishing quality of life and posing a considerable economic and public health challenge5.
Obesity, as measured by body mass index (BMI), is often linked to high sugar consumption and lower socioeconomic status, both of which are also important risk factors for the development of dental caries6,7,8. On the other hand, obesity has been reported to be associated with chronic inflammation, which may impact oral health among other diseases, including dental caries9. Moreover, individuals with obesity may experience changes in salivary flow or composition, potentially increasing their susceptibility to dental caries10, suggesting a potential link between obesity and dental caries.
Few studies have examined the associations between BMI and dental caries in adult populations11,12,13,14,15, and those have generally reported inconsistent findings. Some studies have found a positive association11 while others have reported no12,13, inverse association14 or U-shaped pattern15. Given the limited number of studies examining this association in adults, we believe that further research is needed.
In addition to BMI, research suggests that physical activity (PA) may also influence oral health16. Individuals with high BMI can vary widely in their physical activity levels; some may remain active despite excess weight, while others are largely inactive. Those who are both overweight/obese and physically inactive tend to exhibit most sedentary behaviors and related metabolic risks compared to those with only one of these risk factors17,18,19. Sedentary behavior has been associated with metabolic dysregulation, systemic inflammation, and immune dysfunction20,21,22, all of which may contribute to increased susceptibility to oral diseases, including dental caries.
Given that both obesity and physical inactivity are independently associated with caries related mechanisms such as poor dietary patterns, chronic inflammation, and reduced salivary function, we hypothesize that their combination may have a synergistic effect on the prevalence of dental caries. In this context, a synergistic effect implies that the co-occurrence of high BMI and low PA is associated with a higher prevalence of caries than would be expected from the sum of their individual effects. However, to our knowledge, no previous studies have examined the combined effect of BMI and PA on dental caries in the adult population.
Therefore, this study aimed to investigate the cross-sectional associations between BMI and dental caries in a general Norwegian adult population. Further, we explored the combined effect of BMI and PA on dental caries prevalence and assessed whether these associations were modified by age.
Methods
Study population
The HUNT Study is a large, population-based health study that has been conducted in four phases: HUNT1 (1984–1986), HUNT2 (1995–1997), HUNT3 (2006–2008), and HUNT4 (2017–2019) in Trøndelag County, Norway23,24. All adults aged 20 years or older were invited to complete general self-reported questionnaires on socio-demographics, lifestyle factors, clinical conditions/diseases, and underwent clinical examinations23,24.
A sub-study on oral health was conducted as part of the HUNT4 survey. A random sample of 7347 adults from HUNT4 (20% of the population) was invited to participate in the HUNT4 Oral Health Study4,23. Participants in the HUNT4 Oral Health study were aged ≥ 20 years. Among them, 4929 adults underwent clinical and radiographic examinations for dental caries (Fig. 1). Edentulous individuals were excluded (n = 32). Additionally, individuals with missing information on study exposures, such as BMI (n = 12) and PA (n = 114), were excluded, resulting in a final study population of 4752 adults. This sample provides a representative subset of the general adult population in Trøndelag County.
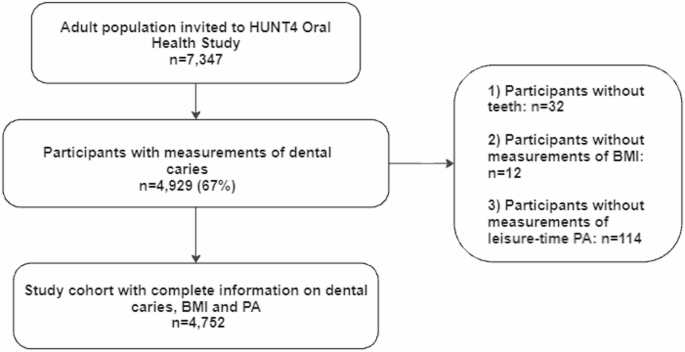
Flow chart of the study population.
Exposures
Measurements of BMI
In all the HUNT surveys, body weight and height were measured by health professionals at the time of clinical examination. Height was measured to the nearest centimeters, and weight was measured to the nearest 0.5 kg. BMI was calculated as weight in kilograms divided by height squared in meters (kg/m2). Following the WHO recommendation, BMI was further categorized into underweight (< 18.5 kg/m2), normal weight (18.5–24.9 kg/m2), overweight (25–29.9 kg/m2), and obese (≥ 30 kg/m2)25. Due to the small number of underweight individuals (n = 36), the underweight and normal weight categories were combined into a single group.
Combination of BMI and PA.
In all the HUNT surveys, PA was self-reported average leisure-time PA based on questions about frequency, intensity, and duration: Question (1) “How frequently do you exercise?” with response scores of ‘never’ (0), ‘less than once a week’ (0.5), ‘once a week’1, ‘two to three times per week’ (2.5), and ‘almost every day’5. Question (2) “If you do such exercise as frequently as once or more times a week, how hard do you push yourself ?” with response scores of ‘I take it easy, I don’t get out of breath or break a sweat1, ‘I push myself until I’m out of breath and break into a sweat’2 and ‘I practically exhaust myself’3 and Question (3) “How long does each session last?’ with response scores of ‘less than 15 min’ (0.1), ‘15–29 min’ (0.38), ‘30 min to 1 h’ (0.75), and ‘more than 1 h’ (1.0). We calculated a PA summary score (PAS) by multiplying each participant’s score on the three questions. We chose to categorize physical activity based on the PAS, following the approach used in the previous HUNT study. This PAS was suggested to be reliable and valid26. The individuals who responded as never or less than once a week for the frequency of PA were those with no PA (PAS = 0). The remaining individuals were categorized into low PA (0 < PAS ≤ 1.90), medium PA (1.91 ≤ PAS ≤ 3.75), and high PA (3.76 ≤ PAS ≤ 15.00) based on tertile values of the PAS27. The individuals with no and low PA were further regarded as physically inactive, whereas individuals with moderate to high PA were regarded as active. We further classified the combination of BMI and PA into four groups: a) normal weight and physically active; b) normal weight and physically inactive; c) overweight/obese and physically active; and d) overweight/obese and physically inactive.
Outcome
Information on dental caries was extracted from The HUNT4 Oral Health Study. In brief, trained and calibrated dentists or dental hygienists registered all individuals’ caries experience via both clinical and radiographic bitewing examinations. Cohen’s kappa values for inter-examiner agreement during the clinical examinations ranged from 0.71 to 0.91 across the different field stations, indicating substantial to almost perfect agreement. Additionally, repeated evaluations of a standardized set of clinical intra-oral photographs were conducted at the beginning (kappa = 0.82) and later in the data collection period (kappa = 0.85) to assess inter-examiner reliability. Intra-examiner agreement, based on the same set of photographs, yielded kappa values ranging from 0.79 to 0.93. For radiographic caries assessment, inter-examiner reliability showed kappa values of 0.87 and 0.84 in the first and second calibration sessions, respectively, while intra-examiner reliability ranged from 0.84 to 0.87. A more detailed description for training and calibration of examiners has been published previously4.
Dental Caries was classified using the system developed by Amarante (1998)28, which is the standard diagnostic classification taught in all dental schools in Norway and commonly used in clinical practice. This system grades carious lesions on a scale from 1 to 5, based on visual and radiographic criteria. Grade 1 indicates discoloration without substance loss and no radiographic findings, while Grade 2 involves minimal enamel breakdown or caries confined to the enamel. In this study, we included only dentine caries, defined as Grades 3 to 5: lesions with moderate to severe substance loss and radiographic evidence of caries extending into the outer, middle, or inner third of the dentin. This corresponds to the WHO D3 threshold for cavitated dentine lesions. The total dental caries experience, number of decayed, missing, and filled teeth (D3MFT), was regarded as the main outcome. Number of teeth with untreated dentine caries (D3T) were defined as teeth with primary or secondary caries in dentine (caries registration grades 3–5) and root caries with cavitation4, based on clinical examination and bitewing radiographs4,28 and regarded as another main outcome. The missing teeth (MT) referred to all missing teeth regardless of the reason4. The filled teeth (FT) were restored teeth without secondary caries and include all types of filling materials and crowns4. In addition, the number of sound teeth (ST) were calculated and characterized by the absence of initial or dentine caries, filling and/or other restorations or bridge abutments28. Both MT and ST were used as secondary outcomes.
Covariates
All potential covariates in this study were collected via questionnaires at HUNT4. Age in years (continuous), sex (females, males), smoking status (never, former, and current), sugary drink intake (almost not, 1–6 glasses per week, and ≥ 2 per day).
Education and income level were categorized consistently with previous HUNT studies29,30. Education level, originally grouped in six categories from the questionnaire, was condensed into three groups (≤ 10 years, 11–14, and > 14 years) were included. Household years’ income before taxation, recorded in Norwegian Kroner (NOK), originally grouped into five categories in the questionnaire, were condensed into three groups (< 450,000 kr, 451,000-1000,000 kr and > 1000,000 kr). We used the original HUNT4 questionnaire categories for fruit intake and vegetable intake, each defined separately as: less than once, 1–3 times per week, 4–6 times per week, and daily. Based on these, we constructed a combined variable for ‘fruit or vegetable intake’ with three categories: ≤ 3 times per week, 4–6 times per week, and daily. Similarly, snus use ‘moist snuff’ was originally categorized as never, former, and current, but was recoded into two categories: ever users vs. never users. Diabetes status was assessed by asking, ‘Have you ever had, or do you currently have diabetes?’ with response options: Yes or No. Missing data for each variable were included in the analyses as an “unknown” category.
Statistical analysis
Descriptive statistics of the study individuals were provided, with means (SD) for continuous variables and frequencies (percentages) for categorical variables. The characteristics of the individuals were presented by BMI categories and by combinations of BMI and PA levels. We assessed the association between BMI levels, their combination with PA, and dental caries using negative binomial regression. To study the combined effect of BMI and PA on dental caries, four combined categories were constructed (normal weight and physically active as reference group, normal weight and physically inactive, overweight/obese and physically active, overweight/obese and physically inactive).
The ratio of means (RM) with 95% confidence intervals (CIs) was used to evaluate the associations. We employed negative binomial regression due to the count nature of the outcome variables and the potential for overdispersion31,32. In a cross-sectional setting, the mean number is increasing when RM > 1 while the mean number is decreasing when RM < 132. While assessing the association between exposure and outcome, the confounders were selected based on previous knowledge11,12,13,14,15. The adjusted model for the association between BMI and dental caries included the following confounders: age, sex, smoking status, sugary drink intake, PA, education level, and income level. We further examined the potential effect modification by age (< 65 vs. ≥ 65y) using the likelihood ratio test. Additionally, an alternative cut-off at age 55y was used to distinguish between the pre-fluoride and fluoride generations, reflecting differences in fluoride exposure during formative years, which may influence long-term oral health outcomes such as dental caries.
To test the robustness of the results, we: (i) further adjusted for additional confounders, including snus consumption (no, yes), fruit or vegetable intake (≤ 3 times per week, 4–6 times per week, and daily) and ever diabetes status (yes, no) for all the associations; (ii) used MT and ST as secondary outcomes; and (iii) redefined the combination groups into normal weight and active, normal weight and non-active, overweight/obese and non-active, and overweight/obese and active. All the statistical analyses were performed with STATA/SE 16.1 (College Station, TX, USA).
Results
A total of 4752 individuals with a mean age of 51.9 years (SD 15.9) were included in the study. Compared to individuals with a BMI < 25 Kg/m2, those with higher BMI (≥ 30.0 kg/m2, obese) were more likely to be smokers, less physically active, and less educated (Table 1).
The individuals who were overweight/obese and inactive seemed to be the oldest, had the highest proportion of former smokers, and generally had less education and low-income level (Table 2).
We observed positive associations between being overweight (RM, 1.19, 95% CI 1.15–1.23) and obese (RM, 1.20, 95% CI 1.16–1.24) with D3MFT, compared to individuals with a BMI < 25 kg/m2 in an unadjusted model (Table 3). After adjusting for confounders, the associations attenuated to an RM of 1.05 (95% CI 1.03–1.08) for overweight and 1.10 (95% CI 1.07–1.13) for obese individuals. The positive associations between BMI and D3T were slightly stronger than those for D3MFT, with RM of 1.15, 95% CI 1.05–1.26 for overweight, and 1.19, 95% CI 1.07–1.32 for the obese group in the adjusted model. Further, individuals with obesity had a higher mean number of MT, but a lower mean number of ST compared to individuals with normal weight.
Compared to individuals who were of normal weight and physically active, those who were of normal weight and physically inactive showed no difference in the mean number of D3MFT in the adjusted model (Table 4). However, similar higher RMs were observed for individuals who were overweight/obese and physically active (RM: 1.08, 95% CI 1.05–1.11) and overweight/obese and physically inactive (RM: 1.06, 95% CI 1.03–1.10).
Furthermore, compared to individuals who were of normal weight and physically active, those who were normal weight and physically inactive showed higher RM of D3T in the adjusted model. Among the groups, individuals who were overweight/obese and inactive appeared to have the highest RM of D3T. Additionally, individuals who were of normal weight and physically inactive had the highest RM for MT, while those who were overweight/obese and physically inactive had the lowest RM for ST.
There was statistical evidence of effect modification by age (P likelihood ratio test <0.001). A stronger association between BMI and D3MFT was observed only among individuals younger than 65 years, while no associations were found among those ≥ 65 years (Table 5). Similar results were observed when D3T was used as the outcome (see Supplementary Table 3. Notably, the results did not change when we used an alternative cut-off at age 55-year threshold, suggesting that the observed trends were robust across both age definitions.
When we performed sensitivity analysis with additional adjustments for confounders such as snus users, fruit or vegetable intake, and diabetes status, the results remained consistent with those of our main analyses. Furthermore, when we redefined the combined groups, classifying no PA as inactive and any PA from low to high as active, the results remained similar for D3MFT, D3T, MT, and ST (Supplementary Table S1).
Discussion
In this population-based cross-sectional study of Norwegian adults, we observed a positive association between BMI and dental caries experience, especially pronounced for untreated caries. However, no combined effect of BMI and PA on dental caries experience was observed. Additionally, age seemed to modify the association, with positive associations only observed in individuals less than 65 years old.
In line with our findings, a cross-sectional study from Australia (including 3,745 individuals aged 15–91 years) suggested a positive association between BMI and D3MFT11. Another study from Israel, including 66,790 adults aged between 18 and 50 years, suggests that both underweight and overweight/obese to be associated with a higher prevalence of D3T, suggesting a non-linearly U-shaped pattern15. In contrast, an inverse association was observed in a cross-sectional study conducted by Song et al., including 16,129 Korean adults aged 19 years and older14. Another cross-sectional study using data from 8144 U.S. adults aged over 20 years from the pre-pandemic cycle of the National Health and Nutrition Examination Survey (NHANES) found no association between BMI and dental caries13 This discrepancies in findings suggests that the association relationship between BMI and dental caries in adults is complex and may be influenced by factors such as dietary habits, healthcare access, cultural practices, or genetic predispositions in different populations. Notably, it is important to account for sugar consumption when examining the association between BMI and dental caries, as it plays a pivotal role in both obesity and caries development11. However, the study by Song et al. did not consider sugar consumption, potentially introducing confounding bias14, which may explain the finding of an inverse association. In our study, we accounted for key confounders, including sugary drink intake, ensuring a more accurate analysis. Additionally, we employed detailed and reliable measures of dental caries, capturing both total dental caries experience and untreated dentine caries. To further validate our findings, we used MT and ST as secondary outcomes. Consistent with our findings, studies by Hilgert et al.33 and Prpić et al.34 also reported that a greater number of MT was associated with higher BMI. The consistency across various dental caries outcomes underscores the significant role of BMI in dental caries development.
Notably, we observed a stronger positive association between BMI and dental caries in individuals younger than 65 years, whereas no association was found in elderly individuals. This difference may be attributed to age-related metabolic and physiological changes35,36. Evidence suggests that obesity is more strongly linked to metabolic conditions, such as insulin resistance and systemic inflammation, in younger adults compared to elderly individuals36. These metabolic conditions might alter immune responses and susceptibility to infections, including dental caries. On the other hand, the possibility of a reverse relationship, where high caries experience may affect metabolic conditions through altered nutritional and dietary patterns, cannot be ruled out. Furthermore, age-related physiological changes, such as shifts in salivary composition and flow rate, may primarily explain the observed variation in the association between BMI and dental caries by age37. Furthermore, no combined effect of BMI and PA on dental caries experience was found in our study. Specifically, the most sedentary group, those who were overweight or obese and physically inactive, did not exhibit the highest RM of D3MFT and MT. However, PA was inversely associated with untreated caries (Supplementary Table S2), a finding consistent with some previous observational studies16,38,39.
Physical activity has been associated with healthier lifestyle behaviors, such as improved dietary habits and better oral hygiene practices, which may contribute to a lower number of decayed teeth16,39. However, our study did not observe a direct association between PA and D3MFT, indicating that while PA may influence caries development, other factors, such as dietary sugar intake, oral hygiene practices, and access to dental care, likely play significant roles. This underscores the multifactorial nature of dental caries and the need for further research to explore these interactions.
Our study has several strengths. First, the HUNT Study is one of the largest population health-based studies in Norway. By focusing on a general Western population, its findings are more directly comparable to similar populations, enhancing the generalisability of the results. Second, dental caries experience was evaluated based on detailed clinical and radiographic examinations. In addition, we assessed MT and ST as secondary outcomes. These reduce misclassification of the outcome variables and provide a more accurate assessment of the dental caries burden. Third, we adjusted for important confounders, including lifestyle factors (smoking), socioeconomic indicators (education and income), and weekly sugary drink intake. This allowed for more robust control of confounding bias compared to the previous studies14,15.
This study has several limitations. First, since this is a cross-sectional study, we cannot establish a temporal association between exposure and the outcome. Second, selection bias may exist since participating individuals were generally healthier than non-participating individuals in the HUNT Study24. In addition, the HUNT4 Oral Health Study reported an overrepresentation of individuals with higher education4, which may have led to an underestimation of the mean number of teeth with dental caries in the study. Since this underestimation was likely nondifferential, the effect estimates for the association between BMI and dental caries may be attenuated, suggesting that the true strength of the association could be stronger than reported. Third, the variable on PA (frequency, duration, intensity) was self-reported, and misclassification might exist. However, the reliability and validity of the HUNT questionnaire for PA has been investigated, and a good correlation between the questionnaire of PA and object measurement, such as maximum oxygen uptake, was reported26.
Conclusion
BMI was suggested to be positively associated with dental caries. However, no combined effect of BMI and PA was found on dental caries. Further studies with larger sample sizes and longitudinal designs accounting for a broad range of confounders are needed to replicate our findings and explore this association comprehensively.
Data availability
“Data from the HUNT Study is available upon request to the HUNT Data Access Committee (hunt@ medisin.ntnu.no) when is used in research projects. The HUNT data access information describes the policy regarding data availability (https://www.ntnu.edu/hunt/data)”.
Abbreviations
- BMI:
-
Body mass index
- CI:
-
Confidence interval
- D3−MFT:
-
Decayed teeth, missing teeth and filled teeth
- D3T:
-
Decayed teeth
- FT:
-
Filled teeth
- HUNT:
-
The Trøndelag Health Study
- MT:
-
Missing teeth
- RM:
-
Ratio of means
- PA:
-
Physical activity
- PAS:
-
Physical activity summary score
- ST:
-
Sound teeth
- WHO:
-
World Health Organization
References
Peres, M. A. et al. Oral diseases: A global public health challenge. The Lancet 394(10194), 249–260 (2019).
Issrani, R. et al. Exploring an association between body mass index and oral health—A scoping review. Diagnostics. 13(5), 902 (2023).
Collaborators, G. O. D. et al. Global, regional, and national levels and trends in burden of oral conditions from 1990 to 2017: A systematic analysis for the global burden of disease 2017 study. J. Dent. Res. 99(4), 362–373 (2020).
Rødseth, S. C., Høvik, H., Schuller, A. A., Bjertness, E. & Skudutyte-Rysstad, R. Dental caries in a Norwegian adult population, the HUNT4 oral health study; prevalence, distribution and 45-year trends. Acta Odontol. Scand. 81(3), 202–210 (2023).
Gerritsen, A. E., Allen, P. F., Witter, D. J., Bronkhorst, E. M. & Creugers, N. H. Tooth loss and oral health-related quality of life: A systematic review and meta-analysis. Health Qual. Life Outcomes 8, 1–11 (2010).
Pitts, N. B. et al. Dental caries. Nat. Rev. Dis. Primers. 3(1), 1–16 (2017).
Stangvaltaite-Mouhat, L., Furberg, A.-S., Drachev, S. N. & Trovik, T. A. Common social determinants for overweight and obesity, and dental caries among adolescents in Northern Norway: A cross-sectional study from the Tromsø Study Fit Futures cohort. BMC Oral Health 21, 1–12 (2021).
Sheiham, A. Dietary effects on dental diseases. Public Health Nutr. 4(2b), 569–591 (2001).
Goodson, J. M. et al. Obesity and dental decay: Inference on the role of dietary sugar. PLoS ONE 8(10), e74461 (2013).
Touger-Decker, R. & van Loveren, C. Sugars and dental caries. Am. J. Clin. Nutr. 78(4), 881s-s892 (2003).
Barrington, G. et al. Obesity, dietary sugar and dental caries in Australian adults. Int. Dent. J. 69(5), 383–391 (2019).
Idrees, M., Hammad, M., Faden, A. & Kujan, O. Influence of body mass index on severity of dental caries: Cross-sectional study in healthy adults. Ann. Saudi Med. 37(6), 444–448 (2017).
Kabbarah, A. J. et al. Association between obesity and dental caries in adults: An analysis of WHR, and DMFT score. Obes. Facts 18(1), 39–47 (2025).
Song, I. S., Han, K., Ryu, J. J. & Park, J. B. Obesity is inversely related to the risks of dental caries in Korean adults. Oral Dis. 23(8), 1080–1086 (2017).
Ben-Assuli, O. et al. Body mass index and caries: Machine learning and statistical analytics of the dental, oral, medical epidemiological (DOME) nationwide big data study. Metabolites 13(1), 37 (2022).
Das, A., Menon, I., Kumar, G., Singh, A. & Jha, K. Impact of physical activity on oral health: A systematic review. J. Family Med. Primary Care 14(4), 1161–1168 (2025).
Ekelund, U. et al. Does physical activity attenuate, or even eliminate, the detrimental association of sitting time with mortality? A harmonised meta-analysis of data from more than 1 million men and women. The Lancet. 388(10051), 1302–1310 (2016).
Wijndaele, K. et al. Television viewing time independently predicts all-cause and cardiovascular mortality: The EPIC Norfolk study. Int. J. Epidemiol. 40(1), 150–159 (2011).
Edwardson, C. L. et al. Association of sedentary behaviour with metabolic syndrome: A meta-analysis. PLoS ONE 7(4), e34916 (2012).
Booth, F. W., Roberts, C. K. & Laye, M. J. Lack of exercise is a major cause of chronic diseases. Compr. Physiol. 2(2), 1143 (2012).
Wu, X. et al. Sedentary behavior is associated with systemic immune-inflammation index and systemic inflammation response index levels: A cross-sectional analysis of the NHANES 2011–2018. Front. Public Health 13, 1431065 (2025).
Allison, M. A., Jensky, N. E., Marshall, S. J., Bertoni, A. G. & Cushman, M. Sedentary behavior and adiposity-associated inflammation: The multi-ethnic study of atherosclerosis. Am. J. Prev. Med. 42(1), 8–13 (2012).
Krokstad, S. et al. Cohort profile: The HUNT study. Norway Int. J. Epidemiol. 42(4), 968–977 (2013).
Åsvold, B. O. et al. Cohort profile update: The HUNT study. Norway Int. J. Epidemiol. 52(1), e80–e91 (2023).
World Health Organization. Obesity: Preventing and Managing the Global Epidemic: Report of a WHO Consultation. (2000).
Kurtze, N., Rangul, V., Hustvedt, B.-E. & Flanders, W. D. Reliability and validity of self-reported physical activity in the Nord-Trøndelag Health Study—HUNT 1. Scand. J. Public Health 36(1), 52–61 (2008).
Garnvik, L. E. et al. Physical activity modifies the risk of atrial fibrillation in obese individuals: The HUNT3 study. Eur. J. Prev. Cardiol. 25(15), 1646–1652 (2020).
Amarante, E., Raadal, M. & Espelid, I. Impact of diagnostic criteria on the prevalence of dental caries in Norwegian children aged 5, 12 and 18 years. Commun. Dent. Oral Epidemiol. 26(2), 87–94 (1998).
Rødseth, S. C., Høvik, H., Bjertness, E. & Skudutyte-Rysstad, R. Exploring socioeconomic inequality in caries experience in an adult Norwegian population; the HUNT4 oral health study. Commun. Dent. Oral Epidemiol. 52(5), 690–698 (2024).
Stødle, I., Sen, A., Høvik, H., Verket, A. & Koldsland, O. C. Association between periodontitis stages and self-reported diseases in a Norwegian population: The HUNT study. BMC Oral Health 23, 999 (2023).
McElduff, F., Cortina-Borja, M., Chan, S.-K. & Wade, A. When t-tests or Wilcoxon-Mann-Whitney tests won’t do. Adv. Physiol. Educ. 34(3), 128–133 (2010).
Fekedulegn, D. et al. Comparison of statistical approaches to evaluate factors associated with metabolic syndrome. J. Clin. Hypertens. 12(5), 365–373 (2010).
Hilgert, J. B., Hugo, F. N., Sousa, Md. LRd. & Bozzetti, M. C. Oral status and its association with obesity in Southern Brazilian older people. Gerodontology 26(1), 46–52 (2009).
Prpić, J., Kuiš, D. & Pezelj-Ribarić, S. Obesity and oral health–Is there an association? Coll. Antropol. 36(3), 755–759 (2012).
Paolisso, G., Barbieri, M., Bonafè, M. & Franceschi, C. Metabolic age modelling: The lesson from centenarians. Eur. J. Clin. Invest. 30(10), 888–894 (2000).
Canning, K. L., Brown, R. E., Jamnik, V. K. & Kuk, J. L. Relationship between obesity and obesity-related morbidities weakens with aging. J. Gerontol. Ser. A 69(1), 87–92 (2013).
Rahiotis, C., Petraki, V. & Mitrou, P. Changes in saliva characteristics and carious status related to metabolic control in patients with type 2 diabetes mellitus. J. Dent. 108, 103629 (2021).
Huttunen, M. et al. The association between dental caries and physical activity, physical fitness, and background factors among Finnish male conscripts. Odontology 111(1), 192–200 (2023).
Medapati, A. R. & Pachava, S. Effect of physical activity on oral health: A systematic review. J. Indian Assoc. Public Health Dentistry 20(2), 125–130 (2022).
Acknowledgements
“This project was inspired from a Master thesis project led by Neda Kordy. We would like to acknowledge Dr. Arezo Ahmadpour for assisting Neda Kordy in the thesis activity as in-kind contribution. The HUNT Study is a collaboration between The HUNT Research Centre (Faculty of Medicine and Health Sciences, Norwegian University of Science and Technology - NTNU), Nord-Trøndelag County Council, Central Norway Regional Health Authority and the Norwegian Institute of Public Health.”
Funding
Open access funding provided by NTNU Norwegian University of Science and Technology (incl St. Olavs Hospital - Trondheim University Hospital). Open access funding provided by NTNU Norwegian University of Science and Technology (incl St. Olavs Hospital - Trondheim University Hospital). We received partial funding support from Stiftelsen til tannlegevitenskapens fremme. The salary of LJ was supported by TkMidt-Center for Oral Health Services and Research.
Author information
Authors and Affiliations
Contributions
LJ conducted the statistical analyses, prepared figures and tables, interpreted the results and wrote the first draft of the manuscript. LB contributed to the statistical analyses. AS helped in data acquisition, contributed to the concept and design, supervised the study and assisted in statistical analyses plan. RSR contributed to the collection and assessment of caries data. LSM and RSR contributed their expertise in Cariology to developing the manuscript. NK, AS, AM, LSM and RSR participated in the data interpretation, contributed to the manuscript writing with important intellectual content. All authors approved the final version of the manuscript.
Corresponding author
Ethics declarations
Competing interests
Abhijit Sen is one the Editorial board of Nature Scientific Report Journal.
Ethics approval
The study was approved by the Regional Committee for Medical and Health Research Ethics of Southeast Norway (application number: 138564). All individuals signed informed written consent upon participation in HUNT. The HUNT4 was conducted in compliance with the relevant guidelines and regulations. The study was performed in accordance with the ethical standards as laid down of the 1964 Declaration of Helsinki and its later amendments or comparable ethical standards.
Consent for publication
Not applicable.
Additional information
Publisher’s note
Springer Nature remains neutral with regard to jurisdictional claims in published maps and institutional affiliations.
Rights and permissions
Open Access This article is licensed under a Creative Commons Attribution 4.0 International License, which permits use, sharing, adaptation, distribution and reproduction in any medium or format, as long as you give appropriate credit to the original author(s) and the source, provide a link to the Creative Commons licence, and indicate if changes were made. The images or other third party material in this article are included in the article’s Creative Commons licence, unless indicated otherwise in a credit line to the material. If material is not included in the article’s Creative Commons licence and your intended use is not permitted by statutory regulation or exceeds the permitted use, you will need to obtain permission directly from the copyright holder. To view a copy of this licence, visit http://creativecommons.org/licenses/by/4.0/.
About this article

Cite this article
Jiang, L., Kordy, N., Myhr, A. et al. Body mass index, physical activity and dental caries: cross-sectional HUNT4 oral health study. Sci Rep 15, 28453 (2025). https://doi.org/10.1038/s41598-025-12282-2
Received:
Accepted:
Published:
Version of record:
DOI: https://doi.org/10.1038/s41598-025-12282-2
