
Abstract
Roads can form barriers to movement and act as mortality sinks for bats. However, understanding flight behaviour over roads has been limited by reliance on human observers to characterise flight patterns. Moreover, both species-specific behaviour and the local environment may alter bat-road interactions. Using paired near-infrared cameras with 3-D tracking analysis, we reconstructed the flight trajectories of barbastelle bats (Barbastella barbastellus) at nine road sites in West Sussex, England. Of the 400 flight paths, 56% occurred at heights that placed bats at risk of vehicle collision, and this risk increased as bats flew closer to canopy cover. Increasing canopy cover was associated with bats flying along rather than across roads, and with faster flight speeds (by 0.14 ms− 1 per 10% increase in canopy cover). Flight behaviour was not influenced by traffic density. These findings suggest that hop-overs, in which trees are planted to provide continuous canopy cover, may create an ecological trap by encouraging B. barbastellus to cross roads at unsafe heights. Our results also highlight the value of 3-D tracking to understand bat behaviour, an approach that could be applied to predict better the impact of road developments on bats and evaluate the effectiveness of mitigation in reducing collision risk.
Introduction
The road network is expanding rapidly across the world, with an expected increase from 45 to 70 million paved lane-kilometres between 2010 and 20501. In Europe, almost a quarter of all land area is within 500 m of the nearest paved road or railway2 and in the USA only 18% of the landscape is more than 1 km from a road3. There is widespread evidence for the negative effects of roads on biodiversity. Roads represent one of the major causes of habitat fragmentation, loss of landscape connectivity, genetic differentiation, and mortality for wildlife populations4,5,6. Moreover, the influence of roads at the landscape-scale (i.e., the road effect-zone) can extend many kilometres beyond the immediate boundaries of the road network7,8,9.
Bats possess several life-history traits which make them vulnerable to various threats, including roads. These traits, which are often associated with much larger species, include a low fecundity, long life span, and large home range10,11. Due to their low reproductive rate, bat populations are limited in their ability to respond to mortality threats11, whilst the use of multiple geographically separated locations for foraging, mating, hibernating, and breeding increases their encounters with roads. Many bat species fly at heights that bring them into the path of vehicles, particularly when commuting between roosts and foraging sites. Consequently, roads have been identified as being one of the major threats to bat conservation, serving as mortality sinks and acting as a potential barrier to flight between roosts and foraging sites12,13,14. Bat fatalities from vehicle collisions on roads have been well documented15,16,17,18,19,20,21,22,23,24,25, revealing a notable bias towards low-flying species, males, and juveniles13. For instance, observations in Poland over a four-year period recorded between 0.3 and 6.8 bat casualties per kilometre per year, with the highest rates found where roads were bordered by trees19. However, these figures likely underestimate true mortality due to limited searcher efficiency26 and rapid carcass removal by scavengers27. After adjusting for some of these biases, Russell et al.22. estimated that roadkill may account for up to 5% of a local Myotis lucifugus population in North America annually. Such levels of additive mortality, particularly when sustained over time, may have serious implications for the viability of slow-reproducing bat species.
The barbastelle bat (Barbastella barbastellus; Schreber, 1774) is an elusive bat species that is currently classified as ‘Vulnerable’ in both Great Britain28 and Europe29. It primarily roosts in mature, unmanaged woodlands, where dead and veteran trees provide the crevices and loose bark it requires for shelter30. Barbastella barbastellus is a long-distance forager, typically traveling 1–10 km from roosts and foraging in broadleaved woodland, riparian vegetation, and along forest edges31,32. These long-distance nightly movement means it is likely to encounter roads frequently. As an edge-adapted species, it also uses linear landscape features such as tree-lined roads for commuting and foraging33,34,35. However, it is difficult to assess the full extent of the risk that roads pose to the viability of B. barbastellus, owing to a lack of data on its population size. Nonetheless, the relatively high proportion of casualties recorded in numerous studies13 suggests that roads may represent a significant threat, especially given the rarity of the species and its limited reproductive output. Previous research indicates that B. barbastellus will cross motorways with heavy traffic during roost switching and, unlike other woodland species such as Myotis bechsteinii, is less reliant on underpasses for passage36. Barbastella barbastellus is adapted for foraging in open spaces and capable of both low- and high-altitude flight, which may contribute to the high number of casualties that have been reported. It has been suggested that the lack of road avoidance behaviour could increase their mortality risk if they fly at an inadequate height to avoid larger vehicles such as trucks36.
Whilst species-specific behaviour has a significant effect on the collision risk posed to bats on roads13, there are several other factors that may have an influence. These have the potential to alter bat behaviour, affecting the height, speed, and duration of time spent over roads by bats, as well as dictating the degree of avoidance behaviour. For example, Russell et al.22 reported that fewer individuals of the species Myotis sodalis crossed a major highway when canopy cover was lacking, but they crossed lower and closer to traffic when it was present. Similarly, Bennett and Zurcher37 found that if trees were absent or there were gaps greater than two metres along commuting routes, bats were more likely to turn around. This change in behaviour can significantly impact the risk of mortality, particularly when it is considered in the context of high-quality habitat for bats24.
Understanding how bats navigate along commuting routes is critical, especially considering how environmental features like tree cover affect their movement. Several studies have therefore aimed to characterise the flight height of bats over roads. These are usually based on human observations, sometimes employing surrounding objects as reference points22,37,38,39. However, both thermal and near-infrared cameras are increasingly being used to provide insights into bat behaviour, particularly in the ecological consultancy sector. For instance, Claireau et al.40 used a novel approach, combining the use of reference points with 2-D bat flight trajectory reconstructions, to infer height and assess the impact of a bat overpass installation. However, recent advances in tracking analysis and software availability have made the extraction of 3-D animal trajectories from videos much more accessible41,42,43. This technology has been driven in part by the need to better understand the impact of wind energy developments on bats44,45, and can provide accurate information on flight height, speed, and direction.
By employing near-infrared cameras in combination with 3-D tracking approaches, alongside acoustic recordings for species-level identification, this study digitally reconstructed the flight trajectories of B. barbastellus over roads. Building on the observations by Russell et al.22, which found that bats crossed a highway at greater heights in areas with increased canopy cover, we hypothesised that more canopy cover and a greater canopy height would lead to higher flight elevations and lower collision risk. Additionally, given that bats may perceive moving traffic as a threat12,38, we expected increased traffic density to result in bats flying higher and more directly over roads to minimise risk. Lastly, owing to the increased predation risk associated with open spaces46, we hypothesised that flight speed would be higher at road sites with less canopy cover. These hypotheses, grounded in broader bat ecology research, have not been explicitly tested in B. barbastellus, but align with the species’ known reliance on cluttered habitats and its sensitivity to anthropogenic disturbances.
Methods
Study sites
The study was conducted at nine sites in southern England between August and September 2020 (Fig. 1). These sites were selected for their proximity to two woodlands (The Mens and Ebernoe Common), which host well-documented maternity colonies of B. barbastellus. Both woodlands are designated Special Areas of Conservation (SACs), with the presence of B. barbastellus being cited as either the primary or qualifying feature. Given the extensive radio-tracking data available for these colonies, earlier studies had identified the locations of previously used roost trees, flightlines, and foraging areas47,48. Each study location was within 4 km of an occupied woodland and was positioned where previously known flightlines intersected roads, or where crossing points were predicted based on linear feature (i.e., treelines, unmanaged hedgerows) configuration leading from occupied woodlands. Preliminary surveys using acoustic bat detectors were conducted at each study location to verify the local and substantial presence of B. barbastellus. All sites were located on two-lane B-roads, with a mean width of 6.97 m (SD = 1.00 m), on straight sections where vehicles were allowed to drive up to 60 mph (96 kmph). Several features were avoided: (1) streetlights and urban areas, (2) motorways, and (3) water bodies other than small streams. A single road section at each site was surveyed for either three (n = 5) or four (n = 4) nights, with the aim of completing all surveys at a site within a 10-day period to optimise data collection whilst considering logistical and weather constraints. Surveys were only undertaken when the conditions complied with best practice guidelines for bat surveys in the UK (sunset temperature ≥ 10 °C, no rain or strong wind)49.
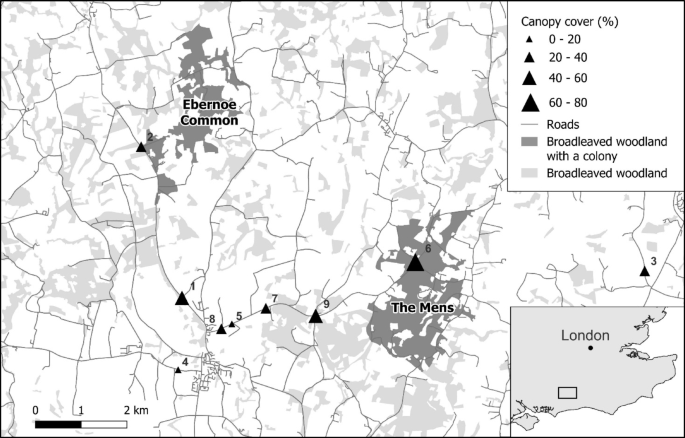
Location of the nine study sites in relation to woodlands occupied by known B. barbastellus colonies in the county of West Sussex, England. Canopy cover represents the percentage cover within a 20 m buffer around the centre of each site. Site ID numbers are shown next to each site marker. Map created using QGIS (v3.6.3-Noosa; https://www.qgis.org/).
Survey design
Road sections were filmed using one Canon XA11 and one XA20 camera (Canon, Japan), both capable of near-infrared recording, from 30 min after sunset until sunrise. All video was captured at 50 frames per second at 1920 × 1080 pixel resolution. Cameras were mounted on tripods and positioned on either side of the road, at a mean distance of 0.46 m (range: 0.28–0.77 m) from the road edge and at a mean height of 0.65 m (range: 0.60–0.80 m) (Fig. 2).
Each camera was paired with a primary light source; an infrared illuminator (LIR-IC88, 850 nm, IRLAB, Shenzhen, China) that had a range of 180 m and a lighting angle of 40°. These were placed approximately 5–10 m behind each camera to maximise the area lit and minimise any “blind spots” directly in front of the cameras. In addition, having the primary light sources placed in these positions helped minimise over-exposure of vegetation immediately in front of the cameras. In practice, bats were only clearly visible at distances up to approximately 50 m using these illuminators, therefore this was the maximum distance considered when deploying acoustic detectors. Secondary lighting (96 LEDS IR illuminator array, 850 nm, KKmoon, Shenzhen, China) was added along both sides of the road to improve illumination via uplighting. Six secondary lights were placed at “stations” between 25 and 50 m at each site (Fig. 2). Lighting was not added at shorter distances as the primary lighting provided sufficient illumination. Due to limitations in field-of-view caused by roadside vegetation, camera angles, and lighting coverage, this study focused on flight behaviour directly above the road surface, rather than over surrounding vegetation or roadside structures.

Overview of the 3-D tracking and acoustic survey set-up used to monitor bat flight behaviour over roads. (a) Top-down view of the field set-up. The small dashed lines represent the field of view (67.8° horizontally) of individual cameras, with the shaded area illustrating the combined field of view captured by both cameras. The large dashed lines represent the centre lane markings of the carriageway. Triangle = camera, circle = station, P = primary infrared light source. (b) An overview of the station set-up, consisting of a SM2BAT static detector with a SMX-U1 omni-directional microphone attached to a 5 m pole. A secondary infrared light source (S) was included at stations between 25–50 m.
Acoustic data were collected at study sites to facilitate species-specific identification of bats recorded on video cameras. These data were gathered at survey points along the 50 m section of road at each site using full-spectrum Song Meter SM2BAT static detectors with SMX-U1 omni-directional microphones (Wildlife Acoustics, Maynard, Massachusetts, USA). One detector was placed by each camera, with further detectors placed at stations 10 m apart along either side of the road (up to a maximum of 50 m), staggered by 5 m on opposite sides of the road (Fig. 2a). Microphones were placed approximately 1.5 m off the ground on 5 m tall metal poles at each station, and orientated horizontally towards the road. Reflective markers were spaced at 1 m intervals along the poles to serve as additional reference points for the extrinsic calibration. Where it was not possible to deploy a detector at the specified distance due to an intersecting road (n = 3 sites), it was either placed at the next nearest point or removed. Detector numbers deployed therefore ranged between 10 and 12 per site. Detectors were programmed to record from sunset until sunrise, using the following settings: sampling rate = 364 kHz; trigger level = 18 SNR; trig window = 2.0 s; gain = 12 dB; high-pass filter = 4 kHz; low-pass filter = OFF. All sound files were manually checked for B. barbastellus calls using Kaleidoscope version 5.3.9 (Wildlife Acoustics, Maynard, Massachusetts, USA), with reference to parameters in Russ50.
For a detailed breakdown of the equipment used and their respective costs, please refer to (Supplementary Table S1).
Camera calibration and video processing
Position measurements were recorded during each survey to calibrate the cameras in 3-D space, facilitating the reconstruction of bat flight trajectories. The distances between the cameras and their respective heights were measured using a laser measuring device (Tacklife HD40, Take Tools Cp., Shenzen, China; accuracy ± 1.5 mm, range 40 m). The inclination angle of each camera and the mean slope of the road were recorded using a digital inclinometer (Neoteck LCD Digital Angle Finder, Neoteck Technology ltd., Kowloon, Hong Kong; accuracy ± 0.1°). The slope was calculated by averaging inclination measurements taken every 10 m along the 50 m section of road being surveyed. This value was used to offset the camera inclination and ensure that height values from the flight trajectory reconstructions were referenced to the road surface.
Videos from the left and right cameras were synchronised by clapping loudly in view of both cameras during recording, providing both audio and visual markers. Video processing was performed using Shotcut version 22.12.21 (Melytech LLC, Oceanside, California, USA). Barbastella barbastellus presence over roads was determined by matching time points from acoustic detectors to the corresponding video segments, which were then processed to analyse flight trajectories.
The intrinsic calibration parameters of the cameras were calculated using ThruTracker version 2.0.543, a software package for automated two- and three-dimensional animal tracking. Subsequently, for each survey night, the cameras’ 3-D positions and orientations were calibrated using background points from synchronised video footage with DLTdv8 version 8.1.851. These points were exported and used in combination with the position measurements (i.e., camera inclinations, distances between cameras) and intrinsic camera parameters to calculate the direct linear transformation (DLT) coefficients, using a modified version of the easyWand software tool41 in MATLAB R2023a version 9.14 (MathWorks, USA). Further details on the camera calibration process are provided in Supplementary Note S1.
Flight trajectory reconstruction
The reconstruction of flight trajectories was performed using ThruTracker version 2.0.543. Initially, extracted video clips from both the left and right camera were processed to obtain 2-D flight tracks. Pairs of 2-D tracks, along with the unique DLT coefficients generated for each survey, were then processed to obtain 3-D flight trajectories (note that 3-D trajectories could not be reconstructed if data were obtained from only one camera). We used MATLAB to visualise the reconstructed bat flight trajectories, as well as extract data on the average height, speed, and angle of individual tracks (see Supplementary Fig. S1 for distributions of flight characteristics). The angle of each flight trajectory relative to the road was classified as either ‘following’ (0–45°) or ‘crossing’ (45–90°) the road. We chose this binary classification for our analysis, as a discernible shift in bat behaviour was observed beyond 45° (Supplementary Fig. S2). For a comprehensive overview of the steps involved in reconstructing flight trajectories, including data collection and processing, please refer to (Fig. 3 and Supplementary Note S2).

Research methodology flowchart outlining the steps for collecting and processing video data to obtain 3-D flight trajectories. If relevant to the step, the software package used is indicated in square brackets.
Local vegetation characterisation
We characterised the local vegetation around each flight trajectory in QGIS (v3.6.3-Noosa; https://www.qgis.org/) software52. A canopy height model (CHM) was created using one-metre resolution LiDAR data collected between 2019 and 2021 by the UK Environment Agency (open source survey data; https://environment.data.gov.uk/survey/), by subtracting the digital terrain model (DTM) from the first return digital surface model (FZ DSM). Raster pixels were reclassified to generate the final CHM, where only pixels > 3 m were retained, to exclude ground level vegetation. This ensured that the model captured a range of tree canopies, including those of mature and young trees53. Subsequently, a 20 m buffer was added around each flight trajectory, as this represented the approximate sonar range of echolocating B. barbastellus bats54. The maximum and mean canopy height was calculated over each of the buffered trajectories. Canopy cover was determined by calculating the proportion of the buffered trajectories covered by the CHM. Distance to canopy cover was calculated as the mean distance between all points along a trajectory and the nearest straight-line distance to canopy cover. See Supplementary Fig. S3 for vegetation distributions across sites.
Collision risk and traffic density
Bat passes were categorised based on the collision risk posed to them, determined by the mean height of their flight track. Following the approach of Berthinussen and Altringham39, and considering the maximum vehicle height in the UK is 4.9 m, bats were categorised as being at an ‘unsafe’ height if their flight was below 5 m and ‘safe’ if it was above 5 m. Although a single height threshold was used in the analysis, we acknowledge that different vehicle types pose varying risks. In interpretating the results, we therefore considered flights below 2 m as potentially at risk of collision with all vehicles, including cars, SUVs, and motorbikes, whilst flights between 2 m and 5 m were considered primarily at risk from larger vehicles such as lorries and trucks. To determine whether traffic density influenced bat behaviour, we analysed the camera footage to count the number of vehicle passes within several time intervals preceding a bat pass. Traffic density was calculated for the time windows of 10 s, 30 s, 1 min, 2 min, 4 min, and 8 min.
Lighting variables were excluded from the analysis due to practical challenges in quantification. All of the roads were unlit but we recognise that light emission from headlights may modify the response of bats to the presence of vehicles. Because vehicles frequently alternated between high and low beams, and the road curvature at different sites resulted in varying areas of light exposure, complicating the derivation of appropriate light-exposure variables, we were not able to separate out the individual effects of lighting from other stimuli (such as noise) associated with the presence of vehicles.
Data collection took place during a non-lockdown period of the COVID-19 pandemic, with traffic flow in the area (Petworth, West Sussex) reduced by approximately 17.5% between 8pm and 6am across the study period, in comparison to the preceding four years55.
Data analysis
We tested three key hypotheses relating to how environmental and traffic variables (Table 1) influence bat flight behaviour across roads. First, to assess whether increasing canopy cover, distance to canopy cover, canopy height, and traffic density were associated with higher flight heights and subsequently reduced collision risk (hypothesis 1), we modelled (1) mean flight height and (2) the proportion of flight trajectories at risk. Second, to test whether increasing traffic density caused bats to cross roads more directly (hypothesis 2), we modelled (3) flight orientation. Third, to test whether bats flew faster over road sections with less canopy cover (hypothesis 3), we modelled (4) flight speed.
We conducted initial exploratory analyses using Mann-Whitney U tests to assess whether bat flight heights differed between nights at each site. As we expected minimal variation in flight behaviour between nights and had limited sampling nights per site, excluding ‘night’ from further analyses would help reduce model complexity. Differences were only observed at one site, where flight trajectories were consistently higher than at other sites; therefore, ‘night’ was not included in subsequent analyses.
Prior to model fitting, we also assessed collinearity among all predictors (Table 1) using Spearman’s rank correlations. Canopy cover and distance to canopy cover were highly correlated (r = -0.92), so only the variable associated with the lower AICc was retained in each model. In addition, to determine appropriate time windows for traffic density, we first ran univariate analyses and retained the time window associated with the lowest AICc for each response variable.
We constructed separate candidate model sets for each response variable: (1) mean flight height, (2) proportion of flight trajectories at risk, (3) flight speed, and (4) flight orientation. Hypothesis-driven models were implemented using either linear mixed-effects models (LMMs) or generalised linear mixed-effects models (GLMMs) via the ‘lme4’ package56. Site ID was included as a random effect in all models to account for the non-independence of flight trajectories recorded within sites.
Base model structures were as follows:
-
1.
Mean flight height (hypothesis 1): Modelled using a LMM with a log-transformed response variable to meet normality assumptions.
-
2.
Proportion of flight trajectories at risk (hypothesis 1): Modelled using a GLMM with a binomial error structure, where 0 = not at risk and 1 = at risk.
-
3.
Flight orientation (hypothesis 2): Modelled using a GLMM with a binomial error structure, where 0 = following and 1 = crossing the road.
-
4.
Flight speed (hypothesis 3): Modelled using a LMM.
In all models, \(\:i\) denotes individual flight trajectories, \(\:j\) denotes site, \(\:{u}_{j}\) is the random intercept for site, and \(\:{\epsilon\:}_{ij}\) is the residual error.
To explore additional effects beyond those hypothesised, we used forward selection to test the remaining candidate predictors (Table 1) and interaction terms one at a time, retaining only those that improved model fit based on AICc. Specifically, we tested for an interaction between the selected canopy predictor (canopy cover or distance to canopy cover) and mean canopy height, where applicable. No other interactions were considered due to moderate collinearity among predictors and to limit model complexity, given that most predictors represented aspects of canopy structure. All retained predictors were checked for multicollinearity using variance inflation factors (VIF), with VIF > 3 used as a threshold for exclusion57. This approach allowed us to evaluate whether additional variables improved model performance without removing theoretically justified predictors, consistent with the recommendations of Burnham and Anderson58.
We assessed model residuals for normality and heteroscedasticity using the testResiduals function from the ‘DHARMa’ package59. To visualise spatial flight behaviour, kernel density plots were generated using all positional points obtained from flight trajectories. All analyses were conducted in RStudio using R version 3.6.160, and figures were produced using the ‘ggplot2’ package61.
Results
Of the 35 surveyed nights, flight trajectories were obtained and analysed for a subset of 19 nights (Supplementary Table S2) due to the extensive data processing requirements. These nights were randomly selected from each site, ensuring a representative sample of flight trajectories across all sites for further analysis. A total of 400 flight trajectories were subsequently reconstructed from approximately 1268 B. barbastellus passes (as multiple detectors would simultaneously record a pass it was not always possible to discern if it was the same bat, hence an approximation) recorded over the 19 nights (see Supplementary Videos S1 for videos displaying 3-D reconstructed flight trajectories). An average of 45 flight trajectories were successfully obtained for each site (range: 3–136, SD = 39.31). Trajectories were reconstructed from 23,554 frames (totalling 7 min 51 s), with an average track length of 59 frames, corresponding to a flight duration of 1.2 s.
Using base model structures derived from a priori hypotheses, followed by forward stepwise selection, we identified distinct sets of predictors for each behavioural response variable (Table 2). These results highlight the varying influence of vegetation structure and traffic conditions on B. barbastellus flight height, collision risk, orientation, and speed.
The flight trajectories of B. barbastellus were at a median height of 4.75 m (IQR: 3.40 m; range: 1.51–16.93 m). Bats showed relatively little variation in their height within individual flight trajectories (coefficient of variation < 10% for 86% of tracks), varying on average by 0.78 m. Overall, 56% of flight trajectories were at a height that put bats at risk of collision with vehicles. However, only 1% of bat flights were vulnerable to collision with small vehicles (< 2 m tall, such as cars, SUVs, and motorbikes); whereas the majority (55%) of flight trajectories were at risk from larger vehicles (such as lorries, trucks, busses, and vans), which comprised approximately 11% of road traffic recorded in our video assessments. A high concentration of bats crossing at unsafe heights can be seen from the kernel density estimation (Fig. 4). This pattern is evident across most sites, except for site four, where bats were concentrated around a height of 7 m. At this site, a greater range of flight heights were recorded than in other locations, and heights varied significantly between the two nights of survey (night one median = 6.02 m; night two median = 8.27 m; U = 720, p < 0.001), but for both nights the median height was outside the zone of risk. For all other sites, there was no significant between-night difference in flight heights (p > 0.05).
An increasing distance to canopy cover was associated with an increase in the flight height of B. barbastellus over roads (estimate: 0.024, 95% CI: 0.006–0.048, p = 0.011), suggesting that bats gained height when further from vegetative structure. Similarly, greater canopy cover caused a significant increase in the collision risk for bats (Odds Ratio (OR): 1.048, 95% CI: 1.014–1.084, p = 0.006). This meant that for every 10% increase in canopy cover, the odds of a bat flying at a collision-risk height increased by 60% (Fig. 5a). No significant effects were found between B. barbastellus flight height or collision risk and any of the other predictors retained in the final models (p > 0.05).
Overall, we found that 69.5% of flight trajectories were crossing the road, whilst 30.5% were following the road. There was a significant interaction between the distance to canopy cover and the mean canopy height on the orientation of flight trajectories (p < 0.001). Specifically, as the distance from canopy cover increased, bats were more likely to cross directly over the road. However, this effect was modulated by mean canopy height: lower canopy heights reduced the likelihood of bats crossing the road directly, although this effect remained positive (Fig. 5c). In addition, bats were more likely to be crossing the road with decreasing maximum canopy height (OR: 0.754, 95% CI: 0.574–0.979, p = 0.033; Supplementary Fig. S4). The level of traffic preceding a bat pass had no significant effect on the orientation of flight trajectories.


Kernel density plots showing the spatial distribution of B. barbastellus flight trajectories over roads, including an approximate representation of the vegetation structure at each site. The colour gradient represents the relative density of flight activity within each site, with higher values including greater activity. Note that density levels are scaled independently per panel and should not be compared directly across sites. Solid white lines indicate the road surface, and dashed white lines represent the unsafe zone for bats. Site one is not shown due to low sample size.

Model predictions showing the effects of canopy composition on bat flight behaviour. (a) Relationship between increasing canopy cover and the proportion of flight trajectories at risk of collision with vehicles. Ticks represent data for bats flying at heights > 5 m (bottom) and < 5 m (top). (b) Relationship between increasing canopy cover and bat flight speed. Ticks on the x-axis represent sampled speed data. (c) Interaction between mean canopy height and distance to canopy cover on the probability of a flight trajectory crossing the road. Ticks represent data for flight trajectories that followed (bottom) or crossed (top) the road. Shaded areas in all plots represent 95% confidence intervals.
Bats flew at a mean speed of 4.40 ± 0.91 m/s (range: 2.01–7.57 m/s) over roads. Compared to the low variability observed for flight height, bats showed substantial variation in their speed along flight trajectories (mean 1.62 m/s; coefficient of variation > 10% for 35% of tracks). Increased canopy cover was associated with a higher average speed for B. barbastellus (estimate: 0.014, 95% CI: 0.005–0.025, p = 0.028), with bats flying 0.14 m/s faster for every 10% increase in canopy cover (Fig. 5b).
Discussion
This study revealed that B. barbastellus alters its flight behaviour over roads in response to canopy structure, findings that have important implications for understanding vehicular collision risk and developing effective mitigation strategies. In addition, we successfully demonstrated the practical application of near-infrared cameras and 3-D visual tracking techniques to reconstruct the flight trajectories of bats over roads. This approach can be applied to obtain detailed frame-by-frame data on flight height, speed, and orientation, providing valuable insights into the movement patterns of individual bats. Consequently, our results show that B. barbastellus frequently flies at heights that place it at risk of vehicle collisions, with flight height decreasing in areas with greater canopy cover, and flight speed and orientation also being influenced by canopy presence.
This study was undertaken to provide a greater understanding of the flight behaviour of bats along roads, using commonly available videography equipment. The use of background points (including the focal bats themselves) to calibrate the cameras, rather than needing dedicated calibration objects to be introduced into each camera’s view, provided an easy and safe method to study bats along roads. Though we used cameras capable of near-infrared recording in this study’s set-up, thermal imaging cameras could be used and would give a better ability to distinguish bats from background noise (e.g., vegetation) and detect bats at greater distances. However, whilst the sites within this study generally offered at least a partial view above the canopy, giving us confidence that few bats were missed, both near-infrared and thermal imaging cameras have limitations in understanding flight behaviour of bats above canopies when canopy cover is high. Additionally, it is important to note that only 19 of the 35 nights were fully examined in detail due to technical limitations, and work is currently ongoing to streamline the method for more efficient future applications.
Just over half of B. barbastellus flight trajectories were at a height that put them at risk from collision with vehicles, with 56% of tracks recorded below 5 m (Figs. 4 and 5a). The mean flight heights observed in this study were higher than those reported for many other species, such as Plecotus auritus, Myotis spp., and Pipistrellus spp., in studies that relied on human observers22,37,38,39. It is possible that these differences reflect the greater accuracy of the current method. For example, a 1 m discrepancy in the estimated flight height by human observers for a bat flying at 5 m represents a substantial 20% difference. Alternatively, species-specific differences in functional traits, such as body size, wing morphology, echolocation call structure, and roosting and foraging ecology, may result in greater collision risks for some species than those reported here for B. barbastellus12. Additionally, road characteristics, including vehicle density and road width, may influence species’ flight behaviour near roads.
It is important to note that, whilst we have focused on analysing the mean flight height of each individual trajectory, this approach does not fully capture the lower end of the flight height distribution where collision risk is greatest. Infrequent dips in flight height can have disproportionate consequences for mortality risk, and future studies may benefit from incorporating centile-based metrics (e.g., 20th or 80th percentiles) to provide a more nuanced assessment of risk. It is also possible that even flights above 5 m may be unsafe owing to the creation of vacuum effects from fast-moving vehicles, which could draw bats to a lower height, potentially placing them in collision zones of following vehicles. Future application of our methodology to other species and road environments will help to clarify the relative importance of these factors in shaping bat flight behaviour and collision risk.
Canopy cover was associated with increased collision risk for B. barbastellus due to reduced flight height (Fig. 5a), contrary to our hypothesis that greater canopy cover would reduce collision risk. This suggests that B. barbastellus flies higher over roads lacking canopy cover, which opposes the general expectation that bats fly closer to the ground when crossing open spaces12. Therefore, the implementation of hop-overs, in which trees are planted near road edges to provide continuous canopy cover62, may be an ineffective strategy for encouraging B. barbastellus to cross roads at a safer height. Roemer et al.63. reached a similar conclusion, demonstrating that bats of various species faced increased collision risk in forested landscapes or areas with more trees, although they could not model this effect on short-range echolocators like B. barbastellus. Similarly, Russell et al.22 suggested that bats exhibit a heightened collision risk with increasing canopy cover; noting an absence of carcasses in locations lacking canopy cover within 15 m of the road, but a rise in mortalities when canopy cover was closer to the road. However, their study did not determine whether this observed increase in mortalities was a consequence of higher bat densities within these habitats or altered flight behaviour, as observed within this study.
A decrease in the canopy cover in the vicinity of roads resulted in a reduction in B. barbastellus flight speed (Fig. 5b). This finding contradicted our hypothesis, as we had anticipated that bats might increase their speed in open areas to minimise exposure time to perceived predation risk46. Controlled experiments have also demonstrated that bats fly faster in open spaces compared to environments with artificial trees introduced64. A reduction in speed is expected in these more cluttered habitats, as it would provide additional time to manoeuvre through woodland. However, considering that B. barbastellus was found to fly closer to the road surface when near canopy, there may be enough open space to navigate relatively unhindered by obstacles.
The probability that flight trajectories were following the road increased with decreasing distance to canopy cover (Fig. 5c). In other words, on wooded or tree-lined roads, bats were more likely to show behaviour consistent with foraging34,35. Forest edges and linear landscape features such as roads may be used as commuting33 and foraging sites for edge-adapted species such as B. barbastellus34,35. Therefore, if roads provide significant advantages for commuting and foraging, as shown by Myczko et al.65. , B. barbastellus may spend more time along them. However, it’s essential to recognise that these advantages might not fully compensate for the associated collision risk by vehicles, warranting further research into these cost-benefit dynamics. Interestingly, bats were more likely to directly cross the road when the mean canopy height was greater (Fig. 5c). This may suggest that tall canopy offers greater protection and a clearer flight corridor, leading bats to cross more directly, potentially avoiding the risk of flying along the road where there may be fewer escape options or greater exposure to vehicles.
We found no evidence that B. barbastellus adjusted its flight behaviour (i.e., speed, height, orientation) in response to traffic density. This challenges our hypothesis that bats would fly higher and more directly across roads to minimise risk under higher traffic conditions. Although increased traffic density raises the likelihood of bat-vehicle co-occurrence by reducing the time gaps between vehicles, short-range echolocators such as B. barbastellus have been shown to mitigate this risk by being less likely to fly within the collision risk zone when a vehicle is present63. This suggests that B. barbastellus may rely on temporal avoidance to reduce collision risk, rather than altering its flight height or orientation. It is also possible that B. barbastellus exhibits some degree of road avoidance in response to traffic noise, as has been demonstrated in several other species66. However, Kerth and Melber36 observed commuting B. barbastellus flying directly over a motorway with heavy traffic, where other species used underpasses, indicating limited road avoidance despite the likely high level of traffic noise. Such behaviour may help explain the frequent road mortalities reported by Lesińksi, Sikora, and Olszewski23, particularly if bats are not adjusting their height in response to traffic.
Several recommendations for managing roadside vegetation and planning new road schemes can be drawn from the findings of this study. Firstly, it is advisable to avoid siting roads in areas with a high percentage of canopy cover, such as woodlands, where a high proportion of B. barbastellus bats fly at heights that pose a significant collision risk. Conversely, areas with fewer trees near roads should be prioritised, as bats in these areas are less likely to fly within the collision risk zone and tend to cross roads more directly. Whilst no evidence was found that vegetation height directly influenced flight height, bats were more likely to make direct crossings in areas with taller vegetation, potentially spending less time at risk. Therefore, maintaining tall vegetation and/or selecting of sites with a lower percentage of canopy cover could help mitigate collision risk.
For roads where B. barbastellus activity is known to be high, limiting night-time traffic and restricting large vehicles could be a cost-effective and easily implemented measure to reduce collision risk. Such traffic restrictions would help minimise bat exposure to vehicles, particularly during peak activity times. Although reducing canopy cover around roads, either through tree trimming or selective removal, might also decrease collision risk by encouraging bats to fly at greater heights, this approach should be pursued cautiously. It could have unintended consequences, such as the loss of habitat and connectivity for other species67, and might hinder landscape permeability, potentially increasing the barrier effect for B. barbastellus, with implications for foraging and roosting site access13. Due to the complexities associated with data processing within our study, we were often unable to obtain a complete set of reconstructed trajectories for an entire night. Therefore, we could not accurately model the influence of roadside vegetation on the barrier effect of roads through an analysis of bat activity rates. Whilst our acoustic data could have alternatively provided a measure of bat activity, different setups (i.e., directional microphones) would be needed to discern whether recorded activity occurs over the roads, as discussed previously. Therefore, the management of trees and their canopies needs to be approached with careful consideration of alternative routes for bats and a comprehensive understanding of the movement of individuals within a colony before implementing mitigation strategies. Further research is needed to understand these potential implications in more detail.
Understanding how the environment around roads influences bat behaviour is essential for effective conservation and mitigation strategies. We have shown that a high level of detail on the spatial movement of bats along roads is achievable using 3-D tracking approaches, offering novel insights into bat behaviour. This approach allowed us to identify the important influence of canopy structure on the flight behaviour of a woodland bat species and the subsequent implications for collision risk. Importantly, our findings challenge prior assumptions about how bats interact with roads, contradicting our initial hypotheses based on established research and conceptions, highlighting the need to reassess current mitigation strategies in light of species-specific behavioural responses. Although road avoidance behaviour could not be explored due to limitations in the cameras’ field of views, future research could incorporate complementary tools, such as directional microphones, to detect bat activity and movement patterns beyond the cameras’ range. Additionally, examining flight height centiles within trajectories could help quantify the frequency of high-risk drops in flight height, providing a more refined understanding of collision risk. The methods developed in this study, combined with these additional techniques, could be used to evaluate the impact of road developments (e.g., bridges) and mitigation structures (e.g., bat gantries, green bridges, hop-overs) on bat behaviour, provided sites are surveyed before and after implementation68. The integration of tracking technology into these survey designs can, therefore, represent an important step-change in our understanding of bat-road interactions.
Data availability
The dataset, videos displaying reconstructed flight trajectories, and R code for this study are publicly accessible in the Figshare data repository (https://doi.org/10.6084/m9.figshare.26124277.v3)69.
References
Dulac, J. Global Land Transport Infrastructure Requirements: Estimating Road and Railway Infrastructure Capacity and Costs To 2050 (International Energy Agency, 2013).
Torres, A., Jaeger, J. A. G. & Alonso, J. C. Assessing large-scale wildlife responses to human infrastructure development. PNAS 113, 8472–8477 (2016).
Riitters, K. H. & Wickham, J. D. How Far to the nearest road? Front. Ecol. Environ. 1, 125–129 (2003).
Rico, A., Kindlmann, P. & Sedláček, F. Barrier effects of roads on movements of small mammals. Folia Zool. 56, 1–12 (2007).
Holderegger, R. & Di Giulio, M. The genetic effects of roads: A review of empirical evidence. Basic. Appl. Ecol. 11, 522–531 (2010).
Bennett, V. J. Effects of road density and pattern on the conservation of species and biodiversity. Curr. Landsc. Ecol. Rep. 2, 1–11 (2017).
Forman, R. T. T. & Deblinger, R. D. The ecological road-effect zone of a Massachusetts (U.S.A.) suburban highway. Conserv. Biol. 14, 36–46 (2000). (2000).
Eigenbrod, F., Hecnar, S. J. & Fahrig, L. Quantifying the road-effect zone threshold effects of a motorway on Anuran populations in ontario, Canada. Ecol. Soc. 14, 24 https://doi.org/10.5751/ES-02691-140124 (2009).
Claireau, F. et al. Major roads have important negative effects on insectivorous Bat activity. Biol. Conserv. 235, 53–62 (2019).
Kelt, D. A. & Van Vuren, D. Energetic constraints and the relationship between body size and home range area in mammals. Ecology 80, 337–340 (1999).
Barclay, R. M. R. & Harder, L. D. Life histories of bats: life in the slow lane. In Bat Ecology (eds Kunz, T. H. & Fenton, M. B.) 209–256 (University of Chicago Press, (2003).
Altringham, J. & Kerth, G. Bats and roads. In Bats in the Anthropocene: Conservation of bats in a changing world (eds. Voigt, C. C. & Kingston, T.) 35–62 (Springer International Publishing, 2016). (2016).
Fensome, A. G. & Mathews, F. Roads and bats: a meta-analysis and review of the evidence on vehicle collisions and barrier effects. Mamm. Rev. 46, 311–323 (2016).
Frick, W. F., Kingston, T. & Flanders, J. A review of the major threats and challenges to global Bat conservation. Ann. N Y Acad. Sci. 1469, 5–25 (2020).
Rackow, W., Harz, O. & Schlegel, D. Fledermäuse (Chiroptera) Als verkehrsopfer in Niedersachsen. Nyctalus 5, 11–18 (1994).
Kiefer, A., Merz, H., Rackow, W., Roer, H. & Schlegel, D. Bats as traffic casualties in Germany. Myotis 32, 215–220 (1995).
Haensel, J. & Rackow, W. Fledermäuse Als Verkehrs- opfer – ein Neuer report. Nyctalus 6, 29–47 (1996).
Capo, G., Chaut, J. & Arthur, L. Quatre Ans d’étude de Mortalité des chiroptères Sur Deux Kilomètres routiers proches d’un site d’hibernation. Symbioses 15, 45–46 (2006).
Lesiński, G. Bat road casualties and factors determining their number. Mammalia 71, 138–142 (2007).
Lesiński, G. Linear landscape elements and Bat casualties on roads – an example. Ann. Zool. Fenn. 45, 277–280 (2008).
Gaisler, J., Řehák, Z. & Bartonička, T. Bat casualties by road traffic (Brno-Vienna). Acta Theriol. 54, 147–155 (2009).
Russell, A. L., Butchkoski, C. M., Saidak, L. & McCracken, G. F. Road-killed bats, highway design, and the commuting ecology of bats. Endanger. Species Res. 8, 49–60 (2009).
Lesiński, G., Sikora, A. & Olszewski, A. Bat casualties on a road crossing a mosaic landscape. Eur. J. Wildl. Res. 57, 217–233 (2011).
Medinas, D., Marques, J. T. & Mira, A. Assessing road effects on Bats: the role of landscape, road features, and Bat activity on road-kills. Ecol. Res. 28, 227–237 (2013).
Novaes, R. L. M., Laurindo, R. S., Dornas, R. A. P., Esbérard, C. E. L. & Bueno, C. On a collision course: the vulnerability of bats to roadkills in Brazil. Mastozool Neotrop. 25, 115–128 (2018).
Mathews, F. et al. Effectiveness of search dogs compared with human observers in locating Bat carcasses at win-turbine sites: A blinded randomized trial. Wildl. Soc. Bull. 37, 34–40 (2013).
Slater, F. M. An assessment of wildlife road casualties – the potential discrepancy between numbers counted and numbers killed. Web Ecol. 3, 33–42 (2002).
Mathews, F. & Harrower, C. IUCN – compliant Red List for Britain’s Terrestrial Mammals. Assessment by the Mammal Society under contract to Natural England, Natural Resources Wales and Scottish Natural Heritage Natural England (2020).
Temple, H. & Terry, A. European mammals: red list status, trends, and conservation priorities. Folia Zool. 58, 248–269 (2009).
Carr, A., Zeale, M. R. K., Weatherall, A., Froidevaux, J. S. P. & Jones, G. Ground based and LiDAR-derived measurements reveal scale-dependent selection of roost characteristics by the rare tree-dwelling Bat Barbastella barbastellus. Ecol. Manag. 417, 237–246 (2018).
Zeale, M. R., Davidson-Watts, I. & Jones, G. Home range use and habitat selection by barbastelle bats (Barbastella barbastellus): implications for conservation. J. Mammal. 93, 1110–1118 (2012).
Hillen, J. et al. Sex specific habitat selection in an edge habitat specialist, the Western barbastelle Bat. Ann. Zool. Fenn. 48, 180–190 (2011). (2011).
Kalcounis-Rueppell, M. C. et al. Hard forest edges act as conduits, not filters, for bats. Wildl. Soc. Bull. 37, 571–576 (2013).
Hillen, J., Kiefer, A. & Veith, M. Interannual fidelity to roosting habitat and flight paths by female Western barbastelle bats. Acta Chiropterol. 12, 187–195 (2010).
Villemey, A. et al. Can linear transportation infrastructure verges constitute a habitat and/or a corridor for insects in temperate landscapes? A systematic review. Environ. Evid. 13, 4. https://doi.org/10.1186/s13750-018-0117-3 (2018).
Kerth, G. & Melber, M. Species-specific barrier effects of a motorway on the habitat use of two threatened forest-living Bat species. Biol. Conserv. 142, 270–279 (2009).
Bennett, V. J. & Zurcher, A. A. When corridors collide: Road-related disturbance in commuting bats. J. Wildl. Manag. 77, 93–101 (2013).
Zurcher, A. A., Sparks, D. W. & Bennett, V. J. Why the Bat did not cross the road? Acta Chiropterol. 12, 337–340 (2010).
Berthinussen, A. & Altringham, J. Do Bat gantries and underpasses help Bats cross roads safely? PLoS One. 7, e38775. https://doi.org/10.1371/journal.pone.0038775 (2012).
Claireau, F. et al. Bat overpasses help bats to cross roads safely by increasing their flight height. Acta Chiropterol. 23, 189–198 (2021).
Theriault, D. H. et al. A protocol and calibration method for accurate multi-camera field videography. J. Exp. Biol. 217, 1843–1848 (2014).
Matzner, S., Warfel, T. & Hull, R. ThermalTracker-3D: A thermal stereo vision system for quantifying bird and Bat activity at offshore wind energy sites. Ecol. Inf. 57, 101069. https://doi.org/10.1016/j.ecoinf.2020.101069 (2020).
Corcoran, A. J., Schirmacher, M. R., Black, E., Hedrick, T. L. & ThruTracker Open-source software for 2-D and 3-D animal video tracking. Preprint At. https://doi.org/10.1101/2021.05.12.443854 (2021).
O’Shea, T. J., Cryan, P. M., Hayman, D. T. S., Plowright, R. K. & Streicker, D. G. Multiple mortality events in bats: a global review. Mammal Rev. 46, 175–190 (2016).
Roemer, C., Disca, T., Coulon, A. & Bas, Y. Bat flight height monitored from wind masts predicts mortality risk at wind farms. Biol. Conserv. 215, 116–122 (2017).
Lima, S. L. & O’Keefe, J. M. Do predators influence the behaviour of bats? Biol. Rev. Camb. Philos. Soc. 88, 626–644 (2013).
Greenaway, F. Advice for the Management of Flightlines and Foraging Habitats of the Barbastelle Bat Barbastella Barbastellus (English Nature Research Report, 2004).
Greenaway, F. Barbastelle Bats in the Sussex West Weald 1997–2008 (Sussex Wildlife Trust, West Weald Landscape Partnership, 2008).
Collins, J. Bat surveys for professional ecologists: good practice guidelines (3rd edition). (The Bat Conservation Trust, 2016).
Russ, J. British Bat Calls: a Guide To Species Identification (Pelagic Publishing, 2012).
Hedrick, T. L. Software techniques for two- and three-dimensional kinematic measurements of biological and biomimetic systems. Bioinspir Biomim. 3, 034001. https://doi.org/10.1088/1748-3182/3/3/034001 (2008).
QGIS Development Team. QGIS Geographic Information System. Open Source Geospatial Foundation Project. http://www.qgis.osgeo.org (2020).
Broughton, R. K., Chetcuti, J., Burgess, M. D., Gerard, F. F. & Pywell, R. F. A regional-scale study of associations between farmland birds and linear Woody networks of hedgerows and trees. Agric. Ecosyst. Environ. 310, 107300. https://doi.org/10.1016/j.agee.2021.107300 (2021).
Rebelo, H. & Jones, G. Ground validation of presence-only modelling with rare species: a case study on barbastelles Barbastella barbastellus (Chiroptera: Vespertilionidae). J. Appl. Ecol. 47, 410–420 (2010).
West Sussex County Council. Traffic Monitoring Database (Site Number 28) https://wstrafficdata.cdmf.info (West Sussex County Council, 2023).
Bates, D., Mächler, M., Bolker, B. & Walker, S. Fitting linear mixed-effects models using lme4. J. Stat. Softw. 67, 1–48 (2015).
Zuur, A. F., Ieno, E. N. & Elphick, C. S. A protocol for data exploration to avoid common statistical problems. Methods Ecol. Evol. 1, 3–14 (2010).
Burnham, K. P. & Anderson, D. R. Model Selection and Multimodel Inference: a Practical information-theoretic Approach (Springer, 2002).
Hartig, F. DHARMa: residual diagnostics for hierarchical (multi-level / mixed) regression models. R package version 0.4.6. https://CRAN.R-project.org/package=DHARMa (2022).
R Core Team. R: a Language and Environment for Statistical Computing (R Foundation for Statistical Computing, 2019).
Wickham, H. Ggplot2: Elegant Graphics for Data Analysis (Springer, 2016).
Limpens, H. J. G. A., Twisk, P. & Veenbaas, G. Bats and Road Construction. (Dutch Ministry of Transport, Public Works and Water Management Directorate-General for Public Works and Water Management, Road and Hydraulic Engineering Institute (Delft, the Netherlands and the Association for the Study and Conservation of Mammals, 2005).
Roemer, C., Coulon, A., Disca, T. & Bas, Y. Influence of local landscape and time of year on bat-road collision risks. Peer Community J. 1, e54. https://doi.org/10.24072/pcjournal.59 (2021).
Falk, B., Jakobsen, L., Surlykke, A. & Moss, C. F. Bats coordinate sonar and flight behavior as they forage in open and cluttered environments. J. Exp. Biol. 217, 4356–4364 (2014).
Myczko, Ł. et al. Effects of local roads and car traffic on the occurrence pattern and foraging behaviour of bats. Transp. Res. D Trans. Environ. 56, 222–228 (2017).
Finch, D., Schofield, H. & Mathews, F. Traffic noise playback reduces the activity and feeding behaviour of free-living bats. Environ. Pollut. Part. B 263, 114405. https://doi.org/10.1016/j.envpol.2020.114405 (2020).
Henry, R. C. et al. Tree loss impacts on ecological connectivity: developing models for assessment. Ecol. Inf. 42, 90–99 (2017).
Claireau, F. et al. Bat overpasses as an alternative solution to restore habitat connectivity in the context of road requalification. Ecol. Eng. 131, 34–38 (2019).
O’Malley, K. et al. Dataset of bat tracks used for analysis within R. figshare. Dataset https://doi.org/10.6084/m9.figshare.26124277.v3 (2024).
Acknowledgements
We would like to thank the West Sussex County Council for giving us permission to undertake this study at the road sites; Frank Greenaway for providing both advice and radio-tracking data to help inform site selection; Daniel Whitby for loaning equipment for testing and calibrating; and Chris Damant and Iain Hysom for providing advice on lighting and survey design.
Author information
Authors and Affiliations
Contributions
K.D.O. carried out the data collection, statistical analysis, conceived and coordinated the study, and drafted the manuscript. F.M. and H.S. conceived the study, advised on statistical analysis, and helped review and edit the manuscript. A.C. advised on survey design, assisted with data processing, and helped review and edit the manuscript. D.H. and P.G.R.W. helped review and edit the manuscript. All authors approved the final manuscript prior to publication.
Corresponding authors
Ethics declarations
Competing interests
The authors declare no competing interests.
Additional information
Publisher’s note
Springer Nature remains neutral with regard to jurisdictional claims in published maps and institutional affiliations.
Supplementary Information
Below is the link to the electronic supplementary material.
Rights and permissions
Open Access This article is licensed under a Creative Commons Attribution-NonCommercial-NoDerivatives 4.0 International License, which permits any non-commercial use, sharing, distribution and reproduction in any medium or format, as long as you give appropriate credit to the original author(s) and the source, provide a link to the Creative Commons licence, and indicate if you modified the licensed material. You do not have permission under this licence to share adapted material derived from this article or parts of it. The images or other third party material in this article are included in the article’s Creative Commons licence, unless indicated otherwise in a credit line to the material. If material is not included in the article’s Creative Commons licence and your intended use is not permitted by statutory regulation or exceeds the permitted use, you will need to obtain permission directly from the copyright holder. To view a copy of this licence, visit http://creativecommons.org/licenses/by-nc-nd/4.0/.
About this article

Cite this article
O’Malley, K.D., Schofield, H.W., Wright, P.G.R. et al. Increasing canopy cover elevates vehicle collision risk for barbastelle bats (Barbastella barbastellus) at roads. Sci Rep 15, 37011 (2025). https://doi.org/10.1038/s41598-025-14315-2
Received:
Accepted:
Published:
Version of record:
DOI: https://doi.org/10.1038/s41598-025-14315-2
