
Abstract
The pore structure of coal serves as the primary domain for gas adsorption and migration. Studying the pore structure characteristics holds significant implications for gas disaster prevention and control. This research focused on soft and hard coal samples from an abnormal gas emission seam and adjacent seams in Huainan Xieqiao Coal Mine. Quantitative characterization of pore structures was performed using low temperature nitrogen adsorption (LTNA), low-field nuclear magnetic resonance (NMR), and gas adsorption and desorption experiments to evaluate their impacts on gas desorption capacity and rate. The results demonstrate that the pore morphology of soft coal predominantly exhibits cylindrical pores, ink bottle pores, and slit shaped pores, whereas hard coal contains cylindrical pores, wedge shaped pores, and partially open slit shaped pores. As coal fragmentation increases, the pore volume, specific surface area, and fractal dimension exhibit progressive increases, indicating enhanced structural irregularity. The T2 spectrum of the coal seam displays a tri-peak structure. The abnormal coal seam exhibits the highest NMR porosity but the lowest effective porosity 0.57% and permeability 0.013 × 10⁻³ mD demonstrating a distinct “high porosity and low permeability” behavior. This behavior aligns with extensive micropore development and poor pore connectivity, suggesting that coal permeability is predominantly governed by effective porosity and pore connectivity. Gas adsorption and desorption processes are predominantly governed by micropore volume and specific surface area. An increase in both parameters enhances gas adsorption capacity and the initial desorption rate, with correlation coefficients ranging from 0.95 to 0.98, indicating a strong positive correlation. The micropore fractal dimension (Df2) reflects pore surface heterogeneity. However, it exhibits no significant correlation with gas adsorption or initial desorption velocity.
Introduction
Coal remains a crucial energy resource globally1,2,3. However, with the progressive depletion of shallow coal reserves, mining operations are increasingly transitioning to deeper coal seams4,5. Deep mining faces challenging geological conditions characterized by elevated in-situ stresses and high gas pressures, which significantly increase the risks of coal and gas outburst disasters. These hazards pose severe threats to both mining safety and the efficient extraction of coal resources6,7,8. Variations in coal seam pore structures directly influence gas adsorption and desorption dynamics9,10 ultimately determining the heterogeneous distribution of gas content within coal beds. This heterogeneity plays a critical role in assessing outburst risks11,12,13. Therefore, systematic investigation of pore structure characterization and gas adsorption and desorption behavior in deep coal seams holds substantial implications for advancing gas disaster prevention strategies in underground mines.
Domestic and foreign scholars have made a lot of achievements in the study of microscopic pore structure of coal. Zhang et al.14 employed fluid intrusion methods combined with digital core technology to investigate the dynamic evolution of flow anisotropy in coal pore structures across coal samples with varying metamorphic grades. Their study identified four distinct seepage transition modes in low rank coal under pressure differentials ranging from 0.7 to 3.9 MPa. Huang et al.15 evaluated methane adsorption capacities across various tectonically deformed coal types. They demonstrated a positive correlation between adsorption capacity and deformation intensity, with mylonitic coal exhibiting a maximum adsorption capacity of 1.000 mmol/g, significantly higher than the 0.734 mmol/g observed in cataclastic coal. Kumar et al.16 analyzed coal and shale samples from the Korba Basin in India, revealing that pore characteristics in both lithologies are influenced by burial depth, total organic carbon content, and mineral composition. Wang et al.17 integrated L-PA, mercury MIP, and high pressure CH4 adsorption experiments to characterize pore structure development in deep coal reservoirs. Their findings revealed scale-dependent controls of pore architecture on adsorbed gas content through isothermal adsorption experiments on coals of different ranks. Zang et al.18 developed a novel approach combining FIB-SEM tomography with deep learning based segmentation for 3D characterization of anthracite pore structures. Their work highlighted the critical role of pore fracture connectivity in governing coalbed methane extraction efficiency. Rahman et al.19 investigated the influence of varying temperatures on the evolution of coal pore structure and its CO₂ adsorption capacity. Their results demonstrated that CO₂ adsorption at 600 °C increased by 138% compared to untreated coal samples. Furthermore, a significant enhancement in micropore volume was observed, whereas mesopores and macropores exhibited a marked reduction. Salmachi et al.20 evaluated the impact of CO2 flooding on coal pore structure through Micro-CT imaging, combined with helium porosity and permeability measurements. Nandis P21 conducted methane adsorption and desorption experiments on bituminous coal and anthracite. Their results demonstrated that methane surface concentration on coal particles reached a maximum at 2.8 MPa, accompanied by a corresponding increase in gas diffusion parameters.
Previous studies have yielded significant findings regarding coal micropore structures and gas adsorption and desorption relationships. However, these investigations primarily focus on different coal types and ranks. The Huainan Deep Mining Area exhibits unique geological and tectonic conditions characterized by exceptionally high gas content, challenging extraction processes, and anomalous gas emission patterns. Consequently, existing research findings on specific coalfields may not be directly applicable to understanding coal outburst mechanisms in the deep mining zones of Huainan. Current research remains limited regarding the characteristic parameters of microporous structures in prominent coal seams and their correlations with gas adsorption and desorption behaviors in deep-seated adjacent coal beds within the Huainan Mining Area. Due to the structural complexity and low permeability of coal matrices, existing pore characterization techniques exhibit significant limitations. For instance, mercury intrusion porosimetry MIP induces matrix compression effects during high pressure stages, aggravating pore fracture damage22,23. This method also suffers from micropore and transition pore shielding effects24,25 and systematic errors arising from exclusion of macropores and visible pores due to experimental dimensional constraints26. Although conventional low temperature nitrogen adsorption (LTNA) preserves sample integrity, it is restricted to characterizing micropores < 10 nm and small pores 10–100 nm, failing to capture mesopore and macropore information27. Nuclear magnetic resonance (NMR) emerges as a novel non-destructive technique for rapid quantitative pore distribution characterization28,29. However, critical structural parameters including pore morphology, volumetric capacity, and specific surface area cannot be directly obtained through this approach. To address these challenges, this study investigates the gas outburst accident occurring at the 21,216 working face of the No. 6 coal seam in the Huainan Xieqiao Coal Mine. The low temperature nitrogen adsorption method and low-field nuclear magnetic resonance NMR technique were employed to characterize key pore structure parameters, including pore volume, specific surface area, morphology, fractal dimension, porosity, and permeability. The pore structure was systematically characterized through low temperature nitrogen adsorption and low-field nuclear magnetic resonance (NMR). These techniques enabled quantitative analysis of key parameters such as pore volume, specific surface area, pore size distribution, fractal dimension, porosity, and permeability. Complemented by high pressure gas adsorption and desorption experiments, the correlation mechanisms between pore structural characteristics and gas adsorption and desorption behaviors were analyzed. These findings establish a theoretical foundation for gas disaster prevention in deep coal seam clusters.
Sample collections and test methods
Sample collections
The Xieqiao Coal Mine, classified as a large-scale high gas outburst mine, is situated within the structural transition zone between the southern flank of the Chenqiao Anticline and the northern limb of the Xieqiao Syncline. Stratigraphically, the sequence comprises the Upper Carboniferous Taiyuan Formation, followed by the Lower Permian Shanxi Formation, Lower Shihezi Formation, and Upper Shihezi Formation30. Within this succession, the Permian Shanxi Formation, along with the Upper and Lower Shihezi Formations, hosts the principal coal bearing strata of the region. These strata contain five economically significant coal seams, designated as No. 4, No. 6, No. 8, No. 11-2, and No. 13-1 coal seams. The No. 6 and No. 8 coal seams in the Xieqiao Coal Mine are deep, high gas outburst seams with an average inter-seam distance of less than 30 m, classifying them as an extremely close coal seam group. Analysis of monitored gas pressure data from No. 6 coal seam revealed 380 samples exhibiting gas pressures P ≥ 0.74 MPa31,32constituting 38.9% of the total samples. In contrast, only 11% of samples from No. 8 coal seam met this threshold. Recent field observations 2023–2024 reveal recurrent gas concentration exceedances, specifically in the No. 6 coal seam. Systematic monitoring data from adjacent No. 8 coal seam demonstrate no comparable gas emission anomalies. This distinct inter-seam variability suggests intrinsic structural heterogeneities within the No. 6 coal seam that dominate gas emission behaviors. The observed abnormal gas emissions suggest potential variations in the internal structure of the coal seam. To address this phenomenon, a microscopic investigation was conducted to analyze how the pore structure of adjacent coal seams within the mining area influences gas adsorption and desorption processes.
The spatial positions of the No. 6 and No. 8 coal seams are illustrated in Fig. 1. Test coal samples were collected from these two primary coal seams in Xieqiao Coal Mine. Weak coal interlayers were observed within the seams, predominantly composed of dull coal with minor vitrain bands. The coal structure primarily consists of fragmented coal exhibiting poor integrity, where some samples display powdery or flaky characteristics, classified as “soft coal”. In contrast, primary structured coal with metallic luster and rigid texture is categorized as “hard coal“(Fig. 2). For each coal seam, two independent sampling points were designated for both soft coal and hard coal strata. The hard coal core was fabricated into cylindrical specimens 25 mm indiameter × 50 mm height (Fig. 3) through wire cutting for low field nuclear magnetic resonance (NMR) characterization. The remaining hard and soft coal samples were crushed and sieved. Subsequently, subsamples of specific particle sizes were allocated for distinct experiments: 10 g of 60–80 mesh pulverized coal was subjected to low temperature nitrogen adsorption experiments; 50 g of each sample was utilized for gas adsorption and desorption experiments; and 5 g of 100–200 mesh pulverized coal was employed for industrial analysis. The results are shown in Table 1.

Schematic diagram of spatial position relationship of coal seams.

Typical coal samples of soft and hard coal in coal seam.

NMR samples.
Proximate analysis results indicate that the moisture content of the samples ranges from 1.08 to 1.58%, with soft coal samples from No. 6 coal and 8 exhibiting higher moisture contents compared to hard coal samples. The volatile matter content varies between 21.10% and 26.91%, showing limited variability across the samples. All analyzed coal samples are classified as bituminous coal of moderate metamorphic grade. The ash yield demonstrates a broader variation range 18.15%-37.34%. Notably, hard coal samples exhibit higher ash content than soft coal, which may occlude the pore network and consequently reduce their effective pore volume and specific surface area33,34. In contrast, the lower ash content in soft coal likely contributes to enhanced micropore volume and specific surface area, providing abundant adsorption sites for gas molecules and thereby improving the gas adsorption capacity of coal35,36.
Test methods
-
1.
The pore structure characteristics of coal samples were investigated through low temperature nitrogen adsorption experiments using a Micromeritics ASAP-2460 multi station surface area and porosity analyzer. First, the coal samples were dried in a constant temperature oven at 80 °C for 48 h. After cooling to ambient temperature, the samples were subjected to 6-hour vacuum degassing pretreatment in the analysis station. The treated coal samples were immersed in liquid nitrogen within a Dewar flask for pore size analysis. Key pore structure parameters including specific surface area and pore volume were determined from nitrogen adsorption isotherms measured at varying pressures, using the non-local density functional theory (NLDFT) method37.
-
2.
The low field nuclear magnetic resonance (NMR) experiments were conducted using a MesoMR23-060 H-I medium sized NMR analyzer with a permanent magnet configuration 0.5T magnetic field strength, 21.68 MHz resonance frequency. For sample preparation, cylindrical coal specimens were subjected to 6-hour vacuum degassing followed by 24-hour water saturation under 10 MPa pressure. The experimental protocol employed a combined saturated water/centrifugation approach38. Initial NMR measurements were performed on saturated water samples. Subsequent centrifugation was applied until the mass change was less than 1/10,000. Post-centrifugation NMR measurements were repeated under identical experimental conditions.
-
3.
The gas adsorption and desorption experiments were conducted using a 3 H-2000PH high pressure gas adsorption analyzer. Instrument parameters were configured as follows: driving gas output pressure of 0.5 MPa, constant temperature maintained at 20 °C, sample degassing temperature set to 100 °C with 180 min degassing duration. Pressure parameters included: 1 partial pressure point preset, 10 bar maximum test pressure, and 70 bar gas intake pressure limit. Timing parameters comprised: 20 min post degassing stabilization, 3600 s equilibrium time, 30 min pre-adsorption vacuum period, 0.2 bar equilibrium standard deviation threshold, 5400 s maximum equilibrium duration, and 180 min test-position degassing. A manual combustible gas leak test was implemented prior to parameter validation. Experimental procedures were initiated following system parameter confirmation.
Test results and analysis
Pore morphology characteristics
The adsorption and desorption curve morphology of coal exhibits strong correlations with pore size distribution, geometric configuration, and channel connectivity. Deboer classified five types of hysteresis loops39,40 and divided pores into cylindrical, slit, wedge and ink bottle types41 as shown in Fig. 4. Figure 5 presents the low temperature nitrogen adsorption and desorption isotherms obtained from the four coal samples. Through comparative analysis of the adsorption isotherms from different coal seams, two characteristic patterns emerge.

Hysteresis loop classification and corresponding pore morphology of low temperature nitrogen adsorption.
-
1.
The No. 6 and No. 8 soft coals were classified as category B, as shown in Fig. 5a and b. The adsorption isotherms and desorption isotherms exhibited incomplete overlap, with substantially coincident curves in the higher section of P/P0 and the lower section of P/P0, showing a distinct inflection point at P/P0 of about 0.5. Both hard coal samples displayed significant adsorption hysteresis within 0.45 < P/P0 < 0.98, characterized by similarly shaped hysteresis loops of considerable size, indicating well-developed porosity39. The adsorption isotherms initiated at P/P0 ≈ 0.01 rather than zero, suggesting the presence of microporous structures. Strong N2 adsorption within the coal matrix caused rapid initial adsorption capacity increase, with no desorption observed in this region. When P/P0 < 0.9, the adsorption capacity exhibited a gradual linear increase. Upon exceeding P/P0 > 0.9, the adsorption capacity rose sharply, while the desorption curve exhibited a sharp drop at P/P0 ≈ 0.52. Based on Eqs. (1)–(3)42 the calculated pore size of 4.3 nm suggests that micropores < 4.3 nm in coal predominantly consist of cylindrical pores with a single open end. At higher P/P0 values, the desorption rate remained slow until the bottleneck was overcome, after which it accelerated rapidly, accompanied by a sharp decline in the desorption curve. This behavior implies that pores > 4.3 nm micropores are predominantly characterized by ink bottle and slit shaped geometries.
$${d_p}=2({r_m}+t)$$(1)$${r_m}= - \frac{{0.953}}{{\ln (P/{P_0})}}$$(2)$$t= - 0.354{\left[ {\frac{5}{{\ln (P/{P_0})}}} \right]^{\frac{1}{3}}}$$(3) -
2.
The No. 6 and No. 8 hard coals were classified as category C, as illustrated in Fig. 5c and d. The adsorption and desorption isotherms exhibited close alignment, indicating low porosity and poor pore connectivity. The pore structure predominantly comprised semi closed cylindrical pores and open slit shaped pores. At P/P0 < 0.9, the adsorption isotherm displayed gradual ascent, whereas a rapid increase occurred at P/P0 > 0.9. However, no significant slope variation was observed as relative pressure approached unity, suggesting the coexistence of transitional pores and mesopores. Capillary condensation phenomena were evident, with the desorption isotherm showing a sharp decline exclusively at high relative pressures43. A narrow hysteresis loop emerged, characteristic of ink bottle type pores. The adsorption and desorption curves converged at P/P0 = 0.5, corresponding to a critical pore diameter of 4.10 nm. For pore diameters below 4.10 nm, semi closed cylindrical pores predominated, whereas diameters exceeding 4.10 nm were primarily associated with primarily wedge-shaped pores and partially open slit shaped pores.
Fig. 5 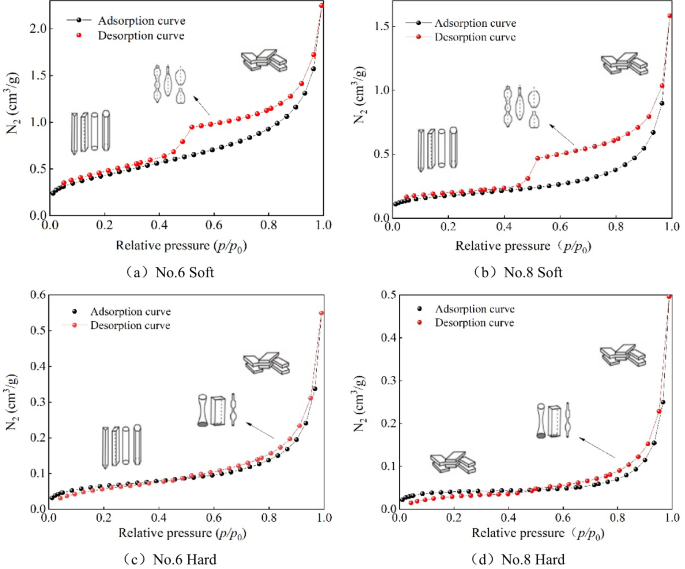
Adsorption and desorption curve of the coal sample.

Distribution characteristics of pore volume and pore specific surface area
According to the low temperature nitrogen test, the non-local density functional theory (NLDFT) was employed to analyze the sample data37. According to the pore size classification method of Hodot44 coal pores were divided into macropores (> 1000 nm), mesopores (100–1000 nm), transition pores (10–100 nm), and micropores (< 10 nm). The pore volume differential distribution characteristics Fig. 6 and specific surface area differential distribution characteristics Fig. 7 of coal samples were derived from the adsorption data. Given that the low temperature nitrogen adsorption test predominantly detects pore sizes within the 2–100 nm range, the analysis focused exclusively on micropores < 10 nm and transition pores 10–100 nm.

Differential distribution characteristics of coal sample pore volume.

Differential distribution characteristics of specific surface area of coal sample pore.
The pore volume distribution characteristics of coal seam samples indicated that the pore volume distribution curves of the four coal samples exhibited significant variations with increasing pore size, displaying multimodal features. A consistent overall trend was observed, manifesting an initial increase followed by a decrease. The primary pore volume distribution curves of hard coal samples demonstrated similarities, with maximum values occurring at approximately 10 nm. Notably, the pore volume development in the 10–50 nm range followed a decreasing-increasing-decreasing pattern. The most rapid pore volume increase in hard coal was observed at 5–10 nm, peaking around 10 nm. This suggested that the dominant pore distribution range for hard coal samples was 5–10 nm, though the specific pore development ranges differed slightly between the two coal seams. In the range of < 5 nm aperture, the No. 8 hard coal showed negligible pore volume development, whereas the No. 6 hard coal exhibited measurable growth. This implied that while the primary pore distribution range for the No. 6 hard coal was 5–10 nm, it maintained significant development in sub 5 nm micropores, in contrast to the No. 8 hard coal which demonstrated minimal development in this micropore range. Analysis of the soft coal samples revealed that the pore volume of No. 8 coal samples exhibited the most rapid increase within the 5–10 nm pore size range, reaching its maximum value at approximately 10 nm. This indicates that the predominant pore development range for No. 8 soft coal samples was 5–10 nm. In contrast, the pore volume of No. 6 coal samples showed accelerated growth in the 1–5 nm range, attaining its peak value at around 2 nm, suggesting exceptionally developed pore structures within this size range. Integration of the pore size distribution curves revealed that soft coal samples exhibited greater total pore volumes compared to hard coal samples, with the maximum value recorded in the No. 6 soft coal samples.
Based on the pore specific surface area distribution map of coal seam coal samples, the pore specific surface area and pore volume distributions of the four coal samples exhibited similar patterns, characterized by an initial increase followed by a decrease. For hard coal samples, the No. 6 coal demonstrated maximum values in the 2–3 nm and 5–10 nm pore size ranges, respectively, with a diminished rate of increase observed in the 10–50 nm range. This observation suggests relatively developed pore specific surface areas within these two dominant pore size ranges. In contrast, the three peaks of the No. 8 coal sample are concentrated in the vicinity of the pore size of 10 nm. Notably, no significant pore development is observed in the 2–5 nm range. This indicates that the specific surface area of the No. 8 coal is dominated by pores near 10 nm, while pores below 5 nm remain underdeveloped. Sub 5 nm pores were virtually undeveloped in this sample. For soft coal samples, both specimens showed similar pore-specific surface area characteristics, with maximum values occurring in the 2–3 nm range. This indicates that the specific surface area of soft coal was predominantly contributed by sub 3 nm pores. Notably, the No. 6 soft coal displayed the most pronounced increase in specific surface area, consistent with the pore volume growth trend observed in prior measurements.
To facilitate the analysis of data trends, the microporous and transitional pore phase pore volume, pore volume ratio, pore specific surface area, and pore specific surface area ratio of the samples were calculated based on the experimental data, as shown in Table 2. The distributions of phase specific pore volume and specific surface area ratio were presented as stacked bar charts (Figs. 8 and 9).

Schematic diagram of coal sample hole volume ratio.

Proportion of specific surface area of coal sample hole.
According to Table 2, for soft and hard coal samples from different coal seams, the No. 6 coal exhibited greater total pore volume and specific surface area compared to the No. 8 coal, with maximum values of 0.00323 cm³·g⁻¹ and 0.582 m²·g⁻¹, respectively. For the same coal seam, soft coal samples demonstrated significantly higher specific surface area than hard coal samples, suggesting that both pore volume and specific surface area increase with coal crushing degree.
As shown in the Fig. 4, for coal samples from the same seam, progressive coal fragmentation led to a consistent increase in micropore volume proportion accompanied by a corresponding decrease in transition pore volume proportion. Furthermore, the specific surface area of pores exhibited an analogous trend. Among the four coal samples with developed micropores, the No. 6 soft coal exhibited the highest proportions of micropore volume 41.18% and specific surface area 74.57%. Micropores were the primary sites for coal adsorption. As the microporous volume and specific surface area increased, the methane adsorption capacity also increased. Therefore, the No. 6 coal demonstrates significantly stronger gas adsorption capacity than the No. 8 coal, with the soft layered coal exhibiting particularly enhanced adsorption characteristics.
Pore fractal characteristic
The fractal dimension was calculated using the FHH fractal model45 based on the relatively stable adsorption phase, as shown in Fig. 10.

Fractal dimension fitting based on low temperature nitrogen adsorption data.
The adsorption hysteresis observed in the N2 adsorption isotherm of coal was primarily attributed to distinct gas adsorption mechanisms operating at different pressure stages. At low pressures, adsorption was primarily driven by van der Waals forces interacting with the coal surface, with surface roughness exerting a pronounced influence on adsorption capacity. In contrast, capillary condensation emerged as the predominant mechanism under elevated pressures, where adsorption behavior became critically dependent on the internal pore architecture46,47. The maximum separation between adsorption and desorption branches occurred at P/P0 ≈ 0.5, corresponding to obvious adsorption hysteresis occurred. This characteristic was reflected in the FHH fractal dimension calculation, where the distribution pattern of data points exhibited certain changes before and after P/P0 = 0.5. Based on this, a segmented regression method was employed to independently analyze the experimental data from the two pressure intervals. This methodology enables simultaneous determination of both pore fractal dimension (Df1) and pore surface fractal dimension (Df2), with their average value Df calculated as shown in Table 3.
The experimental data presented in Table 3 were systematically compared and analyzed. Within the framework of the FHH model, the fractal dimensions Df1 and Df2 ranged from 2 to 3, demonstrating that the analyzed coal samples exhibited fractal characteristics in both microscopic pore structures and pore surface morphology. The Df1 value range from 2.39 to 2.73 with a goodness-of-fit R2 of 0.99, indicating excellent model agreement. For Df2, the dimension values varied between 2.48 and 2.67, corresponding to R² values ranging from 0.83 to 0.99. In hard coal samples, the highest pore fractal dimension Df1 of the No. 6 coal was 2.56, whereas the No. 8 showed the maximum surface fractal dimension Df2=2.67. Conversely, in No. 6 soft coal demonstrated a significantly elevated Df1 value of 2.73, surpassing the Df2 maximum of 2.63 recorded in No. 8 soft coal. The No. 6 soft coal demonstrated the highest comprehensive fractal dimension Df value of 2.605, revealing the most significant pore structure heterogeneity within this particular specimen. Fractal dimension analysis of the whole coal seam demonstrated that the soft coal samples exhibited a higher Df1 value compared to the hard coal samples. However, no statistically significant regularity was observed in the Df2 values between the two sample types. This indicated that with increasing coal body damage, Df1 exhibits a gradual increasing trend, while the pore structure complexity progressively intensifies.

SEM original images of the four groups of coal samples.
As indicated in Table 3, the fractal dimension Df1 exhibits a high degree of fitting. When combined with the scanning electron microscope SEM observations Fig. 11, the fractal characteristics of pore structures can be further elucidated. Figure 11c reveals distinct pore morphology differences between the two samples: In No. 6 soft, localized regions display densely distributed pores with heterogeneous shapes, complex connectivity pathways, and irregular spatial arrangements, forming a disordered pore network. This multi scale morphological complexity and non-directional clustering directly reflect the high structural heterogeneity of the internal pore system. In contrast, No. 8 hard exhibits uniform pore geometries with well-defined boundaries. Most pores align along a consistent orientation, lacking localized dense or sparse regions. Such simplified connectivity patterns demonstrate the structural regularity of its pore network. These observations align closely with the elevated Df1 values derived from the FHH model in low temperature nitrogen adsorption experiments, confirming the consistency between microstructural features and fractal analysis.
T 2 spectrum characteristics
The T2 spectra of hard coal samples form the No. 6 coal and the No. 8 coal were obtained by a low field nuclear magnetic resonance (NMR) system, with the results presented in Fig. 12. Comparative analysis of T2 spectra between saturated water and residual water states revealed three distinct pore classifications: adsorption pores, transition pores, and free pores. Adsorption pores function as primary gas storage spaces, whereas transition and free pores serve as conduits for gas migration. Saturated water samples exhibited T2 spectra encompassing all detectable pore signals, whereas residual water state spectra primarily reflected all adsorption pores and partial transition pores. The three pore types exhibited distinct peak characteristics in NMR spectra, enabling clear differentiation through characteristic T2 relaxation responses48.
As shown in Fig. 12a, the T2 spectrum of saturated water coal sample from the No. 6 coal exhibited a trimodal structure characterized by a dominant peak and two minor continuously distributed sub-peaks. The spectral peaks range ware distributed from small to large in 0.01–1, 10–100, and 100–1000ms. The main peak was observed at near 0.3ms, corresponding to the adsorption pore development range. Notably, the T2 spectrum exhibited minimal variation post centrifugation, which can be attributed to the small pore sizes retaining bound fluid under centrifugal forces. The transition pore peak appeared at near 23ms, displaying lower amplitude relative to the adsorption pore and partial disappearance after centrifugation. The free pore peak was mainly distributed near 333ms, and was completely absent in the centrifuged T2 spectrum. Based on the T2 spectral analysis, the quantity, distribution, and continuity of peaks reflected the hierarchical pore development in coal samples49. Significantly, over 50% of the T2 spectral area for No. 6 coal was concentrated in the 0.01-1ms range, indicating extensive adsorption pore development. A clear discontinuity between the primary and secondary peaks was observed, while the two minor peaks showed continuous development. This suggests restricted connectivity between adsorption and transition pores, but effective interconnectivity between transition and free pores.
As shown in Fig. 12b, the T2 spectrum of the saturated water No. 8 coal sample displayed a triplet peak structure, showing peak values of the spectrum distributed from small to large near 0.3, 8.0, and 107ms. The T2 spectrum area in the 0.01-1ms section of No. 8 coal was smaller than that of No. 6 coal, demonstrating a lower degree of adsorption pore development and a more optimized connectivity of interpore. The continuous development of two secondary peaks indicated favorable connectivity between transitional pores and mobile pores.

Distribution of T2 spectrum of experimental coal sample.
Porosity and permeability characteristics
Porosity was a critical parameter for characterizing the seepage conditions of coal reservoirs and exhibited a linear correlation with nuclear magnetic signals50. The standard porosity sample was calibrated with water, establishing a linear relationship between nuclear magnetic signals and porosity. Subsequently, the porosity of the saturated coal sample was calculated based on NMR test results. The signal amplitude derived from the T2 spectrum was substituted into Eq. (4) to calculate the nuclear magnetic porosity of the corresponding coal sample.
Where,φNMR is the nuclear magnetic porosity, % ; S is the T2 spectrum integral area; V is the volume, cm3.

Water calibration porosity curve.
The porosity curve obtained from saturated water coal samples (Fig. 13) was employed to determine the nuclear magnetic resonance (NMR) porosity. According to the division of φF and φB from Fig. 14, calculate the IFF and IBV using the following equation:51
Where, φF is the movable fluid (effective ) porosity; φB is the bound fluid ( residual ) porosity; IBV is the bound fluid saturation, %; IFF is the movable fluid saturation, %.
The nuclear magnetic resonance (NMR) permeability models for coal masses primarily included two types: the free fluid model and the mean fluid model52. This study adopted the free fluid model for calculation, with the following expression:
Where, K is nuclear magnetic permeability; C is formation-related coefficient.
The data for T2c (effective porosity and residual porosity threshold), nuclear magnetic resonance porosity, and permeability were obtained through analysis of the cumulative porosity distribution curves before and after centrifugation. These parameters are visually demonstrated in Fig. 14, with their corresponding values systematically summarized in Table 4.

Effective porosity curve of saturation centrifuge combined measurement.
As shown in Table 4, the T2c value representing the boundary threshold between bound and movable fluids of sample No. 6 hard coal is 0.77 ms, significantly higher than that of No. 8 hard coal 0.55ms. This indicates a higher boundary threshold for fluid mobility in No. 6. Consequently, the bound fluid saturation of No. 6 hard coal reaches 64.19%, substantially exceeding the 50.95% observed in No. 8 hard coal. In contrast, the free fluid saturation of No. 6 hard coal is only 35.81%, markedly lower than that of No. 8 hard coal 49.05%. Although No. 6 hard coal exhibits a higher total porosity, its effective porosity is merely 0.57%, lower than the 0.74% of No. 8 hard coal. Furthermore, the permeability of No. 6 hard coal (0.013 × 10⁻³mD) is significantly reduced compared to No. 8 hard coal (0.030 × 10⁻³mD).
Based on the previous analysis, the pore network in soft coal predominantly comprises closed, irregular ink bottle and slit shaped pores. Progressive coal fragmentation induces systematic increases in both pore volume and specific surface area, accompanied by elevated fractal dimension Df1 values that reflect enhanced structural irregularity. Micropores < 10 nm demonstrate particularly significant development, as evidenced in No. 6 soft coal sample where these nanopores constitute 41.18% of total pore volume, collectively exhibiting characteristic “high porosity” features.
From gas migration perspectives, effective porosity emerges as the critical control parameter. Hard coal specimens from the No. 6 seam exhibit remarkably low effective porosity 0.57%. The proportion of effective pores that are interconnected and allow fluid flow in the total pores is extremely low. Furthermore, a pronounced discontinuity exists between adsorption pores and transition pores within this coal seam, resulting in impaired pore connectivity. Elevated closed pore content in soft coal synergizes with increased Df1 values to intensify pore structure heterogeneity. This interaction obstructs gas seepage pathways and limits methane migration capacity, reflecting key characteristics of “low permeability” systems. Therefore, it was demonstrated that effective porosity could effectively characterize the permeability capacity of coal. The dominant control on coal permeability lies not in total porosity, but in effective porosity – more precisely, interconnected pores that allowed fluid flow under pressure. This parameter provided crucial significance for evaluating fracture development.
The influence of pore structure on gas adsorption and desorption
Figure 15 presents the isothermal adsorption curves of different coal samples, gas desorption rate versus time, and gas desorption volume versus time.

Variation diagram of gas adsorption and desorption law of different coal samples.
As shown in Fig. 15a, the gas adsorption capacity of all coal samples increases nonlinearly with rising pressure, following the characteristics of the Langmuir curve53. The gas pressure had a certain influence on the adsorption properties of coal. The gas adsorption amount of the coal sample increased rapidly at first, then decreased gradually with the increase of pressure, and finally reached a saturated state. The slopes of the isothermal adsorption curves varied among coal samples, and gas adsorption rates differed across pressure ranges. Within specific pressure ranges, elevated pressure was found to promote gas adsorption in coal samples, whereas the adsorption amount stabilized when exceeding critical pressure thresholds.
Figure 15b and c illustrated the temporal evolution of gas desorption rate and cumulative gas desorption volume, respectively. The dynamic characteristics of gas desorption were categorized into three distinct stages: rapid decline, deceleration phase, and stabilization. During the initial stage 0–0.2 min, the gas desorption rate sharply declined while the gas desorption volume rapidly increased. In the subsequent stage 0.2–0.6 min, the decreasing trend of the gas desorption rate gradually slowed and the growth of the gas desorption volume decelerated. In the final stabilization stage 0.6–1 min, the gas desorption rate stabilized, asymptotically approaching zero, and the gas desorption volume plateaued. When the gas desorption time approaches 1 min, the desorption rate declines to near-zero values, while the cumulative gas desorption amount attains its maximum. This phenomenon suggests a rapid gas release rate accompanied by a shortened desorption period. Furthermore, comparative analysis reveals that soft coal samples exhibit significantly higher desorption rates and cumulative amounts than hard coal samples. These findings demonstrate a positive correlation between the degree of coal fragmentation and both gas desorption rate and total desorption capacity54. Figure 15b demonstrates that among the four coal samples, the soft coal from the No. 6 coal seam exhibited the highest initial gas desorption rate. Specifically, its measured value reached 1993.2598 ml/min. This suggests that the gas desorption rate of No. 6 coal was higher than that of No. 8 coal, corresponding to a greater propensity of gas outbursts55. This phenomenon might have been associated with its internal pore distribution characteristics.
The adsorption process of coalbed methane followed the Langmuir monolayer adsorption theory53. Under specific temperature and pressure conditions, this gas adsorption behavior could be mathematically described by the Langmuir Eq.
Where, VL is Langmuir volume, cm3/g, which represents the volume of adsorbed gas when coal is saturated. PL is Langmuir pressure, Mpa, which represents the corresponding adsorption pressure when the gas adsorption capacity reaches half of Langmuir volume. P is adsorption pressure, MPa. V is the gas adsorption amount corresponding to the adsorption pressure P, cm3/g. The adsorption parameters VL and PL obtained by Langmuir equation fitting are shown in Table 5.
The data demonstrated that coal samples with higher Langmuir volume VL values exhibited stronger gas adsorption capacities. Under isothermal conditions, soft coal demonstrated significantly higher gas adsorption capacity compared to hard coal. This suggests that coal pulverization enhances gas adsorption behavior. Notably, the No. 6 soft coal by the unit mass of pulverized coal achieved the maximum saturated gas adsorption capacity of 22.8081 m³·t⁻¹ among all pulverized coal samples. Furthermore, comparative analysis revealed that regardless of coal type, soft or hard, the No. 6 coal consistently demonstrated greater saturated gas adsorption capacity than the No. 8 coal.
The adsorption and desorption performance were closely related to the microscopic pore structure of coal56. Therefore, pore structure parameters obtained through low temperature nitrogen adsorption tests were employed to investigate their effects on gas adsorption and desorption characteristics. The VL (volume parameter) was adopted to quantify the gas adsorption capacity, while the initial desorption rate Δp (initial rate of gas desorption) was utilized to evaluate the gas desorption capacity. The correlation between the pore structure parameters (pore volume, pore specific surface area, fractal dimension) and VL, Δp were drawn as shown in Figs. 16 and 17.

Relationship between micropore parameters and adsorption desorption parameters.

Relationship between micropore parameters and adsorption desorption parameters.
The micropore volume and specific surface area of coal samples demonstrated significant linear correlations with both the Langmuir volume (VL) and the initial gas desorption rate (Δp), showing correlation coefficients ranging from 0.95 to 0.98. These results suggest strong positive relationships, where higher VL values were associated with greater gas adsorption capacity, and elevated Δp values indicated enhanced gas emission potential. The pore surface fractal dimension (Df2) was primarily indicative of surface roughness in micropores, whereas the pore fractal dimension (Df1) characterized pore structure heterogeneity. Data analysis indicated no statistically significant linear correlations between Df2 and either VL or Δp. In contrast, Df1 exhibited moderate linear relationships with VL, Δp, yielding correlation coefficients of 0.81 and 0.83, respectively. This suggested that surface roughness in micropores exerts negligible effects on gas adsorption and desorption rates, whereas pore structure complexity and heterogeneity significantly influence these processes. Notably, enhanced heterogeneity in pore structure significantly improves gas adsorption capacity while concurrently promoting gas desorption efficiency.
Coal exhibits significant gas adsorption capacity, a phenomenon attributed to multiple contributing factors. The well-developed micropore volume and specific surface area provide abundant adsorption sites for gas molecules57. For instance, the micropore specific surface area of No. 6 soft coal from reaches 0.434 m²/g. The pore structure is predominantly characterized by closed, irregular ink bottle type and slit type morphologies, contributing to enhanced gas retention capacity. This observation is corroborated by T2 spectra, which reveal a high proportion of adsorption pores in No. 6 coal seam, indicating substantial gas storage space. Furthermore, increased coal fragmentation elevates the fractal dimension Df1, reflecting enhanced pore structure complexity and heterogeneity. These structural modifications ultimately amplify the overall adsorption capacity.
Conclusion
-
1.
The adsorption and desorption curves of soft and hard coal obtained through low temperature nitrogen tests can be categorized into two types: B and C. For soft coal, pores smaller than 4.3 nm primarily consist of single ended open cylindrical pores, while those larger than 4.3 nm are predominantly ink bottle pores and slit type pores. For hard coal, pores below 4.10 nm are mainly single ended open cylindrical pores, whereas pores exceeding 4.10 nm are dominated by wedge shaped pores and partially open slit type pores. As the degree of coal crushing intensified, the micropore volume, proportion of pore specific surface area and irregularity of pore structure exhibited a progressive increase. The proportions of micropore volume and specific surface area in No. 6 soft coal are 41.18% and 74.57%, respectively.
-
2.
Nuclear magnetic resonance (NMR) characterization reveals that the T2 spectra of hard coal samples exhibit a triplet peak structure. Significant variations are observed in pore size distribution and connectivity across different coal seams. The No. 6 coal demonstrates well-developed adsorption pores, less developed transition pores, and impaired pore connectivity. This pore structure characteristic results in a high nuclear magnetic porosity for No. 6 coal. However, its effective porosity is merely 0.57%, with permeability as low as 0.013 × 10⁻³mD, exhibiting a typical “high porosity and low permeability” characteristic. These findings suggest that coal permeability is predominantly governed by effective porosity. When adsorption pores dominate the pore structure, the concomitant deficiency in transition pores and poor connectivity create inadequate pathways for gas seepage, ultimately leading to low permeability.
-
3.
The correlation analysis between micropore parameters and adsorption and desorption parameters was conducted, revealing that the micropore structure exerts dominant control over gas adsorption and desorption characteristics. The increase in micropore volume and specific surface area of pores in coal significantly enhances its gas adsorption capacity while concurrently accelerating the initial gas desorption rate. These correlations demonstrate strong positive relationships, with determination coefficients ranging from 0.95 to 0.98. The surface roughness (Df2) within the micropore range exhibits no significant correlation on gas adsorption capacity or emission rate. Conversely, the complexity and heterogeneity of pore structure development (Df1) influence gas adsorption capacity and emission rate. Specifically, increased heterogeneity in the internal pore structure corresponds to enhanced gas adsorption capacity and emission performance, with correlation coefficients between 0.81 and 0.83. The micropore volume and specific surface area of coal constitute the most principal parameters governing the gas adsorption and desorption characteristics.
Data availability
The datasets generated and/or analysed during the current study are not publicly available due [the policies and confidentiality agreements adhered to in our laboratory] but are available from the corresponding author on reasonable request. We express our sincere gratitude for the editor’s diligent attention and acknowledgment of our research endeavors.
References
Niu, H. Y. et al. Study of the microstructure and oxidation characteristics of residual coal in deep mines. J. J. Clean. Prod. 373, 133923 (2022).
Jing, Z. R., Min, X. Y., Li, S. J., Li, J. Y. & Song, W. Trade-off or synergy? The impacts of coal energy consumption on compound system vulnerability: a perspective from coal resource base assessment. J. Ecol. Indic. 170, 113124 (2025).
Chao, J. K., Liu, S., Pan, R. K., Yuan, Y. F. & Hu, D. M. Study on the thermal effect of coal oxidation under different stresses. J. Sci. Total Environ. 915, 169843 (2024).
Hu, D. M., Pan, R. K., Chao, J. K., Jia, H. L. & Liu, W. Spontaneous combustion characteristics of hydrothermal erosion coal from deep mining and its microscopic mechanism. J. Energy 314, 134268 (2025).
Li, J. et al. Key techniques for precise measuring gas content in deep coal mine: In-situ pressure- and gas-preserved coring. J. Int. J. Min. Sci. Technol. 35, 589–607 (2025).
Qiao, Z., Li, C. W., Wang, Q. F. & Xu, X. M. Principles of formulating measures regarding preventing coal and gas outbursts in deep mining: based on stress distribution and failure characteristics. J. Fuel 356, 129578 (2024).
Chen, X. J., Li, L. Y., Wang, L. & Qi, L. L. The current situation and prevention and control countermeasures for typical dynamic disasters in kilometer-deep mines in China. J. Saf. Sci. 115, 229–236 (2019).
Xu, C., Yang, T., Wang, K., Fu, Q. & Ma, S. H. Gas extraction of coal seam roof fractured zone in china: a review. J. Fuel 357 (C), 129930 (2024).
Liu, H. H., Mou, J. H. & Cheng, Y. P. Impact of pore structure on gas adsorption and diffusion dynamics for long-flame coal. J. J. Nat. Gas Sci. Eng. 22, 203–213 (2015).
Li, F. L., Jiang, B., Song, Y., Cheng, G. X. & Lu, G. W. Multifractal behavior of the micro- and mesopore structures of brittle tectonically deformed coals and its influence on methane adsorption capacity. J. Energy Fuels 35 (4), 3042–3064 (2021).
Lu, Z. et al. Investigation of pore structure and adsorption/desorption properties of coal in the non-uniform stress zone: implications for coal and gas outburst. J. Nat. Resour. Res. 33 (3), 1247–1268 (2024).
Shen, S. K., Wang, H. F., Ren, T. W. & Wang, Z. Y. Research on the pore structure and gas adsorption/desorption characteristics of tectonic coal in minor fault zone: implications for coal and gas outbursts. J. Powder Technol. 456, 120846 (2025).
Clarkson, C. R. et al. Pore structure characterization of North American shale gas reservoirs using USANS/SANS, gas adsorption, and mercury intrusion. J. Fuel 103, 606–616 (2013).
Zhang, Y. et al. Anisotropic feature of microflow in original coal pore system: the transition controlled by pore microscopic structure. J. Int. J. Rock. Mech. Min. Sci. 192, 106158 (2025).
Huang, H. Z., Zhou, W. B., Tong, C. X., Wen, Z. C. & Zhang, Q. M. Pore and chemical structure variation of tectonically deformed coal and their influences on methane adsorption. J. Gas Sci. Eng. 140, 205658 (2025).
Shubham, K. et al. Integration of fluid-invasive, scattering, and imaging methods in resolving pore structures in coal and shale. J. Fuel 395, 135185 (2025).
Wang, T. et al. Pore structure of deep coal of different ranks and its effect on coalbed methane adsorption. J. Int. J. Hydrogen Energy 59, 144–158 (2024).
Zang, J., Liu, J. L., He, J. B. & Zhang, X. P. Characterization of the pore structure in Chinese anthracite coal using FIB-SEM tomography and deep learning-based segmentation. J. Energy 282, 128686 (2023).
Rahman, T., Hazra, B. & Vishal, V. Pore structure evolution of Jharia coal for potential underground coal thermal treatment and associated CO2 sequestration. J. Fuel 381, 133577 (2025).
Salmachi, A. et al. Experimental study of the impact of CO2 injection on the pore structure of coal: a case study from the Bowen basin, Australia. J Int. J. Coal Geol. 275, 104314 (2023).
Nandi, S. P. & Walker, P. L. Activated diffusion of methane from coals at elevated pressures. J. Fuel 54 (2), 81–86 (1975).
Pan, J. N., Zhang, Z. Z., Li, M., Wu, Y. W. & Wang, K. Characteristics of multi-scale pore structure of coal and its influence on permeability. J. Nat. Gas Ind. B 6 (4), 357–365 (2019).
Zhang, M. et al. Determinations of the multifractal characteristics of the pore structures of low-, middle-, and high-rank coal using high-pressure mercury injection. J. J. Pet. Sci. Eng. 203, 108656 (2021).
Yue, J. W. et al. Investigation of pore structure characteristics and adsorption characteristics of coals with different destruction types. J. Adsorpt. Sci. Technol. 37 (7–8), 623–648 (2019).
Wang, K. et al. Analysis of the current development status and application prospects of coal reservoir microstructure characterisation technology. J. Renew. Sustain. Energy Rev. 221, 115939 (2025).
Ni, G. H. et al. Study on the effect of acidification reaction conditions on the pore structure of coal samples based on 2D NMR T1-T2. J. Adv. Powder Technol. 36 (3), 104792 (2025).
Yao, Y. B. & Liu, D. M. Comparison of low-field NMR and mercury intrusion porosimetry in characterizing pore size distributions of coals. J. Fuel 95 (1), 152–158 (2012).
Qin, L. et al. Accurate characterization method of coal pore and pore throat structure of different coal ranks based on two-dimensional NMR liquid nitrogen fracturing cycles. J. Fuel 341, 127729 (2023).
Zhao, Y. X., Sun, Y. F., Liu, S. M., Wang, K. & Jiang, Y. D. Pore structure characterization of coal by NMR cryoporometry. J. Fuel 190, 359–369 (2017).
Zuo, J. P., Peng, S. P., Li, Y. J., Chen, Z. H. & Xie, H. P. Investigation of karst collapse based on 3-D seismic technique and DDA method at Xieqiao coal mine, China. J. Int. J. Coal Geol. 78, 276–287 (2009).
Liu, T., Lin, B. Q., Zhao, Y., Zhai, C. & Zou, Q. L. Precise permeability enhancement technique with hydraulic flushing for coal seamswith non-uniformly distributed gas. J. Coal Sci. Technol. 51 (02), 217–231 (2023).
Yuan, L. Concept of gas control and simultaneous extraction of coal and gas. J. China Coal 36 (06), 5–12 (2010).
Hou, S. H. et al. Pore structure characterization of low volatile bituminous coals with different particle size and tectonic deformation using low pressure gas adsorption. J. Int. J. Coal Geol. 183, 1–13 (2017).
Sakurovs, R. et al. Pore size distribution and accessible pore size distribution in bituminous coals. J. Int. J. Coal Geol. 100, 51–64 (2012).
Zhang, L. W. et al. Effects of sequence stratigraphy on coal characteristics and CH4 adsorption capacity of the low-rank coal in Santanghu basin, China. J. J. Nat. Gas Sci. Eng. 81, 103467 (2020).
Chattaraj, S., Mohanty, D., Kumar, T., Halder, G. & Mishra, K. Comparative study on sorption characteristics of coal seams from Barakar and Raniganj formations of Damodar Valley basin, India. J. Int. J. Coal Geol. 212, 103202 (2019).
Qi, L. L., Tang, X., Wang, Z. F. & Peng, X. S. Pore characterization of different types of coal from coal and gas outburst disaster sites using low temperature nitrogen adsorption approach. J. Int. J. Min. Sci. Technol. 27, 371–377 (2017).
Zheng, S. J. et al. A multifractal-based method for determination NMR dual T2 cutoffs in coals. J. J. Pet. Sci. Eng. 214, 110488 (2022).
Nie, B. S., Liu, X. F., Yang, L. L., Meng, J. Q. & Li, X. C. Pore structure characterization of different rank coals using gas adsorption and scanning electron microscopy. J. Fuel 158, 908–917 (2015).
Wang, W. M. et al. Fractal nature of porosity in volcanic tight reservoirs of the Santanghu basin and its relationship to pore formation processes. J. Fractals 26, 2 (2018).
Everett, D. H. & Stone, F. S. The structure and properties of porous materials. M Lond. Butterworths 68–94 (1958).
Zhao, P. Q., Wang, Z. L., Sun, Z. C., Cai, J. C. & Wang, L. Investigation on the pore structure and multifractal characteristics of tight oil reservoirs using NMR measurements: permian Lucaogou formation in Jimusaer sag, Junggar basin. J. Mar. Pet. Geol. 86, 1067–1081 (2017).
Mastalerz, M., He, L. L., Melnichenko, Y. B. & Rupp, J. A. Porosity of coal and shale: insights from gas adsorption and SANS/USANS techniques. J. Energy Fuels 26 (8), 5109–5120 (2012).
Shi, X. H. et al. Micrometer-scale fractures in coal related to coal rank based on micro-CT scanning and fractal theory. J. Fuel 212, 162–172 (2018).
Pfeifer, P., Obert, M. & Cole, M. W. Fractal BET and FHH theories of adsorption: a comparative study. J. Proc. R. Soc. A Math. Phys. Eng. Sci. (1989).
Ni, G. H. et al. Effect of nitric acid on the pore structure and fractal characteristics of coal based on the low-temperature nitrogen adsorption method. J. Powder Technol. 367, 506–516 (2020).
Zheng, C. S., Liu, S. L., Xue, S., Jiang, B. Y. & Chen, Z. W. Effects of chemical solvents on coal pore structural and fractal characteristics: an experimental investigation. J. Fuel 327, 125246 (2022).
Xie, H. C. et al. The influence of surfactant on pore fractal characteristics of composite acidized coal. J. Fuel 253, 741–753 (2019).
Ni, G. H. et al. The effect of anionic surfactant (SDS) on pore-fracture evolution of acidified coal and its significance for coalbed methane extraction. J. Adv. Powder Technol. 30, 940–951 (2019).
Zhang, Y. R., Xu, S. X., Fang, Z. F., Zhang, J. Z. & Mao, C. J. Permeability of concrete and correlation with microstructure parameters determined by 1H NMR. J. Adv. Mater. Sci. Eng. 56, 1–11 (2020).
Yao, Y. B. et al. Petrophysical characterization of coals by low-field nuclear magnetic resonance (NMR). J. Fuel 89, 1371–1380 (2010).
Qin, L. et al. Changes in the petrophysical proper ties of coal subjected to liquid nitrogen freeze-thaw—a nuclear magnetic resonance investigation. J. Fuel 194, 102–114 (2017).
Bai, R. & Yang, R. T. A thermodynamically consistent Langmuir model for mixed gas adsorption. J. J. Colloid Interface 239 (2), 296–302 (2001).
Liu, P., Liu, A., Liu, S. M. & Qi, L. L. Experimental evaluation of ultrasound treatment induced pore structure and gas desorption behavior alterations of coal. J. Fuel 307, 121855 (2022).
Jiang, B. Y., Zhao, Y., Lin, B. Q. & Liu, T. Effect of faults on the pore structure of coal and its resultant change on gas emission. J. J. Pet. Sci. Eng. 195, 107919 (2020).
Ju, Y. W. et al. Micro-structural evolution and their effects on physical properties in different types of tectonically deformed coals. J. Coal Sci. Technol. 1, 364–375 (2014).
Guo, H. J. et al. Experimental investigation on the effect of multiscale pore characteristics of tectonic coal on gas adsorption/desorption and diffusion characteristics. J. Powder Technol. 444, 119945 (2024).
Acknowledgements
This work was supported by the National Natural Science Foundation of China (nos. 52104073), the Open Fund of State Key Laboratory of Water Resource Protection and Utilization in Coal Mining (no. NICE_RD_2023_144).
Funding
This work was supported by the National Natural Science Foundation of China (nos. 52104073), the Open Fund of State Key Laboratory of Water Resource Protection and Utilization in Coal Mining (no. NICE_RD_2023_144).
Author information
Authors and Affiliations
Contributions
Anying Yuan: Topic Selection Guidance, Propose Research Methods, Writing-Original Draft, Innovative Refining, & Review.Rongchen Wang: Experimental Operation, Data analysis, Review, Article Writing & Editing.Xiaolu Yang: Make Experimental Plan, Experimental Operation, Review & Article Revision.Pu Wang: Provide Samples, Auxiliary Experiment & Review.
Corresponding author
Ethics declarations
Competing interests
The authors declare no competing interests.
Additional information
Publisher’s note
Springer Nature remains neutral with regard to jurisdictional claims in published maps and institutional affiliations.
Rights and permissions
Open Access This article is licensed under a Creative Commons Attribution-NonCommercial-NoDerivatives 4.0 International License, which permits any non-commercial use, sharing, distribution and reproduction in any medium or format, as long as you give appropriate credit to the original author(s) and the source, provide a link to the Creative Commons licence, and indicate if you modified the licensed material. You do not have permission under this licence to share adapted material derived from this article or parts of it. The images or other third party material in this article are included in the article’s Creative Commons licence, unless indicated otherwise in a credit line to the material. If material is not included in the article’s Creative Commons licence and your intended use is not permitted by statutory regulation or exceeds the permitted use, you will need to obtain permission directly from the copyright holder. To view a copy of this licence, visit http://creativecommons.org/licenses/by-nc-nd/4.0/.
About this article

Cite this article
Yuan, A., Wang, R., Yang, X. et al. Integrated pore structure analysis and methane adsorption and desorption investigation in deep multi seam coal systems. Sci Rep 15, 34102 (2025). https://doi.org/10.1038/s41598-025-19347-2
Received:
Accepted:
Published:
Version of record:
DOI: https://doi.org/10.1038/s41598-025-19347-2
