
Abstract
This study aims to investigate the relationship between Environmental Fitness Support (EFS) scores and physical activity (PA), analyzing the non-linear and dose–response relationships between fitness environment support and different intensities of PA, as well as the impact of various environmental dimensions on PA intensity. Using data from the 2020 China National Fitness Activity Status Survey, a multi-stage stratified random sampling method was employed to select 5,760 village (resident) committees from 31 provinces, yielding 58,844 valid samples. The survey collected demographic information and environmental support factors (EFS scores), and used the International Physical Activity Questionnaire to measure PA intensity. Statistical analyses were conducted using R software, including multiple linear regression and Generalized Additive Models. The EFS scores are significantly associated with PA intensity. MVPA demonstrated a negative association at low EFS scores, turning positive near the threshold of 35.06 (95% CI: 32.50, 37.80) points. In the adjusted model, traffic safety was negatively associated with VPA (β = -0.13, p < 0.001), while fitness facility support and aesthetics were positively associated with VPA (β = 0.15, p < 0.001 and β = 0.05, p = 0.021). MPA was also positively influenced by fitness facility support and aesthetics (β = 0.42, p < 0.001 and β = 0.63, p < 0.001), with traffic safety positively associated with MPA (β = 0.24, p < 0.001), but accessibility showed a negative correlation with MPA (β = -0.07, p = 0.014). Environmental fitness support was associated with VPA significantly and moderately with MPA, while fitness facility aesthetics benefit both; however, traffic safety and infrastructure were negatively associated with VPA.
Introduction
Moderate physical activity (MPA) significantly benefits healthy populations by improving physical fitness1, enhancing cognitive function2, reducing depression, anxiety, and stress levels3,4, and lowering the prevalence of back pain5. Further research on moderate-to-vigorous physical activity (MVPA) also indicates that the low MVPA significantly increases the risk of chronic diseases, including type 2 diabetes, neurodegenerative diseases, metabolic syndrome, hypertension, and atherosclerotic cardiovascular disease6.
In recent years, the relationship between physical activity (PA) and environmental factors has gained significant attention in public health7,8. A prior study has shown a strong link between walking environments and residents’ PA levels9. While measuring walking environments provides insights into environmental support for health, it offers a limited perspective. In contrast, fitness activities emphasize a more holistic improvement of physical well-being, including cardiorespiratory endurance, muscle strength, flexibility, and body composition.
In 2021, The State Council of China issued the ‘Mass Fitness Plan (2021–2025)’10, which is based on the national mass fitness strategy. The first of the eight main points in the plan is to increase the supply of fitness facilities. While many policies have been implemented to promote the development of fitness environments, research focusing on environmental support for fitness is limited. Some studies use the Neighborhood Environment Walkability Scale (NEWS) scores to measure environmental support for PA11 However, NEWS is designed for urban communities, and has limitations in representativeness and generalizability, especially in China with its large rural population and vast geographical area.
Therefore, although research has explored the connection between walking environments and PA9,11, a systematic understanding of how more comprehensive fitness environments relate to various types of PA (including different intensities and forms) is lacking. Empirical studies in China that combine national strategies like the National Fitness Plan and national surveys to explore these relationships are unprecedented. Consequently, there is a need for nationwide studies, using weighted sampling and large-scale stratified random surveys, to fill this research gap.
This study aims to investigate the relationship between the Environmental Fitness Support (EFS) score and PA. It also seeks to identify the non-linear and dose–response relationships between fitness environment support and different intensities of PA, as well as analyze how various environmental dimensions support different intensities of PA. The study’s ultimate goal is to provide policymakers with data to inform more effective health interventions.
Methods
Survey methodology
The data for this study were derived from the 2020 China National Fitness Activity Status Survey, which is conducted every five years in mainland China to assess the level of physical exercise participation among residents. To ensure the representativeness of the sample, the survey employed a multi-stage stratified random sampling method, utilizing proportionate systematic probability sampling to select samples from all 31 provinces (autonomous regions and municipalities) across the nation.
The specific survey process consisted of three stages. The first stage involved county-level sampling, where 10 to 20 counties were randomly selected from each province (region, municipality) using probability sampling proportional to the local population size, considering regional economic development and geographical differences. The second stage constructed a sampling frame for all village (resident committees) committees under the selected counties based on data from the Sixth National Population Census. From this framework, 13 villages were randomly selected, proportionate to the urban–rural population ratio within the county. The third stage involved resident sampling. In the selected village, 20 eligible subjects aged above 20 years old were randomly selected from the survey participants. In total, 5,760 village committees were sampled from 471 counties across the nation, resulting in 58,844 samples of adults aged above 20 years old for further analysis.
Variables and methods
In this study, ‘Environmental Fitness Support’ (EFS) refers to a multidimensional neighborhood environmental construct encompassing built environment components (e.g., accessibility, infrastructure) and external conditions related to the provision of physical activity facilities, environmental quality, and traffic safety. To avoid ambiguity, the term ‘EFS’ is used consistently to refer to this specific construct. This study collected participants’ demographic information, including gender, urban–rural residence, ethnicity, occupation, educational attainment, household average annual income, and age. Independent variables included scores related to the exercise environment. This study employed a modified, abbreviated version of a neighborhood environment questionnaire focused on environmental characteristics for fitness activities, designed to assess environmental factors influencing residents’ fitness activities nationwide. This questionnaire was adapted from the NEWS12, an instrument used to measure neighborhood environment features associated with PA. This study, however, based on a national survey of fitness activities, aims to measure environment characteristics related to fitness activities, and encompasses both urban and rural areas, not being limited to urban neighborhoods. Consequently, the questionnaire length and number of items were reduced to enhance feasibility for large-scale data collection. We retained and shortened the subscales for Accessibility, Infrastructure for Walking and Cycling, Aesthetics, Traffic safety. A new subscale, focusing on fitness facility support, was added, concentrating on assessing the quantity and quality of fitness equipment, sports venues, and supporting facilities within the community. This ensured the questionnaire accurately captured fitness resources available to residents. The Environmental Fitness Support (EFS) score was calculated as a composite index based on five dimensions derived from the questionnaire: Accessibility, Infrastructure for Walking and Cycling, Aesthetics, Fitness Facility Support, and Traffic Safety. Each dimension’s raw score was standardized to a 0–100 scale and then combined using a weighted formula to produce the final EFS score, which also ranges from 0 to 100. A higher score indicates stronger environmental support for fitness activities. The detailed methodology for this calculation is provided in Supplementary File 1. Following adaptation, the questionnaire underwent test–retest and split-half reliability testing with a small sample (n = 1000). The scale’s overall internal consistency was good (total Cronbach’s α = 0.825), with subscale alphas ranging from 0.81 to 0.89. Construct validity was supported by a Kaiser–Meyer–Olkin value of 0.817.
For the dependent variables, data were collected using the International Physical Activity Questionnaire short form, to obtain the information about the past week for vigorous physical activity (VPA), MPA, and MVPA which were measured in METs-min/week. Based on the IPAQ scoring protocol, Vigorous Physical Activity (VPA) corresponds to activities of ≥ 6.0 Metabolic Equivalents (METs), while Moderate Physical Activity (MPA) corresponds to activities between 3.0–5.9 METs. Light physical activity was not included in our analysis, as the study’s primary focus was on health-enhancing MVPA, for which the self-report IPAQ instrument is most reliable13.
Control variables for all multivariable models were selected a priori based on established literature14,15,16 identifying key socio-demographic determinants of physical activity and included age, gender, urban/rural residence, ethnicity, occupation, educational attainment, and annual household income.
Statistical methods
This study utilized R software for statistical analysis. All analyses used microdata that had been pre-weighted according to the multistage stratified sampling design; therefore, no additional survey weights were applied at the modeling stage. Descriptive statistics for demographic variables were generated, and their unadjusted associations with physical activity were explored.
To analyze the relationship between EFS and physical activity, we employed a complementary two-part modeling strategy. Generalized Additive Models (GAMs) were employed to analyze the potentially non-linear relationship between the composite Environmental Fitness Support (EFS) score and the outcomes of VPA, MPA, and MVPA. We estimated the MVPA threshold as the nadir of the GAM-predicted EFS–MVPA curve, defined as the EFS score where the first derivative changed from negative to positive. A 95% CI for this threshold was obtained via non-parametric bootstrap with 1,000 resamples. For the EFS sub-dimensions, multiple linear regression models were constructed to estimate their independent associations with physical activity. All adjusted models controlled for the same set of demographic variables. The significance level was set at 0.05. The R code for these analyses is available in Supplementary File 1.
Declaration
This study was conducted in accordance with the Declaration of Helsinki. All research protocols were approved by the Approval Committee of the Ethical Committee of China Institute of Sport Science (CISS20191029). All investigators and subjects signed informed consent forms prior to the formal survey. All participants provided explicit informed consent to participate in this study. Clinical trial number: not applicable.
Results
Correlational analysis of demographic characteristics and PA
The detailed descriptive statistics and the full results of the bivariate analyses (including the Kruskal–Wallis H test and Spearman’s correlations) examining the relationships between all demographic variables and physical activity outcomes are presented in Supplementary File 2. This study examined the relationships between participants’ METs-min/week values for VPA, MPA, and MVPA, and their demographic characteristics (Table1). Males exhibited significantly higher VPA levels (M = 240, p < 0.001) compared to females. No significant gender difference was observed for MPA (p = 0.731). Urban residents demonstrated significantly higher levels of VPA (M = 160, p < 0.001), MPA (M = 240, p < 0.001), and MVPA (M = 600, p < 0.001) than their rural counterparts. Participants of Han ethnicity also showed significantly higher METs-min/week values for all activity types, with VPA (M = 160, p < 0.001), MPA (M = 240, p < 0.001), and MVPA (M = 560, p < 0.001) all being significantly elevated compared to other ethnicities. In terms of occupation, government and institutional leaders had notably higher VPA (M = 240, p < 0.001) and MPA (M = 320, p < 0.001), while participants in agriculture, forestry, and related occupations had relatively lower VPA values (M = 160, p < 0.001). Higher education level and annual household income were positively associated with PA levels, with participants in the ≥ 300,000 RMB income category having a VPA of 240 and participants in the < 20,000 RMB category having a VPA of 120 METs-min/week (p < 0.001). Younger participants (20–29 years) had significantly higher VPA values compared to older participants (≥ 80 years, VPA: M = 0, p < 0.001). In summary, demographic variables, including gender, residence, ethnicity, occupation, education, income, and age, significantly influenced PA across all intensity levels. Therefore, these factors were incorporated as control variables in subsequent analyses based on the specific dependent variable being modeled.
Relationship between EFS scores and PA
Figure 1(a) illustrates a positive linear relationship between VPA and the EFS score. As the EFS score increases, there is a significant increase in VPA measured in METs-min/week. Figure 1(b) shows a non-linear, curvilinear relationship for MPA. While changes in MPA are gradual at low EFS score levels, no distinct negative correlation is observed overall. Figure 1(c) suggests a potential negative association between MVPA and the EFS score at low score ranges. However, given the wide confidence intervals, this association is not definitive. As the EFS score approaches a threshold (35.06 points), this potential negative trend diminishes and reverses, resulting in a significant increase in MVPA with further increases in the EFS score. The full statistical outputs for the GAMs, including the effective degrees of freedom and significance tests for the smooth terms, are provided in Supplementary File 2.

Dose–response relationship between environmental factor scores and different intensities of physical activity. The x-axis represents EFS score. The y-axis represents the volume of physical activity (METs-min/week) at different intensities: (a) VPA, (b) MPA, and (c) MVPA.
Multiple regression analysis of the effect of EFS sub-dimensions on PA
The complete results for the multiple linear regression models, for both unadjusted and adjusted analyses, are presented in Supplementary File 2. The key associations are visualized in Fig. 2 and summarized below. In the unadjusted model, Fig. 2(a) shows that Traffic safety had a significant negative association with VPA (β = -0.13 [-0.16, -0.09], p < 0.001). Fitness Facility Support had a positive association with VPA (β = 0.14 [0.08, 0.21], p < 0.001). Aesthetics were also positively associated with VPA (β = 0.06 [0.02, 0.09], p = 0.006), while Infrastructure for Walking and Cycling showed a negative association (β = -0.06 [-0.10, -0.02], p = 0.005).
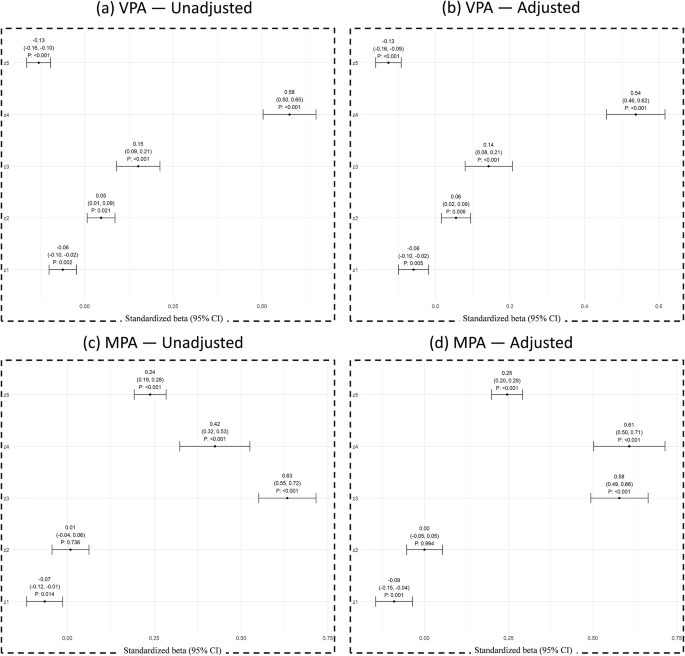
Forest Plot of Multiple Linear Regression of Environmental Factor Score Dimensions on VPA and MPA. This figure presents the results of multiple linear regression analyses examining the association between individual dimensions of EFS Score and VPA and MPA. z1-z5 represent: Accessibility, Infrastructure for Walking and Cycling, Aesthetics, Fitness Facility Support, and Traffic Safety, respectively. The dependent variable is VPA for (a) and (b), where (a) represents the model without adjusting for covariates, and (b) represents the model after adjusting for covariates. The dependent variable is MPA for (c) and (d), where (c) represents the model without adjusting for covariates, and (d) represents the model after adjusting for covariates.
Regarding MPA, Fig. 2(c) demonstrates that Traffic safety had a positive association with MPA (β = 0.25 [0.20, 0.29], p < 0.001). Fitness Facility Support had a significant positive association with MPA (β = 0.61 [0.50, 0.71], p < 0.001). Aesthetics also showed a significant positive association with MPA (β = 0.58 [0.49, 0.66], p < 0.001). Accessibility was significantly negatively associated with MPA (β = -0.09 [-0.15, -0.04], p = 0.001). The effect of Infrastructure for Walking and Cycling was not significant (p = 0.994).
In the adjusted model (Fig. 2(b)), Traffic safety had a significant negative association with VPA (β = -0.13 [-0.16, -0.10], p < 0.001). Fitness Facility Support had a positive and significant association with VPA (β = 0.15 [0.09, 0.21], p < 0.001). Aesthetics showed a positive and significant association with VPA (β = 0.05 [0.01, 0.09], p = 0.021). Infrastructure for Walking and Cycling had a significant negative association with VPA (β = -0.06 [-0.10, -0.02], p = 0.002). The effect of Accessibility on VPA was not significant.
When analyzing MPA in the adjusted model (Fig. 2(d)), Traffic safety had a positive association (β = 0.24 [0.19, 0.28], p < 0.001). Fitness Facility Support had a significant positive association (β = 0.42 [0.32, 0.53], p < 0.001). Aesthetics showed a significant positive association (β = 0.63 [0.55, 0.72], p < 0.001). The effect of Infrastructure for Walking and Cycling was not significant (p = 0.736). Accessibility had a negative association with MPA (β = -0.07 [-0.12, -0.01], p = 0.014).
Discussion
A supportive fitness environment was significantly positively associated with VPA, overall, a strong fitness environment effectively enhances participation in VPA. When engaging in MPA, individuals may rely more on personal factors rather than environmental support, such as family support for adolescents17 and intrinsic motivation related to physical fitness and well-being for adults18. Conversely, participation in VPA is more dependent on a well-structured fitness environment. Insufficient fitness support may negatively affect individuals’ exercise habits and attitudes, leading to instability in MVPA participation levels. Therefore, it is crucial to consider improvements in other aspects of communities with low fitness support to enhance MVPA.
Fitness Facility Support had a significant positive association with both VPA and MPA, with a more pronounced effect on MPA. Increased accessibility to fitness facilities is associated with a higher likelihood of individuals engaging in more PA. This is intuitive, as facilities like gyms and sports venues provide convenient settings for vigorous exercise. While fitness facilities positively influence both VPA and MPA, their association with MPA is stronger, suggesting that they play a larger role in promoting the adoption and participation in moderate-intensity activity. This may be because individuals tend to engage in moderate-intensity activities within these facilities. Research consistently demonstrates a positive association between the availability of exercise facilities and PA levels. For instance, one study19 reported that individuals with four or more exercise facilities within their buffer zones engaged in 5.4 more MVPA and exhibited a 69% higher likelihood of meeting recommended activity guidelines compared to those with no such facilities. Similarly, access to sports facilities has also been linked to increased participation in PA20. However, it’s important to note that the effect of outdoor facilities, such as park quality improvements, on PA is inconsistent21. It is therefore important to note that fitness facility support in this study includes facilities for sports, exercise, fitness-related venues rather than parks, etc., where PA alone takes place.
Accessibility showed no significant association with VPA, while higher accessibility was associated with lower MPA. This finding, that greater accessibility to activity locations is linked with a decrease in MPA, contrasts with the conventional view that improved access to daily life facilities promotes PA22. Similarly, another study noted that greater accessibility to public transport stops may weaken the relationship between accessibility and PA23. High accessibility often implies that essential amenities and locations are close to home, which may encourage individuals to engage in low-intensity activities such as leisurely walking rather than more strenuous moderate-intensity activities like brisk walking or running, particularly when travelling to these destinations.
Higher Aesthetics scores were associated with higher levels of both VPA and MPA. People tend to engage in more PA when they perceive their environment as aesthetically pleasing24, reflecting a preference for beautiful surroundings that can increase the enjoyment and motivation of exercise25. In this study, ‘Aesthetics’ encompasses not only design and visual appeal, but also environmental conditions such as the age of the environment, the type of residential community, and hygiene. When promoting PA, particular attention should be paid to this multifaceted dimension, especially when considering moderate-intensity activities.
Infrastructure for Walking and Cycling exhibited a significant negative association with VPA, while showing no significant association with MPA. Although increased provision of basic walking and cycling infrastructure is known to significantly increase residents’ walking volume26, this study suggests that it does not necessarily promote, and indeed may decrease, the propensity for VPA. This implies that the existing infrastructure may not adequately support moderate-to-high intensity activity, and that individuals may be primarily engaging in lower-intensity activities within these spaces.
Higher Traffic safety scores were associated with lower VPA and higher MPA. Prior research indicates that sufficient MVPA is associated with higher perceptions of pedestrian and cyclist safety for both children27 and adults28. However, these studies have not differentiated between VPA and MPA, and as such, the nuanced relationships have not been deeply examined. When individuals perceive higher traffic risks, they may be inclined to reduce their outdoor MPA and opt for more freely undertaken VPA in indoor or safer environments. Examples include high-intensity interval training (HIIT) at home, or high-intensity competitive sports in gyms or on sports fields. This disparity highlights strategic behavioral patterns related to the choice of activity type in response to varying perceptions of traffic risk.
This study presents several key innovations. First, it moves beyond the singular focus on walking environments in prior research by systematically exploring the association between more comprehensive fitness environments on PA across different intensities, including vigorous and moderate activity, and explicitly examines potential non-linear relationships. Second, grounded in the context of China’s ‘Mass Fitness Plan,’ this research utilized nationally representative, large-scale, stratified random weighted sampling survey data, effectively overcoming the limitations of geographical representation and generalizability often found in earlier studies. This approach ensures a higher degree of reliability and representativeness of the findings. Furthermore, the study provides an in-depth analysis of various environmental dimensions, such as facility type, accessibility, and quality, in their differential support of varying PA intensities. This approach offers policy makers more precise and targeted evidence for interventions. Through an empirical approach, this research addresses a gap in the field by providing nationally representative data specific to the Chinese context, thus contributing to the evidence base to further advance the implementation of the National Fitness Strategy and related policy development.
Regarding the multi-dimensional analysis of results, while there are slight discrepancies compared to the findings of previous studies, which generally indicate that built environment attributes, including destination accessibility, connectivity, walking and cycling infrastructure, safety, and aesthetics, are positively associated with PA29, these differences can likely be attributed to the varied focus of our assessment. Beyond the specific focus of our assessment, several factors may explain the discrepancies between our findings and those of some previous studies, particularly those conducted in Western contexts. First, methodological differences in environmental measurement are significant. Many prior studies rely on walkability indices, which primarily focus on features supporting utilitarian walking12,30. In contrast, our comprehensive EFS score captures a broader range of factors relevant to both recreational and transport-related activity, providing a more holistic view of the fitness environment.
Second, these methodological differences are crucial for understanding cultural and behavioral patterns specific to the Chinese context. For instance, the negative association we found between traffic safety and VPA may reflect a prevalent behavior where individuals prefer to undertake vigorous recreational activities (e.g., running, sports) in dedicated, safe environments like parks or gyms31,32, rather than on busy streets. This contrasts with MPA, which often includes necessary utilitarian walking that must be performed regardless of traffic conditions.
Finally, these behaviors are situated within the unique contextual factor of China’s rapid urbanization and distinct urban–rural dichotomy. This has created environmental configurations and transportation ecosystems—such as the high prevalence of e-bikes substituting for moderate-intensity walking33—that are not always comparable to those in other countries where much of the foundational research has been conducted.
Additionally, the extensive geographical scope of this study, encompassing diverse regions, with their interwoven factors such as altitude, climate, and culture, makes it challenging to fully isolate these individual influences, which may have contributed to the sub-dimensional variations in results. Nevertheless, this research offers a comprehensive, high-level analysis. Future investigations could build upon this work by incorporating geographical data from multiple national-level departments to further isolate these confounding factors, and establish a nationwide pseudo-cohort. This approach would help to overcome the limitations of cross-sectional designs and elucidate causal relationships.
Conclusions
Environmental fitness supportiveness had a significant positive association with VPA and a relatively small association with MPA, with a non-linear relationship with MVPA and a significant contribution to MVPA after EFS scores above 35.06. fitness facility support and aesthetics had a positive association with VPA and MPA, with traffic safety and walking and cycling infrastructure negatively correlated with VPA, and higher accessibility significantly associated with lower MPA.
Data availability
The data used in this study are derived from 2020 China National Fitness Activity Status Survey. Access to these data is restricted and requires formal application to the data owner, the General Administration of Sport of China (https://www.sport.gov.cn/n315/n329/). Due to the sensitive nature of the data and the potential for participant identification, the authors are unable to directly share the dataset with other researchers. However, inquiries regarding the data or potential collaborative research projects involving overlapping data are welcome and can be directed to Xiang Pan ( panxiang9804@163.com).
References
Garrone, O. et al. Moderate physical activity during neoadjuvant chemotherapy in breast cancer patients: effect on cancer-related inflammation and pathological complete response-the Neo-Runner study. ESMO Open 9, 103665. https://doi.org/10.1016/j.esmoop.2024.103665 (2024).
Maugeri, G. et al. Moderate Physical Activity Increases the Expression of ADNP in Rat Brain. Int. J. Mol. Sci. https://doi.org/10.3390/ijms25084382 (2024).
Martin-Del-Campo, F. et al. Moderate physical activity is associated with lower depression, anxiety and stress in health-care workers during the COVID-19 pandemic. J. Psychosom. Res. 174, 111488. https://doi.org/10.1016/j.jpsychores.2023.111488 (2023).
Thorenz, K., Sudeck, G., Berwinkel, A. & Weigelt, M. The Affective Responses to Moderate Physical Activity: A Further Study to Prove the Convergent and the Discriminant Validity for the German Versions of the Feeling Scale and the Felt Arousal Scale. Behav. Sci. (Basel) https://doi.org/10.3390/bs14040317 (2024).
Oliveira, C. B. S. et al. Replacing sedentary time or light physical activity with moderate physical activity is associated with a lower prevalence of back pain: a cross-sectional study using isotemporal analysis: Isotemporal substitution and LBP prevalence. Braz. J. Phys. Ther. 28, 101123. https://doi.org/10.1016/j.bjpt.2024.101123 (2024).
Ng, K. S., Lian, J., Huang, F., Yu, Y. & Vardhanabhuti, V. Association between moderate-to-vigorous physical activity and chronic disease risk in adults and elderly: insights from the UK Biobank study. Front. Physiol. 15, 1465168. https://doi.org/10.3389/fphys.2024.1465168 (2024).
Laddu, D., Paluch, A. E. & LaMonte, M. J. The role of the built environment in promoting movement and physical activity across the lifespan: Implications for public health. Prog. Cardiovasc. Dis. 64, 33–40. https://doi.org/10.1016/j.pcad.2020.12.009 (2021).
Ferdinand, A. O., Sen, B., Rahurkar, S., Engler, S. & Menachemi, N. The Relationship Between Built Environments and Physical Activity: A Systematic Review. Am. J. Public Health 102, E7–E13. https://doi.org/10.2105/Ajph.2012.300740 (2012).
Zhang, J., Zheng, Y., Wen, T., Yang, M. & Feng, Q. M. The impact of built environment on physical activity and subjective well-being of urban residents: A study of core cities in the Yangtze River Delta survey. Front. Psychol. 13, 1050486. https://doi.org/10.3389/fpsyg.2022.1050486 (2022).
General Office of the State Council of the People’s Republic of China. National Fitness Plan (2021–2025). Beijing: General Office of the State Council; Aug 3, 2021. Document No. Guo Ban Fa [2021] No. 11. https://www.gov.cn/zhengce/content/2021-08/03/content_5629218.htm
Hua, Y. J. et al. Association between perception of community environment and physical activity in residents in Suzhou. Zhonghua Liu Xing Bing Xue Za Zhi 42, 1969–1975. https://doi.org/10.3760/cma.j.cn112338-20200929-01208 (2021).
Cerin, E., Saelens, B. E., Sallis, J. F. & Frank, L. D. Neighborhood Environment Walkability Scale: validity and development of a short form. Med. Sci. Sports Exerc. 38, 1682–1691. https://doi.org/10.1249/01.mss.0000227639.83607.4d (2006).
Craig, C. L. et al. International physical activity questionnaire: 12-country reliability and validity. Med. Sci. Sports Exerc. 35, 1381–1395. https://doi.org/10.1249/01.MSS.0000078924.61453.FB (2003).
Day, K. Built environmental correlates of physical activity in China: A review. Prev. Med. Rep. 3, 303–316. https://doi.org/10.1016/j.pmedr.2016.03.007 (2016).
Bauman, A. E. et al. Correlates of physical activity: why are some people physically active and others not?. Lancet 380, 258–271. https://doi.org/10.1016/s0140-6736(12)60735-1 (2012).
Sallis, J. F. et al. Physical activity in relation to urban environments in 14 cities worldwide: a cross-sectional study. Lancet 387, 2207–2217. https://doi.org/10.1016/s0140-6736(15)01284-2 (2016).
Wenthe, P. J., Janz, K. F. & Levy, S. M. Gender similarities and differences in factors associated with adolescent moderate-vigorous physical activity. Pediatr. Exerc. Sci. 21, 291–304. https://doi.org/10.1123/pes.21.3.291 (2009).
Brunner, B. C. Personality and motivating factors influencing adult participation in vigorous physical activity. Res. Q 40, 464–469 (1969).
Eriksson, U., Arvidsson, D. & Sundquist, K. Availability of exercise facilities and physical activity in 2,037 adults: cross-sectional results from the Swedish neighborhood and physical activity (SNAP) study. BMC Public Health 12, 607. https://doi.org/10.1186/1471-2458-12-607 (2012).
Lee, S. A. et al. The relationship between sports facility accessibility and physical activity among Korean adults. BMC Public Health 16, 893. https://doi.org/10.1186/s12889-016-3574-z (2016).
Peralta, M. et al. Does the Installation or the Improvement of Existing Outdoor Parks Increase Physical Activity Levels? A Systematic Review. Sports (Basel) https://doi.org/10.3390/sports11110221 (2023).
Zang, P. et al. Differences in the Correlation between the Built Environment and Walking, Moderate, and Vigorous Physical Activity among the Elderly in Low- and High-Income Areas. Int. J. Environ. Res. Public Health https://doi.org/10.3390/ijerph19031894 (2022).
Cerin, E. et al. Objectively-assessed neighbourhood destination accessibility and physical activity in adults from 10 countries: An analysis of moderators and perceptions as mediators. Soc. Sci. Med. 211, 282–293. https://doi.org/10.1016/j.socscimed.2018.06.034 (2018).
Humpel, N., Owen, N. & Leslie, E. Environmental factors associated with adults’ participation in physical activity: a review. Am. J. Prev. Med. 22, 188–199. https://doi.org/10.1016/s0749-3797(01)00426-3 (2002).
Ferrari, G. et al. Perceived Urban Environment Attributes and Device-Measured Physical Activity in Latin America: An 8-Nation Study. Am. J. Prev. Med. 62, 635–645. https://doi.org/10.1016/j.amepre.2021.09.006 (2022).
Brownson, R. C. et al. Promoting physical activity in rural communities: walking trail access, use, and effects. Am. J. Prev. Med. 18, 235–241. https://doi.org/10.1016/s0749-3797(99)00165-8 (2000).
Timperio, A. et al. Features of public open spaces and physical activity among children: findings from the CLAN study. Prev. Med. 47, 514–518. https://doi.org/10.1016/j.ypmed.2008.07.015 (2008).
Oyeyemi, A. L., Adegoke, B. O., Sallis, J. F., Oyeyemi, A. Y. & De Bourdeaudhuij, I. Perceived crime and traffic safety is related to physical activity among adults in Nigeria. BMC Public Health 12, 294. https://doi.org/10.1186/1471-2458-12-294 (2012).
Nigg, C. et al. A systematic review on the associations between the built environment and adult’s physical activity in global tropical and subtropical climate regions. Int. J. Behav. Nutr. Phys. Act 21, 59. https://doi.org/10.1186/s12966-024-01582-x (2024).
Frank, L. D. et al. The development of a walkability index: application to the Neighborhood Quality of Life Study. Br. J. Sports Med. 44, 924–933. https://doi.org/10.1136/bjsm.2009.058701 (2010).
Zhu, W., Chi, A. & Sun, Y. Physical activity among older Chinese adults living in urban and rural areas: A review. J. Sport Health Sci. 5, 281–286. https://doi.org/10.1016/j.jshs.2016.07.004 (2016).
Xie, B., An, Z., Zheng, Y. & Li, Z. Healthy aging with parks: Association between park accessibility and the health status of older adults in urban China. Sustain. Cities Soc. 43, 476–486. https://doi.org/10.1016/j.scs.2018.09.010 (2018).
Bourne, J. E. et al. The impact of e-cycling on travel behaviour: A scoping review. J. Transp. & Health 19, 100910. https://doi.org/10.1016/j.jth.2020.100910 (2020).
Funding
This work was supported by Ministry of Science and Technology of the People’s Republic of China (No. 2022YFC3600204); China Institute of Sport Science (No. Basic-2244); Institute of Health and Sports Science & Medicine, Juntendo University; the Research Encouragement Program of Juntendo University, Faculty of Health and Sports Science; China Scholarship Council (No. 202508050080); and TOBE MAKI Scholarship Foundation (No. 25-C-901).
Author information
Authors and Affiliations
Contributions
XP: Conceptualization, Formal analysis, Methodology, Writing – original draft, Writing – review & editing. XC: Formal analysis, Methodology, Writing – review & editing. DZ: Conceptualization, Formal analysis, Methodology, Writing – review & editing. YW: Conceptualization, Writing – review & editing, Validation. YG: Writing – review & editing, Formal analysis, Software. KS: Methodology, Writing – review & editing, Conceptualization. LJ: Writing – review & editing, Methodology, Visualization. HH: Conceptualization. YZ: Data curation, Funding acquisition, Resources, Writing – review & editing, Project administration.
Corresponding authors
Ethics declarations
Competing interests
The authors declare no competing interests.
Ethics statement
This study was conducted in accordance with the Declaration of Helsinki. All research protocols were approved by the Approval Committee of the Ethical Committee of China Institute of Sport Science (CISS-2019–10-29). All investigators and subjects signed informed consent forms prior to the formal survey. All participants provided explicit informed consent to participate in this study. Clinical trial number: not applicable.
Additional information
Publisher’s note
Springer Nature remains neutral with regard to jurisdictional claims in published maps and institutional affiliations.
Supplementary Information
Rights and permissions
Open Access This article is licensed under a Creative Commons Attribution-NonCommercial-NoDerivatives 4.0 International License, which permits any non-commercial use, sharing, distribution and reproduction in any medium or format, as long as you give appropriate credit to the original author(s) and the source, provide a link to the Creative Commons licence, and indicate if you modified the licensed material. You do not have permission under this licence to share adapted material derived from this article or parts of it. The images or other third party material in this article are included in the article’s Creative Commons licence, unless indicated otherwise in a credit line to the material. If material is not included in the article’s Creative Commons licence and your intended use is not permitted by statutory regulation or exceeds the permitted use, you will need to obtain permission directly from the copyright holder. To view a copy of this licence, visit http://creativecommons.org/licenses/by-nc-nd/4.0/.
About this article

Cite this article
Pan, X., Chen, X., Gao, Y. et al. Nationwide evidence from China on the dose–response between environmental fitness support and physical activity. Sci Rep 15, 40498 (2025). https://doi.org/10.1038/s41598-025-24216-z
Received:
Accepted:
Published:
Version of record:
DOI: https://doi.org/10.1038/s41598-025-24216-z
