
Abstract
Soil erosion is a significant threat to global food production, reducing the productivity of natural ecosystems and agricultural lands. In this study, we examine the loss of crop water productivity in the Halil River agricultural watershed, Iran. Areas within this watershed that are prone to soil erosion were delineated using two machine learning algorithms viz. Support Vector Machines (SVM) and Multivariate Discriminant Analysis (MDA), and 11 geo-environmental factors including elevation, lithology, land use, hydrologic soil group, soil depth, drainage density, soil available water capacity (SAWC), population density, slope (degrees), R factor, and distance to road. Finally, the loss of blue, green, and total crop water productivity of some main cultivated crops (wheat, dates, citrus, and tomatoes) in the study watershed was assessed under pessimistic (20%), optimistic (10%), and normal (15%) scenarios of crop water productivity loss. The results indicate that hydrologic soil group, elevation, and land use are the most important factors for soil erosion susceptibility. In addition, validation results of machine learning algorithms showed that the SVM model (AUC = 94%, TSS = 0.85) outperformed MDA (AUC = 92.3%, TSS = 0.81), and was therefore selected for further analysis. According to the SVM model, 14.3% of the watershed falls within the very high erosion susceptibility class. Agricultural lands are mostly located in areas of moderate to very high erosion risk. Production of wheat, citrus, dates, and tomatoes in moderate, high, and very high areas of erosion susceptibility map are estimated to be 2.4, 5.3, 13.3, and 10.7 million tons, respectively. In the optimistic scenario, total productivity losses per unit of water consumed water by wheat, dates, citrus, and tomatoes are 0.22, 1.24, 2.15, and 2.35 kg m−3. and total economic loss will be 14,371, 93,675, 83,247 and 51,893(×104) US$. In the more realistic scenario, these losses are, respectively, 0.32, 1.86, 3.23, and 3.53 kg per unit of consumed water and the economic loss are 21,557, 140,517, 124,872 and 77,841(×104) US$. The total productivity losses per unit of water consumed in the pessimistic scenario are, respectively, 0.43, 2.47, 4.30, and 4.70 kg m−3 and total economic loss are 28,743, 187,353, 166,494 and 103,782 (×104) US$. The results underscore the urgent need for site-specific erosion mitigation strategies to safeguard agricultural productivity and water efficiency.
Introduction
The total human population is predicted to reach 9 billion by about 2050, which are raising concerns about future food security1. The UN Food and Agriculture Organization (FAO) estimates that there will be a 44% growth in demand for all cereal crops from 2005 to 2007 to 20502. Food security thus will be one of the most pressing problems faced by humanity over the next several decades and is of particular concern in arid and semi-arid countries, which are at risk from climate change3. Increasing water productivity in countries with limited water supplies is a key priority for governments aiming to boost crop production to satisfy future food requirments4. In this context, soil provides a wide range of ecosystem services that are critically important in meeting basic human food needs5. However, globally soils are subject to unprecedented degradation and erosion6,7,8. In particular, soil erosion is reducing our collective ability to increase food production to the level required to feed 9 billion people by mid-century. FAO has identified soil erosion as one of the top ten risks to food security9.
Soil erosion has additional adverse on-site and off-site consequences, including river siltation, flooding, soil nutrient loss, water pollution, and reduced agricultural productivity5. To control these problems, erosion-prone areas and the factors responsible for soil erosion must be identified, and agricultural systems in erosion-prone areas must be sustainably managed.
Iran ranks highest among Asian countries suffering from soil erosion, with approximately 94% of its agricultural land experiencing soil degradation10. Insufficient rainfall, low soil organic matter, and overall poor soil quality compound the challenge of maintaining much less increasing agricultural production. Soil erosion not only decreases food production, but also exacerbates desertification and poverty in rural areas of Iran10.
In recent years, a variety of equations and methods have been developed to identify and manage erosion-susceptible agricultural areas. Notable examples include the Universal Soil Loss Equation (USLE)11, Revised Universal Soil Loss Equation (RUSLE)12, Water Erosion Prediction Project Model (WEPP)13. Recently, machine learning (ML) algorithms have been used to address the multivariate and complex nature of soil erosion14,15,16,17 and improve the accuracy of soil erosion maps18. In addition, models such as weights of evidence19, the generalized linear model9, and artificial neural network (ANN)20,21, have been successfully applied in soil erosion research. For example, in a study, analytical neural network and geographically weighted regression were used to extract areas vulnerable to soil erosion and identify the most suitable model for soil erosion susceptibility in subtropical environment20. In other study, Multi-layer perception approach (MLPC) and its ensembles (MLPC-Bagging, gully erosion8. Recently, researchers have combined empirical models with ML algorithms to identify soil erosion hotspots and their causes. For example, in a study, RUSLE was integrated with generalized linear model (GLM), classification tree analysis (CTA), artificial neural network (ANN) and random forest (RF) to improve the identification of regions with soil erosion in the Talar watershed, Iran9. Despite these advances, few studies have linked erosion susceptibility mapping to quantitative assessments of agronomic performance.
In general terms, soil erosion is evaluated by measuring losses of soil material due to water, wind, and human modification of the land surface. These losses are can be readily observed and measured. In contrast, intrinsic impacts on chemical properties, soil nutrient content, and biological activity are typically difficult to identify and measure, even though they are equally or even more important for soil productivity and ecosystem function than soil loss itself. All forms of soil degradation markedly affect water availability in both rainfed and irrigated agricultural systems by altering runoff and soil water retention, and by impeding plant’ access to soil water22. Crop water productivity (CWP) is an appropriate concept for studying and discussing the impact of soil erosion on irrigated and rainfed crops. It is the ratio of crop yield to the amount of water consumed in the production process. However, there have been numerous studies that have investigated CWP7,23,24, little work has been done in Iran and world on the impact of soil erosion on crops and food security based on CWP concept.
To be actionable for food security and water management, erosion assessments should not only identify hotspots but also quantify how erosion alters crop yields and water productivity under different scenarios. We have identified soil erosion-prone areas in the Halil River watershed, Iran, where is critical to the economy of the area. It is an important agricultural area, especially for wheat cultivation. The objectives of our study are threefold: (1) to produce an accurate soil erosion susceptibility map of the watershed using machine learning algorithms; (2) to select the most important factors affecting soil erosion in the watershed; and (3) to calculate losses of crop water productivity under three different scenarios of erosion based on the CWP concept.
Study area
The Halil River watershed (9204 km2) is located in Kerman Province in southeast Iran. It extends from 28°05´N to 29°15´N and 56°55´E to 58°15´E (Fig. 1) and gradually rises in elevation from 498 m to 3868 m asl (above sea level) from south to north. The watershed serves as a tributary to the Jazmourian wetland, which provides surface water that is essential for local agriculture.
The climate in the region is arid to semi-arid25. Average annual precipitation ranges from 155 mm to to 4254 mm, and mean annual temperature ranges of 16.7 to 25.8 ◦C.
The Halil River watershed is home to about 390,000 persons distributed across 24 local communities26. The population depends heavily on agriculture, with the watershed playing a crucial role in crop production in Iran. Additionally, the study area supports a diverse variety of vegetation types, including irrigated orchards, annually irrigated crops, and natural vegetation. The irrigation of crops such as wheat, barley, corn, watermelon, cucumber, potato, onion, and tomato represents the most water-demanding form of land use. Orchards are primarily composed of citrus trees, while the natural vegetation, which covers a significant portion of the study area, is mainly used for livestock grazing27.

Location of the study area in Kerman Province, Iran (The data used to create this figure were derived from Iran National Cartographic Center (https://ncc.gov.ir), and the figure was created using ArcGIS software (version 10.8, https://www.esri.com).
Methods
This study consists of three main steps: (1) assessment of the soil erosion using EPM model in the study area. (2) Data preparation and spatial modeling. (3) Assessment of crop water productivity. The respective flowchart is presented in Fig. 2.
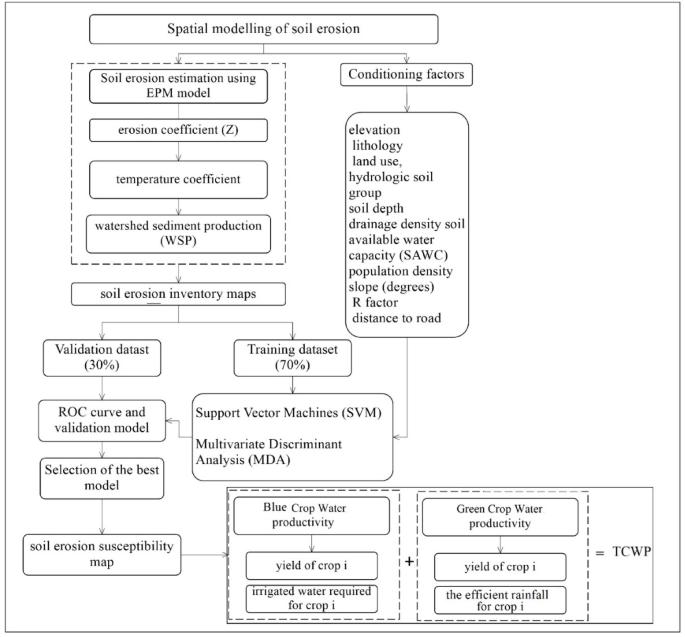
Flowchart of the current study.
Soil erosion Estimation
The erosion potential method (EPM) was firstly introduced by Gavrilović28.This model can be used to estimate the severity of erosion and to prepare soil erosion inventory map in watersheds29.
The EPM model was selected primarily due to its lower sensitivity to topographic parameters30. Unlike RUSLE, which explicitly incorporates a slope-length (LS) factor to account for erosion dynamics, the EPM model does not rely on this component. While the LS factor makes RUSLE effective in areas with relatively gentle terrain, it also introduces bias when applied to steep slopes, where erosion tends to be overestimated8. Given the presence of steep terrain within the study area, the reduced topographic sensitivity of the EPM model makes it more suitable and reliable for accurate erosion assessment.
The soil, surface geology, land use, topographic features and climatic factors (including mean annual rainfall, and mean annual temperature) are main variables which can be applied in EPM model31,32,33.Although the method can provide average annual soil erosion rates, it is not suitable for assessing erosion on a specific event basis34.The method estimates the coefficient of erosion intensity (Z) in a watershed using the following Eq. 235:
where Y is the coefficient of soil erodibility, X is land use coefficient, ψ is the coefficient of the type of erosion processes, and I is the average watershed slope gradient. According to Gavrilovic28, Y, X, and ψ can be estimated using descriptive and numerical data. The required data are summarized in Table 1, based on Dragičević et al36. and Baharvand and Pardhan29.
The erosion potential method estimates average annual gross soil erosion (Wsp) (m3/km−2.yr−1) using Eq. (2)36,37:
where H is mean annual amount of precipitation (mm/year), π is equal to 3.14, Z is the coefficient of erosion intensity calculated from Eq. (1), A is the area of the study, and T is a temperature coefficient quantified from the mean annual temperature (t) according to Eq. (3):
Figure 3 shows the EPM parameters including erosion coefficient (ψ), land use coefficient (X), soil erodibility coefficient (Y), erosion coefficient (Z), temperature coefficient and mean annual rainfall (H). All variables were adjusted to a consistent spatial resolution of 30 m.
The value of Wsp provides an estimate of the total amount of soil eroded in a watershed due to several erosion processes (e.g., rill, sheet, gully erosion) and smaller soil slumps32.
Where, P is circumference of the watershed, L is watershed length (Km), D is height difference in the watershed area (Km). After calculation of Ru value, the special sediment rate is estimated by equations Eqs. 5, 6 and 7:
Where Gsp is special sediment rate, Ru is sedimentation coefficient, GS is total sediment rate (m3/yr), F is total watershed area (km2)28.
To assess the performance of the EPM model, the average estimated sediment was compared with the average observed sediment at the Kahnak –e Sheibani station at the basin outlet.
After preparing soil erosion map, the EPM map was categorized by erosion rates and areas > 16 ton/ha/year were considered as regions with severe erosion9. These regions were extracted, and 300 points were chosen to be as occurrence points of soil erosion for the ML models. To build our ML model, 70% of the total dataset was used for calibration and training, while the remaining 30% were used for model validation38,39. The average soil erosion rate in Iran is 15–20 tons ha−1year−1. This is 3 to 4 times higher than the global average due to climatic, topographic, and anthropogenic conditions40,41.
Dataset Preparation for Spatial soil erosion modeling
Meteorological and topographical factors, as well as vegetation and soil characteristics influence soil erosion. Eleven geo-environmental factors including elevation, lithology, land use, hydrologic soil group, soil depth, drainage density, soil available water capacity (SAWC), population density, slope, rainfall erosivity (R factor), and distance to road were used in this study to categorize and map soil erosion. These factors were chosen based on previous studies9,35,42,43, data availability, and the authors’ experience44.
Elevation (Fig. 4a) was derived from the DEM and categorized in ArcGIS 10.8. Lithology (Fig. 4b; Table 2) was considered by digitizing geological maps at 1:50,000 scale.
Land use significantly impacts soil erosion. Conversion of natural landscapes to agriculture or urban areas often leads to increased erosion due to factors like deforestation, soil disturbance, and reduced vegetation cover45,46.
A land-use map of the Halil River watershed was created (Fig. 4c) from a Landsat 8/Operational Land Imager (OLI) image using a supervised classification algorithm in the ENVI 5.3.
Seven land-use types were identified: bare land, cultivated crops, open water, orchards, pasture, rock, and urban. Slopes, ranging from 0 to 72o (Fig. 4d) were derived from a digital elevation model (DEM) of the watershed (Fig. 4a). Drainage density map was obtained from rivers map of the study area (Fig. 4e) using line density command in ArcGIS 10.8. Areas near drainage divides are at high risk of erosion42,47,48. Areas near roads are typically susceptible to soil erosion49,50, thus a distance-to-road layer (Fig. 4f) was extracted from a 1: 25,000-scale topographic map in ArcGIS 10.8 using the Euclidean distance method. Population density (Fig. 4g) was derived from population statistics provided by Iran Statistical Center Organization26. R factor is rainfall erosivity in revised universal soil loss equation (RUSLE) and is a significant aspect in soil erosion modeling51,52. It was computed from rainfall data obtained from seven meteorological stations using Renard and Freimund’s12 method and then interpolated using the Inverse Distance Weighted (IDW) method in ArcGIS (Fig. 4h). Soil properties, including soil depth (Fig. 4i), soil available water capacity (SAWC) (Fig. 4j) and soil hydrological group (Fig. 4k) were obtained from 79 soil samples extracted in a field. Table 3 show the variable types and scale of all mentioned data used for the study. Finally, all variables were adjusted to a consistent spatial resolution of 30 m.


Estimates of the EPM parameters in the study watershed, including (a) erosion coefficient (ψ), (b) land use coefficient (X), (c) soil erodibility coefficient (Y), (d) erosion coefficient (Z), (e) temperature coefficient and (f) mean annual rainfall (H) (The data used including ψ, X and Y were obtained from Iran National Cartographic Center (https://ncc.gov.ir), T and H were obtained from Iran Water Resources Management (WRM) company (https://data.wrm.ir), and the figures were generated using ArcGIS software (version 10.8, https://www.esri.com).


Conditioning factors for soil erosion susceptibility analysis: (a) elevation (b) lithology (c) land use (d) slope (e) drainage density (f) distance to road (g) population density (h) R factor, (i) soil depth, (j) SAWC and (k) hydrologic soil group (The data used to create the figures (a), (b), (c), (d), (e) and (f) were obtained from Iran National Cartographic Center (https://ncc.gov.ir), the data for the figure (g) were obtained from Statistical Centre of Iran (https://amar.org.ir), the data for the figure (h) were obtained from Iran Water Resources Management (WRM) company (https://data.wrm.ir), the data for figures (i), (j) and (k) were obtained from field study, finally the figures were generated using ArcGIS software (version 10.8, https://www.esri.com).
Multi-collinearity analysis
Multi-collinearity analysis consistently provides accurate insights for assessing the linear relationships among various geo-environmental factors within a machine learning model. This statistical technique identifies pairs of variables that exhibit a high correlation in multiple regression analyses44. Therefore, examining multi-collinearity is crucial for enhancing model performance by eliminating highly correlated factors and reducing bias. Researchers worldwide have applied multi-collinearity analysis across diverse fields, including landslide53, gully erosion44, flood studies54. Multi-collinearity can be evaluated using the variance inflation factor (VIF) and tolerance (TOL) metrics. Typically, a TOL value below 0.10 or 0.20, coupled with a VIF value exceeding 5 or 10, indicates significant multi-collinearity among the variables55.
Application of machine learning models
Support vector machines (SVM)
This method is a favored supervised machine-learning algorithm for addressing regression and classification problems56. It is designed for binary classification models54 and relies on the theory of statistical learning57 and the concept of structural risk minimization. It can be applied simultaneously for both regression and classification tasks. The algorithm was executed using R software version 3.5.3 along with the species distribution modeling (SDM) package58. Figure 5 shows the process flowchart of SVM.

The process flowchart of SVM.
Multivariate discriminant analysis (MDA)
Multiple Discriminant Analysis (MDA) is a statistical method that predicts an independent variable using a set of dependent variables. It combines performance features found in more complex neural network models59. MDA generates an equation derived from a linear combination of independent variables25. Discriminant coefficients, representing the weight of each independent variable, are adjusted based on the interrelationships among all variables:
where di is the discriminant score, Xi is the discriminant variable, and Wij is the discriminant coefficient. The algorithm was executed using R software version 3.5.3 along with the species distribution modeling (SDM) package58. Figure 6. shows the process flowchart of MDA.

The process flowchart of MDA.
Evaluation of accuracy
To assess the performance of the ML models, we used precision, the popular recall (sensitivity), AUC, TSS, F_Score, Overall Accuracy metrics that are calculated using the following Eq. (7) to (12):
where “TP is true positive, FN is false negative, FP is false positive, sensitivity (true positive rate) is the portion of the positive samples that are properly classified, and 1-specificity (false positive rate) is the portion of the positive samples that are incorrectly classified”17.
Recall (sensitivity) represents the proportion of all relevant instances that are correctly identified. Thus, both precision and recall are metrics that evaluate relevance60.
The True Skill Statistic (TSS), was firstly proposed by Allouche et al.35 is another metric used to evaluate classification accuracy. TSS statistics are based on the ratio of true prediction which includes both true positives and true negatives61, with values changing from − 1 to + 1. A value of + 1 is indicative of high classification efficiency, whereas anything lower than 0 is worse than random62.
The receiver operating characteristic (ROC) curve has proven to be useful for evaluating the accuracy of hazard susceptibility maps created using machine learning algorithms63,64. In this study we assessed the ability of the applied models to accurately map soil erosion using the area under the ROC curve (AUC). In general, AUC values range from 0.5 to 1.0, with a lower value indicating lesser accuracy and higher values signifying stronger models.
Accuracy can be misleading when dealing with imbalanced datasets. For instance, if a dataset contains 95 positive and 5 negative cases, predicting all cases as negative would still result in a 0.95 accuracy score41. In contrast, the F1-score, which is the harmonic mean of precision and recall, tends to approximate their average when the two values are similar and generally represents their harmonic mean65. Overall accuracy (OA) reflects the likelihood that a test correctly classifies an individual and is calculated as the weighted average of sensitivity and specificity66.
Crop water productivity (CWP)
The impact of soil erosion on agricultural productivity was assessed by extracting agriculture areas from land-use maps and analyzing agricultural statistics. Assessing agricultural damage caused by soil erosion required consideration of scenarios of CWP losses for different cultivated crops grown in areas of different erosion vulnerability.
Based on Iran’s annual agricultural organization report2, the main agricultural crops in the Halil River watershed are wheat, dates, citrus, and tomatoes. These crops cover total areas of, respectively, 21.6%, 19.5%, 18.7%, and 10.5% of agricultural and orchard lands in the watershed.
CWP is expressed as the amount of crop produced per unit of water22. There are two categories of CWP: blue water drawn from surface or groundwater sources, and green water derived from rainwater61,67. Blue crop water productivity was computed using Eq. 13:
where BCWP is blue crop water productivity, Yi is the yield of crop i, and IWRi is irrigated water required for crop i.
Green crop water productivity was calculated using Eq. (14):
where GCWP is green crop water productivity, Yi is the yield of crop i, and Pei is the efficient rainfall for crop i.
Finally, total crop water productivity (TCWP) was determined using GCWP and BCWP.
In this study, a scenario-based approach has been used to calculate the impacts of soil erosion on CWP. Specifically, we chose three scenarios (optimistic, normal, and pessimistic), in which 10%, 15%, and 20% of CWP were lost due to soil erosion.
Also, economic loss of the main crops production under three scenarios (optimistic, normal, and pessimistic) were estimated. So that, it firstly assumed that 10%, 15%, and 20% of crop production were lost due to soil erosion. Then price of each crop multiplied by its production (tons) and finally, it is compared to initial price.
Code availability
No custom code was generated for this study. All analyses were conducted using the publicly available ‘sdm’ R package developed by Naimi & Araujo58. The package can be accessed and downloaded from the Comprehensive R Archive Network (CRAN) at [DOI: https://doi.org/10.1111/ecog.01881].
Results
Soil erosion estimation of the EPM
Estimates of erosion parameters and coefficients for the Halil River watershed, including.
erosion coefficient of watershed (ψ), land use coefficient (X), the coefficient of soil erodibility (Y), the coefficient of erosion intensity (Z), temperature coefficient (T), mean annual rainfall (H) are summarized in Fig. 3. The average annual gross soil erosion (W) has been shown in Fig. 7. The soil erosion map was prepared with resolution 30 m.
Soil erosion ranges from 0.03 to 27.7 ton ha−1year−1 and the highest values were distributed in the southern and central parts of the watershed. In addition, the lowest values of the erosion were observed in the northern and eastern of the watershed. For further analysis, erosion-prone locations with the values more than 16 ton ha−1 year−1 were extracted as severe erosion locations9 for model training.
The average soil erosion rate in the study area was estimated at 7.1 t ha−1 y−1 using EPM and the estimated sediment was 2.8 t ha−1 y−1 that the Ru was 0.4. The average observed sediment at the Kahnak –e Sheibani station at the basin outlet was 3.4 t ha−1 y−1. In other words, the observed sediment content was about 21.4% higher than the estimated sediment. Therefore, there was no significant difference between observed and estimated sediment and the EPM model had good performance.

The average annual gross soil erosion obtained from EPM.
Multi-collinearity test
Multicollinearity, a major concern in classification and regression analysis, refers to the situation where multiple independent variables within a model are correlated with each other. In the present study, we utilized tolerance (TOL) criteria and the variance inflation factor (VIF) to evaluate collinearity among the conditioning variables. TOL values below 0.1 and VIF values exceeding 10 suggest the presence of multi-collinearity among predictor variables55. Table 4 displays the VIF and TOL values for soil erosion predictors in this study, indicates that there is no multicollinearity present among the predictor variables.
The most important conditioning factors
We conducted a jack-knife test to evaluate the relative importance of each variable included in our soil erosion hazard mapping68. Sensitivity analysis examines how variations in input parameters affect a model’s output, thereby identifying which inputs the model is most responsive to69. This sensitivity analysis method entails running the model with all explanatory factors except one, then repeating the process by eliminating each factor individually. The outcomes of the jack-knife test for the variables examined in this study are illustrated in Fig. 8. Each horizontal red bar in the figure represents the model’s accuracy, measured by AUC, derived from eliminating the corresponding variable showed on the left side of the graph. HSG, elevation, land use, and soil depth proved to be the most important soil erosion factors in this study (Fig. 8). In contrast, R, soil available water content (SAWC), distance to road, and population density had the lowest impact on erosion.

The relative importance of explanatory variables using the Jackknife test.
Soil erosion susceptibility models
We used the natural break method in ArcMap to analyze and map the susceptibility of soil erosion in the Halil River watershed derived from the predictions of the machine learning models. The percentage of the area of the watershed occupied by each of the five classes ranging from very low to very high was computed for the predictions made by each of the two machine learning models (Fig. 9). The soil erosion maps obtained by SVM and MDA were prepared with resolution 30 m. The findings show some differences in the spatial distribution of the classes generated by each model, although the highest potential for soil erosion clearly is in the southern and central parts of the watershed, which are agricultural lands, in some places located at this part of the study area, low susceptible areas exist.
The SVM model predicts that the total area of low, moderate, and high soil erosion susceptibility classes is 14.1% of the area of the watershed (Table 5). The largest area (71.5%) of the watershed (6583.2 km2) is within the very low soil erosion susceptibility class. The very high erosion class, however, covers 14.2% of the watershed. In MDA, the total area of low, moderate, and high soil erosion susceptibility classes is 21.21% of the area of the watershed. The largest area (61.5%) of the watershed (5662.2 km2) is within the very low soil erosion susceptibility class. The importance of this area for agriculture highlights the need to prioritize it for management measures to mitigate the erosion risk.

Soil water erosion risk map for MDA and SVM models using ArcGIS software (version 10.8, https://www.esri.com).
Similarly, the soil erosion susceptibility map derived using the MDA model shows that the largest percentage of the watershed (61.6%) is located in the very low soil erosion susceptibility. However, 17.2% of the watershed is within the very high erosion class.
Model validation and accuracy
The accuracy of the SVM and MDA models was assessed using the ROC curve, precision, the popular recall (sensitivity), TSS, F_Score, Overall Accuracy metrics. The results show that the SVM model (AUC = 94%, TSS = 0.85, Recall = 0.93, Precision = 0.91, F_score = 0.87, Accuracy = 0.90) performs a little better than the MDA model (AUC = 92.3%, TSS = 0.81 Recall = 0.88, Precision = 0.89, F_score = 0.84, Accuracy = 0.87) model (Fig. 10; Table 6). We thus selected the map created by SVM for subsequent calculations and analysis presented in the next section.

Performance evaluation of the MDA and SVM models by ROC and AUC curves.
Soil erosion and crop water productivity (CWP) impacts
Areas and yields of the main crops produced in the Halil River watershed were determined to calculate potential losses of CWP due to soil erosion. Based on the land-use map, about 73,780 ha of the watershed is used for agriculture, including orchards. Further, more of the total area of the agriculture and orchard lands lie within the moderate to very high soil erosion susceptibility classes.
We considered average provincial yields for this study because watershed-based data on yield were not available for the Halil River watershed. The average yield of wheat (1.71 ton ha−1 year−1), dates (5.25 ton ha−1year−1), citrus (13.5 ton ha−1year−1), and tomatoes (19.34 ton ha−1year−1) thus apply to Kerman Province. Assuming that erosion-prone areas of agricultural land lose 20% of the CWP in cultivating the main crops (pessimistic scenario; Table 7), the potential losses of total CWP (TCWP) of wheat, dates, citrus, and tomatoes would be 0.43, 2.47, 4.30, and 4.70 kg m−3, respectively. The potential green CWP is higher than the blue CWP for all cultivated crops.
In the case of the realistic scenario, 0.32, 1.86, 3.23. 3.53 kg m−3 of the TCWP for, respectively, wheat, dates, citrus, and tomatoes would be reduced under the influence of soil erosion. Corresponding values for the optimistic scenario are 0.22, 1.24, 2.15, and 2.35 kg m−3 of TCWP. In this scenario, green CWP is higher than blue CWP as well. Also, economic loss (×104US$) of the main crops production under different scenarios have been shown in Table 8. The average production of wheat, dates, citrus, and tomatoes in the watershed were 119762.5, 183677.6, 462484.3 and 402,278 tons, respectively. In the case of the realistic scenario, 21,557, 140,517, 124,872 and 77,841(×104) US$ for, respectively, wheat, dates, citrus, and tomatoes would be lost under the influence of soil erosion. Economic loss of wheat, dates, citrus, and tomatoes production would be 28,743, 187,353, 166,494 and 103,782 (×104) US$, respectively, under pessimistic scenario. Corresponding values for the optimistic scenario are 14,371, 93,675, 83,247 and 51,893(×104) US$.
Discussion
According to the results, there was no significant difference between observed and estimated sediment and the EPM model had good performance. The Erosion Potential Method (EPM) model could be applied for different slopes56. In some researches with arid and semi-arid climate9,51, especially in Iran, in conditions of similar to the study area, despite of the steep slopes, RUSLE has been applied which has high topographic sensitivity and has been developed for low slopes52. For example, in a similar region in Iran, the RUSLE and machine learning models were integrated in Talar Watershed9. This is the advantage of this study and the weakness of mentioned studies.
Evaluating the relative importance of explanatory factors showed that HSG, elevation, land use, and soil depth proved to be the most important soil erosion factors in this study. In contrast, R, soil available water content (SAWC), distance to road, and population density had the lowest impact on erosion. The high importance of HSG aligns with the findings of Faouzi et al.70, but is counter to the results of Khosravi et al.18 who found HSG to be least important of the factors used in their soil erosion study.
We divided HSG values into four categories based on its potential for runoff. Category “A” represents sites with high permeability and low runoff. In contrast, category “D” includes sites with low permeability and high rates of runoff and erosion70. In this study, areas categorized as the Category “C” were found to be particularly susceptible to soil erosion.
Elevation is the second most effective factor for soil erosion susceptibility, which is in compatible with findings of Mosavi et al.48, Band et al71. and Roy et al72.. Despite the common assumption51 and finding of other research9,14 that areas at higher elevations are more prone to erosion than low elevation sites due to their higher rainfall, steeper slopes, and thinner soils, a different trend is evident in our study area: higher elevation areas experience less soil erosion than lower elevations ones because of the high density of agricultural lands at low elevations.
Land use is a momentous anthropogenic effect on soil loss in our study area. The development of agricultural areas and unsustainable agricultural practices have increased soil loss, consistent with the results of Barakat et al.15, Band et al. 14and Arabameri et al73.. Agricultural tillage enhances soil infiltration but also contributes to significant soil losses. The use of machinery and regular plowing changes the physical properties of the soil, impacting surface runoff and increasing erosion. These processes are a topic of discussion by Silva et al.74. In addition, the significance and underlying factors of soil erosion vary greatly between cases, as each unique situation involves distinct types of land use and land cover. Consequently, it is crucial for planners and managers to understand the capacity and potential of various land uses to effectively prevent or mitigate soil erosion. The R factor was the least important of the variables used in this study. The northern part of the watershed lies at higher elevations and receive more rainfall than other areas, thus one might expect higher rates of erosion there. However, the southern and central plains experience far more soil erosion than the northern region. These areas, unlike those in the north, are dominantly agricultural lands, in any case, the differences in precipitation between the central and northern parts of the watershed are not great.
The results of accuracy assessment of ML models showed that the SVM model performs a little better than the MDA model. This result is in agreement with results of several other recent studies53,75,76. We thus selected the map created by SVM for subsequent calculations and analysis presented in the next section. In previous researches of natural hazard modeling such as avalanches and rockfalls77, piping erosion59, flood78, groundwater potential mapping79 and landslide66 also have been determined that the SVM model had a good performance. The regions with high erosion risk were identified.
Finally, the loss of blue, green, and total crop water productivity of some main cultivated crops (wheat, dates, citrus, and tomatoes) in the study watershed was assessed under pessimistic (20%), optimistic (10%), and normal (15%) scenarios of crop water productivity loss. According to results, agricultural lands are mostly located in areas of moderate to very high erosion risk. The economic losses associated with CWP decline are particularly alarming. Under the realistic scenario, the estimated total loss reached over $364,787 (×10⁴) US$, with wheat, dates, citrus, and tomatoes showing the highest vulnerability. Such losses directly threaten rural livelihoods and national food security, especially given the reliance of Iran’s economy on agricultural products in arid and semi-arid regions. These findings strongly suggest that soil conservation measures must be integrated into agricultural and water management policies. Strategies such as conservation tillage, mulching, cover crops, and terracing can help reduce erosion while simultaneously enhancing soil moisture retention and water productivity. In addition to the economic implications, the decline in CWP itself represents a critical loss in resource efficiency. Such reductions mean that for every cubic meter of water consumed, substantially less food is produced, which in arid and semi-arid regions like Iran translates into severe water wastage. This issue is particularly important because water availability, rather than land, is the limiting factor for agricultural expansion in these regions. The differences observed across the three scenarios also demonstrate the sensitivity of CWP to soil erosion: even a 10% reduction in productivity results in substantially less crop production per unit of water consumed.
This study provides a novel framework for evaluating the consequences of soil erosion in terms of both natural resource degradation and agricultural water efficiency. Future research should combine erosion modeling with crop growth and hydrological simulations to capture the feedbacks between soil, water, and crops under changing climate conditions. Policymakers should use these insights to design site-specific erosion control measures and promote sustainable land management practices to safeguard food production and water security in vulnerable regions like the Halil River watershed.
Conclusion
This study investigates crop water productivity (CWP) losses of some major crops in the Halil River watershed, Iran, under three soil erosion scenarios. Two machine learning algorithms (SVM and MDA) and 11 conditioning factors (elevation, lithology, land use, hydrologic soil group, soil depth, drainage density, SAWC, population density, slope, R factor, and distance to road) were used to spatial model soil erosion susceptibility. Of these factors, hydrologic soil group (HSG), elevation, and land use had the greatest impact on soil erosion susceptibility. The accuracy of the soil erosion susceptibility maps created by the two machine learning models was validated using ROC and showed that the SVM algorithm is more accurate. Comparison of soil erosion susceptibility and land-use maps showed that all agricultural areas are located in erosion-susceptible zones. The total CWP losses of the main cultivated crops (wheat, dates, citrus, and tomatoes) were estimated to be 0.22, 1.24, 2.15, and 2.35 kg m−3 in an optimistic scenario, respectively. For a more realistic scenario, the CWP values of these crops are 0.32, 1.86, 3.23, and 3.53 kg m−3, respectively. In a pessimistic scenario, the corresponding values are 0.43, 2.47, 4.30, and 4.70 kg m−3. Our study clearly shows that soil erosion leads to substantial CWP losses in the Halil River watershed, calling attention to the need to implement rehabilitation and conservation measures in drought-prone agricultural areas of Iran.
Taking into account the satisfactory performance of the SVM model in our study, we suggest applying this methodology to other regions with varying characteristics. This broader application would help validate the model’s generalizability and effectiveness across diverse contexts.
In addition, this research contributes a novel integration of machine learning, erosion modeling, and water productivity assessment, offering a replicable approach for analyzing erosion-induced agricultural losses. It addresses global concerns related to land degradation, food security, and sustainable water use, key challenges underlined by international frameworks such as the UN Sustainable Development Goals (SDGs 2, 6, 13, and 15). Given the growing pressures of climate change and population growth, the methodology and insights from this work can inform regional planning and global strategies aimed at protecting agricultural productivity in erosion-prone and water-scarce environments worldwide. The model’s scalability also enables its application in other vulnerable regions, contributing to a broader scientific understanding of erosion–agriculture dynamics in a changing world.
This study, while offering valuable insights into the effects of soil erosion on crop water productivity (CWP) in the Halil River watershed, is subject to some limitations.
One of the primary limitations of this study, which is common in other spatial modeling research, is the use of input variables collected at varying scales worldwide. Although all input data were resampled to a uniform spatial resolution of 30 m, the original data collection and sampling were conducted at different scales. This remains an unavoidable constraint for now.
Also, the analysis relied on statistical reports due to the lack of access to high-resolution data on crop yields. This reliance may introduce uncertainties in the calculated CWP values. In addition, the absence of spatially explicit data on the location of individual crop fields limits the ability to analyze the spatial variation of CWP across the watershed. Looking ahead, there is considerable potential for advancing this research through more comprehensive and integrated approaches. Future studies would benefit from dynamic modeling frameworks that incorporate multi-year datasets and climate change projections to assess how temporal variations in weather patterns may influence erosion severity and water productivity. Integrating crop simulation models with hydrological models could offer a more detailed understanding of the interactions between soil, water, and crop growth under different management and erosion conditions. Ground-based measurements of soil loss, crop yield, and irrigation practices will be essential for validating model assumptions and improving reliability. Also, it is also suggested that future studies in other areas employ deep learning models and compare their performance with that of basic machine learning models.
Data availability
The data that support the findings of this study are available on request from the corresponding author.
References
Cordeiro, M. R. C. et al. Assessing feed security for beef production within livestock-intensive regions. Agric. Syst. 196, 103348. https://doi.org/10.1016/j.agsy.2021.103348 (2022).
Fischer, R. A., Byerlee, D. & Edmeades, G. Crop Yields and Global Food Security Canberra, ACT, 8–11 (ACIAR, 2014).
Misra, A. K. Climate change and challenges of water and food security. Intern. J. Sustain. Built Environ. 3 (1), 153–165. https://doi.org/10.1016/j.ijsbe.2014.04.006 (2014).
Letseku, V. & Grové, B. Crop water productivity, applied water productivity and economic decision making. Water 14 (10), 1598. https://doi.org/10.3390/w14101598 (2022).
Mirchooli, F., Dabiri, Z., Strobl, J., Darvishan, A. K. & Sadeghi, S. H. Spatial and Temporal dynamics of rangeland ecosystem services across the Shazand Watershed, Iran. Rangel. Ecol. Manage. 90, 45–55. https://doi.org/10.1016/j.rama.2023.05.005 (2023).
Kopittke, P. M. et al. Soil and the intensification of agriculture for global food security. Environ. Int. 132, 105078. https://doi.org/10.1016/j.envint.2019.105078 (2019).
Mohammed, S. et al. Performance evaluation of machine learning algorithms to assess soil erosion in mediterranean farmland: A case-study in Syria. Land. Degrad. Degrad. Dev. 34 (10), 2896–2911. https://doi.org/10.1002/ldr.4655 (2023).
Roy, P. et al. Development of different machine learning ensemble classifier for gully erosion susceptibility in Gandheswari watershed of West Bengal, India. Machine learning for intelligent decision science, 1–26. (2020). https://doi.org/10.1007/978-981-15-3689-2_1
Avand, M., Mohammadi, M., Mirchooli, F., Kavian, A. & Tiefenbacher, J. P. A new approach for smart soil erosion modeling: integration of empirical and machine-learning models. Environ. Environ. Model. ing. Assess. 28 (1), 145–160. https://doi.org/10.21203/rs.3.rs-809330/v1 (2023).
Savari, M., Yazdanpanah, M. & Rouzaneh, D. Factors affecting the implementation of soil conservation practices among Iranian farmers. Scientific Reports, 12(1), 8396. (2022). https://doi.org/10.1038/s41598-022-12541-6 (2022).
Wischmeier, W. H. & Smith, D. D. Predicting Rainfall Erosion Losses: a Guide To Conservation Planning (No. 537) (Department of Agriculture, Science and Education Administration, 1978).
Renard, Freimund, J. R. & K. G., & Using monthly precipitation data to estimate the R-factor in the revised USLE. J. Hydrol. 157 (1–4), 287–306. https://doi.org/10.1016/0022-1694(94)90110-4 (1994).
Nearing, M. A. & Nicks, A. D. Evaluation of the water erosion prediction project (WEPP) model for hillslopes. In Modelling Soil Erosion by Water 43–53 (Springer, 1998). https://doi.org/10.1007/978-3-642-58913-3_5.
Bag, R., Mondal, I., Dehbozorgi, M., Bank, S. P., Das, D. N., Bandyopadhyay, J.,… Nguyen, X. C. Modelling and mapping of soil erosion susceptibility using machine learning in a tropical hot sub-humid environment. Journal ofJ. Cleaner Production,364, 132428. https://doi.org/10.1016/j.jclepro.2022.132428 (2022).
Barakat, A., Rafai, M., Mosaid, H., Islam, M. S. & Saeed, S. Mapping of water-induced soil erosion using machine learning models: A case study of Oum Er Rbia basin (Morocco). Earth Syst. Environ. 7 (1), 151–170. https://doi.org/10.1007/s41748-022-00317-x (2023).
Chakrabortty, R., Pal, S. C., Arabameri, A., Ngo, P. T. T., Chowdhuri, I., Roy, P.,… Das, B. Water-induced erosion potentiality and vulnerability assessment in Kangsabati river basin, eastern India. Environment, Development and Sustainability, 24(3), 3518–3557.https://doi.org/10.1007/s10668-021-01576-w (2022).
Lei, X., Chen, W., Avand, M., Janizadeh, S., Kariminejad, N., Shahabi, H., … Mosavi,A. GIS-based machine learning algorithms for gully erosion susceptibility mapping in a semi-arid region of Iran. Remote Senssing, 12(15), 2478. https://doi.org/10.3390/rs12152478(2020).
Khosravi, K. et al. Soil water erosion susceptibility assessment using deep learning algorithms. J. Hydro. 618, 129229. https://doi.org/10.1016/j.jhydrol.2023.129229 (2023).
Zabihi, M. et al. Spatial modelling of gully erosion in Mazandaran Province, Northern Iran. Catena 161, 1–13. https://doi.org/10.1016/j.catena.2017.10.010 (2018).
Chakrabortty, R. et al. Soil erosion potential hotspot zone identification using machine learning and statistical approaches in Eastern India. Nat. Hazards. 104 (2), 1259–1294. https://doi.org/10.1007/s11069-020-04213-3 (2020).
Ghorbanzadeh, O., Shahabi, H., Mirchooli, F., Valizadeh Kamran, K., Lim, S., Aryal,J., … Blaschke, T. Gully erosion susceptibility mapping (GESM) using machine learning methods optimized by the multi-collinearity analysis and K-fold cross-validation.Geomatics, Natural Hazards and Risk, 11(1), 1653–1678. https://doi.org/10.1080/19475705.2020.1810138(2020).
Bossio, D., Noble, A., Molden, D. & Nangia, V. Land degradation and water productivity in agricultural landscapes. Conserving Land. Protecting Water. 2, 20–32. https://doi.org/10.1079/9781845933876.0020 (2008).
Singh, P. et al. Estimation of ET and crop water productivity in a semi-arid region using a large aperture scintillometer and remote sensing-based SETMI model. Water 16 (3), 422. https://doi.org/10.3390/w16030422 (2024).
Zhang, S. et al. Effects of farming practices on yield and crop water productivity of wheat, maize and potato in china: A meta-analysis. Agri Water Manage. 243, 106444. https://doi.org/10.1016/j.agwat.2020.106444 (2021).
Mihalovic, M. Performance comparison of multiple discriminant analysis and logit models in bankruptcy prediction. Econ. Sociol. 9 (4), 101–117.(2016).
Statistical Center of Iran. (2016). Retrieved from https://www.amar.org.ir/english/Population-and-Housing-Censuses
Rafiei-Sardooi, E., Azareh, A., Shooshtari, S. J. & Parteli, E. J. Long-term assessment of land-use and climate change on water scarcity in an arid basin in Iran. Ecol. Model. 467, 109934. https://doi.org/10.1016/j.ecolmodel.2022.109934 (2022).
Gavrilovic, Z. The use of an empirical method for calculating sediment production and transport in unsuited or torrential streams. Int. Con Rev. Regime, 12(4), 411–422 (1988).
Baharvand, S. & Pradhan, B. Erosion and flood susceptibility evaluation in a catchment of Kopet-Dagh mountains using EPM and RFM in GIS. Environ. Earth Sci. 81 (20), 490. https://doi.org/10.21203/rs.3.rs-1133943/v1 (2022).
Trendafilov, B., Minchev, I., Trendafilov, A. & Blinkov, I. Comparison of EPM with RUSLE for soil erosion modeling in the Strumica river basin. Geogr. Environ. Sustain. 17 (4), 44–49. https://doi.org/10.24057/2071-9388-2024-0580 (2025).
Ahmadi, M., Minaei, M., Ebrahimi, O. & Nikseresht, M. Evaluation of WEPP and EPM for improved predictions of soil erosion: A case study of Kangir river basin, Iran. Model. Earth Syst. Environ. 6 (4), 2303–2315. https://doi.org/10.1007/s40808-020-00814-w (2020).
Bagherzadeh, A. & Daneshvar, M. R. M. Sediment yield assessment by EPM and PSIAC models using GIS data in semi-arid region. Front. Earth Sci. 5, 207–216. https://doi.org/10.1007/s11707-011-0168-z (2011).
Ebadati, N., Motlagh, S., Khoshmanesh, K., Razavian, F. & B., & Estimation of erosion and sedimentation using EPM and geomorphology models in a semi-arid environment (case study: Qir, Karzin basin of Iran). Environ. Earth Sci. 81 (15), 396. https://doi.org/10.1007/s12665-022-10521-7 (2022).
Bezak, N., Borrelli, P., Mikoš, M., Auflič, M. J. & Panagos, P. Towards multi-model soil erosion modelling: an evaluation of the erosion potential method (EPM) for global soil erosion assessments. Catena 234, 107596. https://doi.org/10.1016/j.catena.2023.107596 (2024).
Allouche, O., Soar, A. T. & Kadmon, R. Assessing the accuracy of species distribution models: prevalence, kappa, and the true skill statistic (TSS). J. Appl. Ecol. 43, 1223–1232. https://doi.org/10.1111/j.1365-2664.2006.01214.x (2006).
Dragičević, N., Karleuša, B., Ožanić, N. & Kisić, I. Effect of source-varying input data on erosion potential model performance. Geocarto International, 34(10), 1109–1122. (2019). https://doi.org/10.1080/10106049.2018.1474273 (2019).
Berteni, F. & Grossi, G. Water soil erosion evaluation in a small alpine catchment located in Northern italy: potential effects of climate change. Geosciences 10 (10), 386. https://doi.org/10.3390/geosciences10100386 (2020).
Arabameri, A. et al. Evaluation of recent advanced soft computing techniques for gully erosion susceptibility mapping: A comparative study. Sensors 20 (2), 335. https://doi.org/10.3390/s20020335 (2020).
Pourghasemi, H. R., Gayen, A., Park, S., Lee, C. W. & Lee, S. Assessment of landslide-prone areas and their zonation using logistic regression, logitboost, and naïvebayes machine-learning algorithms. Sustainability 10 (10), 3697. https://doi.org/10.3390/su10103697 (2018).
Faulkner, H. Badlands in marl lithologies: A field guide to soil dispersion, subsurface erosion and piping-origin gullies. CATENA 106, 42–53. https://doi.org/10.1016/j.catena.2012.04.005 (2013).
Ghorbanzadeh, O. et al. Evaluation of different machine learning methods and deep-learning convolutional neural networks for landslide detection. Remote Sens. 11 (2), 196. https://doi.org/10.3390/rs11020196 (2019).
Chakrabortty, R., Pal, S. C., Chowdhuri, I., Malik, S. & Das, B. Assessing the importance of static and dynamic causative factors on erosion potentiality using SWAT, EBF with uncertainty and plausibility, logistic regression and novel ensemble model in a sub-tropical environment. J. Indian Soc. Remote Sens. 48 (5), 765–789. https://doi.org/10.1007/s12524-020-01110-x (2020).
MAJ. Iran Agriculture Bulletin. Ministry of Agriculture Jihad, Agriculture Jihad, Tehran. (2021).
Chen, W. et al. Evaluation of different boosting ensemble machine learning models and novel deep learning and boosting framework for head-cut gully erosion susceptibility. J. Environ. Manage. 284, 112015. https://doi.org/10.1016/j.jenvman.2021.112015 (2021).
Pal, S. C. et al. Changing climate and land use of 21st century influences soil erosion in India. Gondwana Res. 94, 164–185. https://doi.org/10.1016/j.gr.2021.02.021 (2021).
Vu, V. T., Nguyen, H. D., Vu, P. L., Ha, M. C., Bui, V. D., Nguyen, T. O., … Nguyen,T. K. H. Predicting land use effects on flood susceptibility using machine learning and remote sensing in coastal Vietnam. Water Practice & Technology, 18(6), 1543–1555.https://doi.org/10.2166/wpt.2023.088 (2023).
Ahmad, F. & Goparaju, L. Soil and water conservation prioritization using geospatial technology–a case study of part of Subarnarekha Basin, Jharkhand, India. AIMS Geosciences, 3(3), 375–395. (2017). https://doi.org/10.3934/geosci (2017).
Mosavi, A. et al. Susceptibility mapping of soil water erosion using machine learning models. Water 12 (7), 1995. https://doi.org/10.3390/w12071995 (2020).
Mohammadkhan, S., Ahmadi, H. & Jafari, M. Relationship between soil erosion, slope, parent material, and distance to road (Case study: Latian Watershed, Iran). Arab. J. Geosci. 4, 331–338. https://doi.org/10.1007/s12517-010-0197-z (2011).
Shi, Z. H. et al. Soil erosion processes and sediment sorting associated with transport mechanisms on steep slopes. J. Hydrol. 454, 123–130. https://doi.org/10.1016/j.jhydrol.2012.06.004 (2012).
Mohammadi, S., Karimzadeh, H., Pourmanafi, S. & Soltani, S. Spatial and Temporal evaluation of soil erosion using RUSLE model Landsat satellite image time series (Case study: Menderjan, Isfahan). J. Range Watershed Manage. 71 (3), 759–774. https://doi.org/10.22059/jrwm.2018.221162.1073 (2018).
Renard, K. G. & Ferreira, V. A. RUSLE model description and database sensitivity. J. environ. Qual. 22 (3), 458466. https://doi.org/10.2134/jeq1993.00472425002200030009x (1993).
Rai, S. C., Pandey, V. K., Sharma, K. K. & Sharma, S. Landslide susceptibility analysis in the Bhilangana basin (India) using GIS-based machine learning methods. Geosyst. Geoenvironment. 3 (2), 100253. https://doi.org/10.1016/j.geogeo.2024.100253 (2024).
Youssef, A. M. & Pourghasemi, H. R. Landslide susceptibility mapping using machine learning algorithms and comparison of their performance at abha Basin, Asir Region, Saudi Arabia. Geosci. Front. 12 (2), 639–655. https://doi.org/10.1016/j.gsf.2020.05.010 (2021).
O’Brien, R. M. A caution regarding rules of thumb for variance inflation factors. Qual. Quant. 41 (5), 673–690. https://doi.org/10.1007/s11135-006-9018-6 (2007).
Abdollahi, S., Pourghasemi, H. R., Ghanbarian, G. A. & Safaeian, R. Prioritization of effective factors in the occurrence of land subsidence and its susceptibility mapping using an SVM model and their different kernel functions. Bull. Eng. Geol. Environ. 78 (6), 4017–4034. https://doi.org/10.1007/s10064-018-1403-6 (2019).
Esmali Ouri, A., Golshan, M., Janizadeh, S., Cerdà, A. & Melesse, A. M. Soil erosion susceptibility mapping in Kozetopraghi catchment, iran: a mixed approach using rainfall simulator and data mining techniques. Land 9 (10), 368. https://doi.org/10.3390/land9100368 (2020).
Naimi, B., Miguel, B. & Araújo Sdm: a reproducible and extensible R platform for species distribution modelling. Ecography. 39(4), 368–375. (2016). https://doi.org/10.1111/ecog.01881
Hosseinalizadeh, M. et al. How can statistical and artificial intelligence approaches predict piping erosion susceptibility? Sci. Total Environ. 646, 1554–1566. https://doi.org/10.1016/j.scitotenv.2018.07.396 (2019).
Saito, T. & Rehmsmeier, M. The precision-recall plot is more informative than the ROC plot when evaluating binary classifiers on imbalanced datasets. PloS One. 10 (3), e0118432. https://doi.org/10.1371/journal.pone.0118432 (2015).
Choi, J. H. et al. A machine-learning approach to combined evidence validation of genome assemblies. Bioinformatics 24 (6), 744–750. https://doi.org/10.1093/bioinformatics/btm608 (2008).
Pourghasemi, H. R., Yousefi, S., Kornejady, A. & Cerdà, A. Performance assessment of individual and ensemble data-mining techniques for gully erosion modeling. Sci. TTotal Environ., 609, 764–775. https://doi.org/10.1016/j.scitotenv.2017.07.198 (2017).
Chakrabortty, R., Pradhan, B., Mondal, P. & Pal, S. C. The use of RUSLE and GCMs to predict potential soil erosion associated with climate change in a monsoon-dominated region of Eastern India. Arab. J. Geosci. 13 (20), 1073. https://doi.org/10.1007/s12517-020-06033-y (2020).
Pournader, M., Ahmadi, H., Feiznia, S., Karimi, H. & Peirovan, H. R. Spatial prediction of soil erosion susceptibility: an evaluation of the maximum entropy model. Earth Sci. Inf. 11, 389–401. https://doi.org/10.1007/s12145-018-0338-6 (2018).
Azarafza, M., Azarafza, M., Akgün, H., Atkinson, P. M. & Derakhshani, R. Deep learning-based landslide susceptibility mapping. Sci. Rep. 11 (1), 24112. https://doi.org/10.1038/s41598-021-03585-1 (2021).
Agrawal, N. & Dixit, J. GIS-based landslide susceptibility mapping of the Meghalaya-Shillong plateau region using machine learning algorithms. Bull. Engin Eering Geol. Geo Environ. 82 (5), 170. https://doi.org/10.1007/s10064-023-03188-2 (2023).
Hirpa, B. A., Adane, G. B., Asrat, A. & Nedaw, D. Green, blue and economic water productivity: a water footprint perspective from the upper Awash basin, central Ethiopia. J. J. Water Clim. Change. 14 (2), 559–575. https://doi.org/10.2166/wcc.2023.400 (2023).
Tien Bui, D., Tuan, T. A., Klempe, H., Pradhan, B. & Revhaug, I. Spatial prediction models for shallow landslide hazards: A comparative assessment of the efficacy of support vector machines, artificial neural networks, kernel logistic regression, and logistic model tree. Landslides 13 (2), 361–378. https://doi.org/10.1007/s10346-015-0557-69 (2016).
Sobol, I. M. Global sensitivity indices for nonlinear mathematical models and their Monte Carlo estimates. Mathematics and computers in simulation, 55(1–3), 271–280. (2001). https://doi.org/10.1016/S0378-4754(00)00270-6
Faouzi, E., Arioua, A., Namous, M., Barakat, A., Mosaid, H., Ismaili, M., … Houmma,I. H. Spatial mapping of hydrologic soil groups using machine learning in the Mediterranean region. Catena, 232, 107364. https://doi.org/10.1016/j.catena.2023.107364 (2023).
Band, S. S. et al. Novel ensemble approach of deep learning neural network (DLNN) model and particle swarm optimization (PSO) algorithm for prediction of gully erosion susceptibility. Sensors 20 (19), 5609. https://doi.org/10.3390/s20195609 (2020).
Roy, P., Chandra Pal, S., Arabameri, A., Chakrabortty, R., Pradhan, B., Chowdhuri,I., … Tien Bui, D. Novel ensemble of multivariate adaptive regression spline with spatial logistic regression and boosted regression tree for gully erosion susceptibility.Remote Sensing, 12(20), 3284. https://doi.org/10.3390/rs12203284 (2020).
Arabameri, A., Chandra Pal, S., Costache, R., Saha, A., Rezaie, F., Seyed Danesh,A., … Hoang, N. D. Prediction of gully erosion susceptibility mapping using novel ensemble machine learning algorithms. Geomatics, Natural Hazards and Risk, 12(1),469–498. https://doi.org/10.1080/19475705.2021.1880977 (2021).
Silva, R. D., Lanças, K. P., Miranda, E. E. V., Silva, F. D. M. & Baio, F. H. Estimation and evaluation of dynamic properties as indicators of changes on soil structure in sugarcane fields of Sao Paulo State–Brazil. Soil. Tillage Reseachrch. 103 (2), 265–270. https://doi.org/10.1016/j.still.2008.10.018 (2009).
Ahmadpour, H., Bazrafshan, O., Rafiei-Sardooi, E., Zamani, H. & Panagopoulos, T. Gully erosion susceptibility assessment in the Kondoran watershed using machine learning algorithms and the Boruta feature selection. Sustainability 13 (18), 10110. https://doi.org/10.3390/su131810110 (2021).
Shikhteymour, S. R., Borji, M., Bagheri-Gavkosh, M., Azimi, E. & Collins, T. W. A novel approach for assessing flood risk with machine learning and multi-criteria decision-making methods. Appl. Geogr. 158, 103035. https://doi.org/10.1016/j.apgeog.2023.103035 (2023).
Rahmati, O., Yousefi, S., Kalantari, Z., Uuemaa, E., Teimurian, T., Keesstra, S.,… Tien Bui, D. Multi-hazard exposure mapping using machine learning techniques: A case study from Iran. Remote Sensing, 11(16), 1943. https://doi.org/10.3390/rs11161943(2019).
Ganjirad, M., Delavar, M. R. & Sensing, R. Flood risk mapping using random forest and support vector machine. ISPRS Annals of.the Photogrammetry, Spat. Inform. Inf. Sci., 10, 201–208. https://doi.org/10.10.5194/isprs-annals-X-4-W1-2022-201-2023 (2023).
Lee, S., Hong, S. M. & Jung, H. S. GIS-based groundwater potential mapping using artificial neural network and support vector machine models: the case of Boryeong City in Korea. Geocarto Int. 33 (8), 847–861. https://doi.org/10.1080/10106049.2017.1303091 (2018).
Author information
Authors and Affiliations
Contributions
**Elham Rafiei-Sardooi** : Data curation, Methodology, Software, results analysis, Writing - original draft. **Fahimeh Mirchooli: ** Conceptualization, Methodology, Results, Results analysis, Writing- Original draft preparation. **Ali Azareh: ** Visualization, Investigation, Writing - Introduction, Review & Editing. **John J. Clague: ** Investigation, Visualization, Writing- review & editing.
Corresponding author
Ethics declarations
Competing interests
The authors declare no competing interests.
Additional information
Publisher’s note
Springer Nature remains neutral with regard to jurisdictional claims in published maps and institutional affiliations.
Rights and permissions
Open Access This article is licensed under a Creative Commons Attribution 4.0 International License, which permits use, sharing, adaptation, distribution and reproduction in any medium or format, as long as you give appropriate credit to the original author(s) and the source, provide a link to the Creative Commons licence, and indicate if changes were made. The images or other third party material in this article are included in the article’s Creative Commons licence, unless indicated otherwise in a credit line to the material. If material is not included in the article’s Creative Commons licence and your intended use is not permitted by statutory regulation or exceeds the permitted use, you will need to obtain permission directly from the copyright holder. To view a copy of this licence, visit http://creativecommons.org/licenses/by/4.0/.
About this article

Cite this article
Rafiei-Sardooi, E., Mirchooli, F., Azareh, A. et al. Impact of soil erosion on agricultural sustainability based on crop water productivity in semi-arid Iran. Sci Rep 15, 40462 (2025). https://doi.org/10.1038/s41598-025-24353-5
Received:
Accepted:
Published:
Version of record:
DOI: https://doi.org/10.1038/s41598-025-24353-5
