
Abstract
Global health resources have expanded quickly and global health has improved in many places. However, such progress has resulted in a demand for the management and safe disposal of medical waste, particularly in many developing countries which still lack adequate facilities and regulatory framework to deal with their medical waste. This study analyzes decarbonization and circular economy principles of sustainable medical waste management to find optimal solutions for reducing environmental impact and enhancing system efficiency. A novel hybrid MCDM model which combines DEMATEL-ANP is applied for identifying the key factors influencing the decarbonization and medical waste practices. It takes into account the interaction between factors and assists in decision making under uncertainty, particularly when data are scarce. The outcomes of the study highlight the sustainable management of medical waste and their correlation with certain UN-SDGs. According to DEMATEL results, both sustainable development (C1) and advanced technology adoption (C3) have significant cause-effect relationships on the other CE practices, whereas according to ANP findings, prospective investigative dominances of the advanced technology adaption (C2) and sustainable development (C1) are great backbones of decarbonization circular economies. The finding of this study offer specific insights for policymakers and administrators for reducing their environmental burdens, enhancing resource efficiency, and developing the resilience and sustainability of healthcare systems. To the best of our knowledge, this study becomes the first to emphasize medical waste management as a climate challenge and a sustainability issue and utilize a hybrid DEMATEL- ANP approach to facilitate evidence based policy making in low-resource settings in developing countries concurrently considering environmental sustainability as well as healthcare operations gap.
Introduction
In the 21st Century, those factors reflect a mounting environmental crisis worldwide that has become largely man-made through the degradation of fragile environments1. One of those driving actors in this scenario is the health environment and one of those paramount, though muffled, elements worldwide is the huge volume of medical waste2. Healthcare is becoming an integral part of what should be a sector that mitigates damage to human wellbeing and yet it perversely adds to climate change and pollution. The World Health Organization (WHO) predict the health system is responsible for 4.4% of global net emissions3. Mishandling of medical waste adds to this footprint through methane released to the air at landfills, hazardous chemicals generated during incineration, and energy requirements of old school processing Which is to say, the decomposition of medical waste isn’t just a sanitation issue; it’s an immediate climate issue. Decarbonizing healthcare systems around the world are increasingly realizing the significance of waste management5. Conventional treatment methods, such as incineration and autoclaving, are also energy dependent processes using non-renewable fuels that contribute to the carbon footprint6,7. Conversely, low carbon alternatives such waste sorting and recycling, sterilization driven by renewable energy systems in the operation of this kind of autoclave and circular economy (CE)-based circular economic production mode could result in an important reduction in CO2 emissions8,9. The World Bank (2024) stated that investments in waste management infrastructure at the health facilities can potentially reduce related emissions by 30% and reduce air, water pollution and odor [4 Placing these activities in relation to commitments in the international climate regime such as the Paris Agreement, also underscores the importance of integrating waste management into national decarbonisation strategies10.
The circular economy (CE) has emerged as a conceptual framework to guide the pursuit of these objectives, which seeks to optimize resource use, reuse products and materials, recycle as much as possible, and reduce waste4. Regarding the healthcare perimeter, several sustainable CE initiatives (e.g., reprocessing of SUDs) have been identified that may reduce the quantity of hazardous waste requiring high-energy level treatments and decreasing emissions5. These practices contribute not only to climate resilient cities, but potentially also to UN Sustainable Development Goals (SDG) such as SDG 3 (Good Health), SDG 12 (Responsible Consumption and Production), and SDG 13 (Climate Action)6,7. Recent forecasts further suggest that the mitigation of health-related emissions from healthcare services is possible, with a reduction potential by 25% by 2030 through implementation of CE practices. Sharma and Bangur6 have estimated it can be realistically achieved if circular economy applied to healthcare faster: global health related-emissions to fall 25% by 2030. By integrating circularity goals into national health policies and aligning them with the SDGs, governments and healthcare institutions can trigger systemic change that is conducive to planetary health and sustainable8.
Studies on medical waste management in the healthcare sector are scarce, and a research gap exists in the use of CE strategies to promote decarbonization. Existing research has typically focused on technology-specific solutions, emissions targets at the policy level, or qualitative analyses of SDG linkages. There are few systematic data-driven analyses of how CE strategies may or may not be strategically coupled with decarbonization at the firm level. In addition, although Multi-Criteria Decision-Making (MCDM) methods are widely used in sustainability considerations, they are rarely applied to CE-based medical waste management under uncertainty. Specifically, the combination of DEMATEL and ANP to grasp intricate linkages among CE initiatives, carbon reduction, and SDG indicators is seldom analyzed.
To bridge these gaps, a holistic framework based on CE principles in the context of medical waste management and its alignment with the UN-SDGs has been developed in this study using a hybrid DEMATEL-ANP approach. The objectives are:
-
1.
To map and detect initiatives of CE transition in health waste systems.
-
2.
To apply the DEMATEL method to examine causal relationships between these factors.
-
3.
To rank CE strategies based on their ability to facilitate decarbonization and SDGs in the most effective way using ANP.
The major contributions of this study are as follows. First, it reframes medical waste from a sanitation problem or cost issue to one involving climate and sustainability. Second, it helps to construct a novel methodological framework for DEMATEL and ANP so that decision makers can evaluate CE strategies under uncertainty and in an interdependent manner. Third, it provides policy and managerial advice by mapping CE interventions to global climate and sustainability policies/agendas as well as a roadmap for carbon and resource-efficient health systems. They are particularly relevant in developing countries where the production of healthcare waste is increasing and sound management infrastructure remains lacking.
Literature review
Existing literature emphasize that CE practices can indeed significantly contribute to sustainable healthcare waste management and the minimization of environmental impacts, as well as address the UN-SDGs9. By re-defining healthcare waste as a sanitation challenge and an environmental stewardship imperative, CE efforts around environmentally preferable purchasing and waste reduction provides the connection between ecological sustainability to cost effective operations10. One of the main drivers of this change is technology innovation such as microwave sterilization, waste gasification, and IoT based waste-tracking have been found to mitigate the waste and lifecycle emissions11,12. These are systemic interventions towards data-driven hospital sustainability. However, most of the literature addresses single options in isolation and lack of decision support frameworks to compare among competing options as well as to gauge their congruence with a larger decarbonisation plan. Beyond the technological, education and institutional culture are critical for successful CE uptake. Without skills training and policy drives to enroll users, even the best technology with enabling laws can suffer from mean of users13.
Mandating environmental management into teaching can from the legislative path transform culture at institutional level and create an educated personnel which may drive sustainable development transition14. However, the impacts of such interventions are infrequently quantified and included in more comprehensive CE systems. Finally, management development including leadership and governance is still indispensable to the institutionalization of CE in healthcare. Principles, such as green budgeting and sustainable infrastructure investment and cross-sector collaboration foster the longer-term alignment with CE22, whereas performance indicators offer instruments to track our move towards this end goal15. But, despite the aforementioned contributions, existing research efforts are disjointed and dimensions of Sustainability, Technology, Education and Governance not synthesized in frameworks.
In summary, CE in healthcare is not a single intervention as the literature suggests a multi-level ecosystem. However, few integrated analyses have accounted for these interrelations and the use of MCDM tools such as DEMATEL or ANP has only recently started. To this gap, the present paper envisages a comprehensive methodology framework for assessing and ranking CE strategies in MWM through decarbonization in application of the UN-SDGs.
Sustainable development
Incorporating concept of CE practices is also important to harmonize medical waste management with the SDGs. In healthcare, sustainable development strategies include the procurement of low impact, reusable or recyclable medical products with an aim to reduce source waste generation16. Investments in innovative setups including local waste treatment plants and green supply chain options, enhance the organizational capacity for environment friendly operations and reduce reliance upon energy inefficient centralized systems17. Manufacturers and regulators are getting more and more interested on designing medical devices that could be upgradeable, reusable, recyclable rather than disposable, especially for items such as surgical instruments issued uniforms in order to decrease the heavy burden put on landfills and to foster resource efficiency18.
In addition, it is essential to take sustainable medical products, environmental sustainability and responsible consumption in healthcare into account19. Together, these measures demonstrate the potential for sustainable development in achieving CE within the health sector thereby contributing to environmental protection, cost efficiency and adaptive capacity of health systems.
Advanced technology adoption
Advanced technology has a big role to play in mainstreaming CE principles in medical wastes management that could eventually lead to achieving the SDGs. Advanced technologies, including autoclave treatment, microwave sterilization and plasma pyrolysis have been used instead of the traditional incineration method as they inflict less influence on the environment20 and are more effective in decreasing the volume of infectious waste. IoT-based solutions were also employed to monitor the generation, segregation and disposal of waste in real time which supports decision-making with data, and compliance improvement21. In contrast, there do exists a blockchain network for the medical waste tracking although still in its infancy stage and has not been built up yet against for the purpose of medical waste tracking, transparency, tamper-evidence of chains records and integrity over accountability between patients or publics and waste managing facilities22. The decentralized waste treatment systems consisting of small on-site sterilization units would be an option to limit the emission by minimizing the need for transporting the waste and also would offer solutions that are applicable in rural and low-resource health care settings as well23. Collectively, these technologies improve environmental performance and support a more sustainable healthcare infrastructure that pursues CE objectives.
Education and institutional actions
Education and institutional actions are key enablers of the uptake of CE in healthcare waste management systems, leading directly to a sustainable change in the delivery of responsive healthcare and supporting SGDs 12 and 13. Educating staff on proper segregation and effective management of waste, is expected to lead to higher environmental compliance and successful waste reduction24. Effective environmental awareness and green certificates programs, such as “My Green Doctor” have resulted in behavior changes and higher environmental awareness levels in hospitals25. In addition, adopting a pharmaceutical stewardship policy as part of hospital management by holding inventory as required, training staff to recognize medicines with an expiry period that is approaching and dispensing medicine judiciously has been reported to encourage efficient use and minimization of drug wastage26. To a certain extent preventive strategies such as use of reusable in clinical care, curbing overuse of disposables, purchasing exercises also reduce material directed turnaround in healthcare27. These educational and practical strategies can help reduce waste generation and promote a sustainability ethos that is essential in the context of sustained systemic change in health.
Management development
The formulation and implementation of management policies to drive CE in healthcare is critical in transforming the sector to one that is sustainable industry. The use of eco-friendly medical products for patient care (e.g., degradable disposable surgical instruments, recycling used medical devices, and reducing material use) was associated with lower waste and resource use in healthcare facilities28. Further, optimizing healthcare asset-sharing platforms that link medical facilities to share pricey, dedicated equipment aims to maximize the resource’s value, reduce unnecessary purchases, and limit waste by extending service life29. Energy recovery technologies, such as waste-to-energy systems, are emerging technologies used in hospitals to treat medical waste and generate energy to meet the hospital’s energy demand30. Regenerative practices in medical waste management, which include reducing waste through extended product life cycles and recycling materials from medical devices, also fall under a feed-your-green approach to resources, which has an action part —either regenerative or degenerative —unlike circular, which replenishes resources31. Together, these management innovations are key tools to increase health-system efficiency and sustainability and are helping to achieve global sustainability targets, including SDGs 12 and 13. All the CE initiatives are detailed in Table 1.
Research gap in past studies
Over the past decade, healthcare systems have been identified as a significant source of environmental degradation, primarily due to medical waste and CO₂ emissions. Eckelman and Sherman34 calculated that the entire U.S. healthcare system is responsible for almost 8% of the country’s greenhouse gas emissions, and a global analysis by Health Care Without Harm (2020) ranked it as the fifth-largest contributor35. These results have led to increased interest in developing sustainable solutions to the conventional waste management approach. CE strategies such as reprocessing single-use devices, using reusable medical textiles, and material recovery have demonstrated reductions in waste volumes and associated emissions36,17. In addition, sound waste management services are within the orbit of realization of SDGs 12 and 13 for low-carbon and resilient healthcare infrastructures37, Research in India and Brazil shows that simple, central waste treatment developed in response to community needs in varying socio-economic contexts can be scaled-up38,39 This body of work collectively constitutes the latest science advising policymakers to refocus on climate-smart health care, invest in renewable energy technology, and seamlessly integrate public health objectives with global sustainability. Although precise, most research on technological advancements and policy-level interventions uses the MCDM approach to evaluate CE strategies under uncertainty. Furthermore, existing research rarely links these strategies specifically to the UN-SDGs, indicating a knowledge gap in actionable advice for policymakers and healthcare managers. To our knowledge, this research fills these gaps through the integration of CE and MCDM approaches to decision-making under uncertainty, by explicitly linking outcomes to the UN-SDGs, and by strategically evaluating the assessment of operational, resource, and sustainability aspects. Together they present a novel and evidence-based roadmap for the decarbonization of medical waste management underpinned by sustainable development goals.
Methodology
In this paper, a strategic evaluation scheme is advocated for decarbonization trajectories over MWM, and it incorporates the CE principles with the MCDM techniques under uncertainty. The process can be segmented into a series of steps and is presented as follows:
Application of the methodology
Specific to practical relevance, the framework was employed on Pakistani medical and healthcare setting varying in terms of size and resource capacity. The collected data were used to formulate criteria for evaluation and CE initiatives, and MCDM methodologies were applied to evaluate the performance of various interventions under uncertainty. The results were benchmarked against UN-SDGs aimed at demonstrating sustainability improvements. The application demonstrated the optimal and practical CE strategies in hospitals and healthcare centers, confirmed the good effectiveness of the stimulus framework for CE-MWM capacity based on evidence and decarbonized approach prosecution.
Study framework and ANP-DEMATEL techniques
The ANP-DEMATEL method combines the capabilities of the Analytic Hierarchy Process, Decision-Making Trial and Evaluation, and the Analytic Network. The DEMATEL method which making it possible to analyze and calculate an influence matrix, clarifying the strengths, intensity by among reciprocal cause-and-effect connections. Not all factors can in reality affect the entire system uniformly, so that each factor does not have the same weights40. Second, utilizing the network structure of determining elements by the DEMATEL method, and finally we apply it to adjust factor weights with ANP approach in a more general condition. To ensure adherence to ethical principles, we obtained official written approval from the Research Ethics Committee of the School of Business at Xian International University. Written consent was obtained from all participants, who were guaranteed anonymity. Finally, we told participants that the data would be used only for academic purpose and no private information would be revealed.
DEMATEL & ANP approach calculation procedure
DEMATEL-ANP methodology is commonly applied for the priority assessment of criteria focusing on the intricacies and interactions between different parameters41,42. The DEMATEL-ANP method has been used in many kinds of research studies such as financial decision making, supplier selection, and sustainable exploration like medical waste management systems43,44,45. This study aims to explore the intricate interrelationship and prioritization of medical waste drivers. Insight into method maturity, this study can proficiently utilize the DEMATEL-ANP scheme. Therefore, the DEMATEL-ANP conducts a structural causal analysis and a scan of significant enablers. The comprehensive framework of this research is developed using the DEMATEL-ANP technique, as shown in Fig. 1. Here, we detail the method’s comprehensive calculation, data collection, and processing.

Study Framework and ANP-DEMATEL approach.
The DEMATEL calculation process
DEMATEL solves intricate system problems by developing structural models to indicate the influence relations among several factors46. In this way, graph theory and matrix techniques are used for index analysis, and a direct influence matrix is constructed from the influence relations among factors. Subsequently, each factor’s central and causal degree is computed, and a diagram is developed. The causal ties between factors and their relative importance within the factor system are determined47,48. The calculation procedure is described as follows.
Construct the direct effect matrix and normalize
In the DEMATEL approach, experts assess the direct impact of the factor i on factor \(j~\)on a scale from 0 to 4, where 0 indicates “no influence” and 4 indicates “very high influence,” show in Table 2. The degree of contribution is represented as \(dij\), and we average the score of each expert on this pair of attributes to obtain the direct influence average matrix A, which can be formulated as:
Here \(aij\) is the mean of \(dij\), which is the mean score for i influencing \(j.~\)Because a component cannot have any effect on itself, the diagonal elements \(\left( {~aii} \right)\) are all zero. Let A be the matrix representing the direct impact relations between the system factors.
According to Eqs. (2) and (3), the matrix A is then normalized based on the column and row normalization to gain a normalized direct influence average matrix X, and each factor of X falls in the range (0, 1).
Construct the comprehensive influence matrix T
The Eqs. (4) and (5) compute the total impact matrix T.
Here, \(I~\)is devoted to the unit matrix, and inside the T matrix, the summation of \(ith\) the row indicates the aggregate direct and indirect effects attributable to the factor \(\:i\) on other factors. Likewise, inside the T matrix, the summation of \(\:jth\:\)column represents the aggregate direct and indirect impacts derived by the factor \(\:j\:\)from other factors.
Determine the center degree and rationale degree of each element
In the total influence matrix, the sum of all values in a row is used to measure the factor’s total direct and indirect effects on other factors (Eq. 6), which is called the influencing degree (R). In contrast, the sum of the column gives the overall impact that factors from the other parts of the system (Eq. 7), which is called the influenced degree (C). These measures then calculate every factor’s center degree and cause degree. The center degree represents a factor’s overall importance in the system (the higher the importance, the stronger interactions it tends to have with the other elements). If its value is greater than 0, its impact overrides all other factors and becomes the cause factor. When its value is less than 0, other factors influence the factor more and are designated as the resulting factor. The cause-and-result factors can be easily understood by applying the degree: a positive value denotes a cause factor that affects most other factors. In contrast, a negative value denotes a result factor affected most by other factors in the system. These values indicate the importance, as well as the direction, of the impact within the structural model.
Create the influence diagram
The influence graph underlines the logical connections among elements, with the horizontal axis as the center degree value and the vertical axis as the reason degree value. The elements are connected via their relations expressed in the influence figure.
Computation of ANP
The ANP approach is an advanced version of AHP, developed for complex decision-making and introduced by Saaty in 199649. ANP can accommodate a non-independent hierarchical structure, precise assessment, and the prioritization of indicators at all levels by accounting for dependencies among clusters and factors50. ANP computation steps are concise by47, which are below.
ANP network structure development
The network structure of ANP describes the interconnections among factors across different hierarchies, displaying these interrelations using bidirectional arrows or arcs47. The formulation of the ANP network structure based on identified factors and their interconnections, derived from the DEMATEL influence diagram using Super Decision software and Excel.
Pairwise comparison matrix development
The pairwise comparison matrix was developed by following Satay’s consistent matrix approach. Experts for this study were requested to evaluate the relative significance of factors within the same structure via pairwise comparisons using a nine-point Saaty scale, as shown in Table 3. Through pairwise assessment of relatively significant elements, a matrix was developed, which is devoted to a pairwise comparison matrix.
Consistency check
CR (Consistency Ratio) and CI (Consistency Index) are used to check the pairwise comparison matrix consistency logically by using Eqs. 8 and 9. The \(CR\) of pairwise comparison < 0.1 is logically reliable.
Where n represents the pairwise comparison matrix size, while λmax signifies the pairwise comparison’s maximum eigenvalue, and \(RI\) is the average value of the stochastic matrix \(CI~\)with \(RI\) from ranging value at 0.00, 0.58, 0.90, 1.12, 1.24, 1.32, 1.41, 1.45, 1.51 for \(n=\) 2,3,4,…,1 respectively
Develop the unweighted super-matrix
The pairwise comparison matrix outcomes are used to construct an unweighted super-matrix W’. Equation 10 defines its mathematical formulation of super-matrix W’.
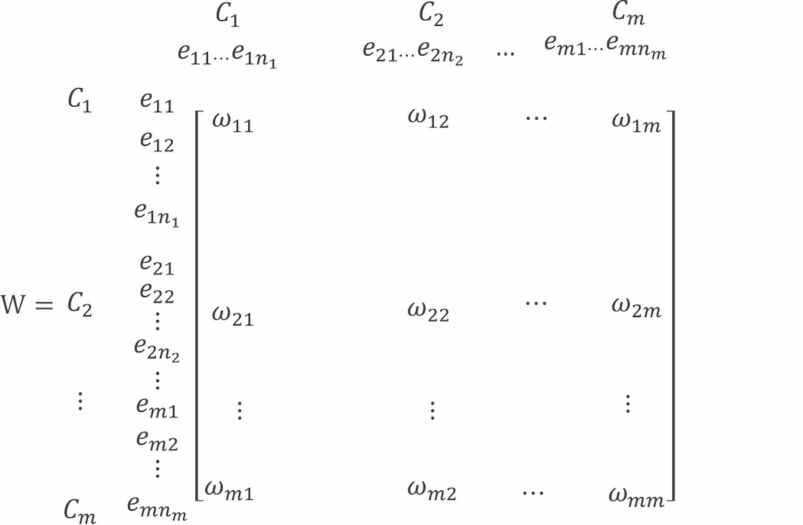
In the above context, m is defined as the clusters, while n signifies the factors quantity within every cluster. Same as \(cm\) represents the mth cluster, and mn indicates mth element in \(mn\)th cluster, and nm shows all the factor quantities in the math cluster. The equation \(\omega ij~\left( {\omega 11~.~.~.~\omega m1~.~.~.~\omega mm} \right)\) is represented by an unweighted super-matrix \(W{\prime }\), where \(\omega ij\) describes the eigenvector associated with the factors influencing in cluster ith on the\(~j\)th cluster’s factors, such as factors confined to primacy in the pairwise comparison. If there is no influence exists in the relationship, then \(\omega ij\) equals 0.
Derive the weighted super-matrix
It is essential to accurately assess indicators at a multi-level for deriving the weighted super-matrix because the unweighted super-matrix is developed without taking influences among clusters. Equation (11) utilizes cluster taking as a variable and compares relative weights pairwise to construct a relative weight matrix C. Consequently, the weighted super-matrix W is developed by applying Eq. (12) by combining the relative weight matrix C and unweighted super-matrix W
where \(cij\) denotes the eigenvector value of influence of the cluster \(ith\) on cluster \(jth~\)such as the clusters’ primacy in the pairwise comparison.
Obtain the limit super-matrix
For factor weights to be ascertained, Eq. (12), the weighted super-matrix is elevated to the power of \(\:k\) in Eq. (13) until stability is achieved. In the limited super-matrix, factors’ weights are located in respective columns, while the clusters’ weights indicate the total factor weights they encompass. The clusters and factor weights calculation are used to determine their priorities.
Acquisition of data and process
The DEMATEL technique does not require a large sample size, which can be used to analyze the interactions among factors simply51. Similarly, the ANP model does not impose a preset sample size; a study with a small sample size (N ≤ 30) is thought feasible in methodology52,53. In recent years, the ANP and DEMATEL approaches have been increasingly employed in small sample-size studies53,54. In the present study, we used a purposive sampling strategy to identify experts who could provide insightful views. Fifteen experts were invited to the DEMATEL and ANP analyses through questionnaires. These represent experts from four core segments in Pakistan: (1) government, (2) medical industry associations, (3) hospitals and healthcare centers, and 4) colleges and universities of medicine. The 10 experts with more than 10 years of working experience in sustainable medical management and participating in low-carbon medical supplies projects were selected. Panel of 5 to 10 experts in MCDM context has been used in healthcare/sustainability domains in some past studies such as55,56,57,58. Their practical and theoretical knowledge of low-carbon development in the medical and healthcare sector enhanced the accuracy and reliability of the research findings. A detailed description of the experts is given in Table 4. The two rounds of questionnaires were collected between January and March 2025. The DEMATEL questionnaire was provided on-site or by e-mail in the first round, and eight experts answered on-site and two answered by e-mail. Using a five-point Likert scale, this survey assessed the influence of relations between the detected driving factors. After establishing these relationships, the second round of the ANP questionnaire was conducted, which included estimating the subjective importance of the degrees of factors on a scale from Saaty’s nine-point scale. The panel of experts had responded to a similar questionnaire. The reliability analysis for the data obtained from the DEMATEL and the ANP was performed individually for consistency and reliability. To verify the data collected from the DEMATEL questionnaire, the responses of 10 experts were randomly and equally divided into two sets. A variance test was applied with SPSS software, yielding a p-value > 0.05 for each driver, meaning the two datasets are not statistically different. About the ANP questionnaire, consistency ratio (CR) testing was carried out with the aid of Super Decisions software, and the CR values were calculated according to Eqs. (8) and (9). All CR values were less than 0.1, indicating that the pairwise comparisons were internally consistent. Thus, data extracted from the DEMATEL and ANP questionnaires were considered acceptable and applicable for further investigation.
Results and analysis
DEMATEL results
Shear expert scores were weighted equally, and the direct influence matrix was formed (Eq. 1) to estimate the short-term effect on drivers. It was then normalized (see Table S2) (Eqs. 2–3) to ensure consistency. Equations (4, 5) were employed to obtain the total influence matrix (see Table 5, for more details see Table S5), which included direct and indirect effects. Then, center and reason degrees were computed by Eqs. (6, 7) (shown in Table 6) to assess the role of every driver. The center degree represents the influence of a driver, and the center degree represents its classification: drivers with positive values are cause drivers (influencers), and drivers with negative values are result drivers (influenced).
Center degree
The center degree indicates the influence power of the factor to correlate and attract other factors; greater values correspond to words that correlate strongly. As revealed in Table 5, C1 (Sustainable Development) has a relatively significant effect on C2 (Advanced Technology Adoption = 0.4806), C3 (Education and institutional actions = 0.4449), and C4 (Management Development = 0.4825), which means C1 is also effective in influencing multiple components. C2 has a moderate influence on C1 (0.4434), C3 (0.4379), and C4 (0.4745), which indicates an influence spread across the system. C3 has an impact on C1 (0.4409), C2 (0.4535), and C4 (0.4550), and the balanced degree of impact is slightly lower than that on C1 and C2. C4 has the most outstanding value among them, and the factors of 0.4758 (C1), 0.5098 (C2), and 0.4541 (C3) can be identified as the most important components of the system. This prediction emphasizes the overrepresentation of C4 as the most influential driver and that the other ones, particularly C3, have a less strong influence in the global influence network. For secondary initiatives, C12 and C14 present high center degrees and low reason degrees (-0.9641 and − 1.3219), which makes them both result drivers, which indicates that others influence them to a greater degree than they influence them. C32 shows the highest positive reason degree (1.5304), and it plays the strongest role with a significant influence and low dependence. On the contrary, C42 (Optimizing healthcare asset sharing platforms among healthcare facilities) has a highly negative reason degree (-1.3222), meaning it is one of the most dependent or influential factors. Other initiatives, such as C24 (Decentralized medical waste treatment models by technology) and C33 (Increase the pharmaceutical resource efficiency), all have moderate center and reason degrees , which tells us that they both influence and are influenced by others. In general, initiatives associated with high positive reason degrees C32 (Education and awareness in medical facilities) and C44 (Regenerative Practices) are major influences, whereas other drivers influence initiators with negative reason degrees C12 (Investments in innovative setups) and C42 (Optimizing healthcare asset sharing platforms among healthcare facilities).
Reason degree
The reason degree refers to a factor (influence direction) on the other. If the value is > 0, the factor affects other factors more, and the factor is defined as a cause factor. If negative, it is less responsive due to other factors and is referred to as a result factor. Table 6 reveals the values of the reason degree. C34 (Taking waste mitigation actions = 1.5304) and C44 (Regenerative Practices = 0.7718) have relatively large positive reason degrees, meaning they should be identified as the system’s most important initiatives or innovators. In contrast, a negative reason degree indicates that others relatively more dominate the campaign and result from initiative. The most negative values are found in C42 (Optimizing healthcare asset sharing platforms among healthcare facilities =-1.3222) and C14 (Sustainable medical supplies = -1.3219), which indicate high reactivity and strong dependence on other initiatives. Primary initiatives, such as C1 (0.0211) and C31 (0.0109), display a near-zero reason degree, which indicates a well-balanced affection. They affect others almost as much as they are affected. Understanding reason degrees also enables decision-makers to distinguish which initiatives are cause drivers and result drivers (shown in Fig. 2), guiding the decision-makers on where to focus for the maximum influence.

Key findings of CE initiatives (C + R value and Cause and Effect).
Calculating the weights in Tables 5 and 6 establishes an influence diagram for the CE initiatives system (as shown in Fig. 3) for the structural diagram. This graphic utilizes the center and reason degrees to place CE initiatives drivers on a four-quadrant coordinate system, where the horizontal axis is the 0° line, and the vertical axis is the average center degree of primary or secondary drivers, respectively. The first and second quadrants represent strongly and weakly correlated cause drivers, and the third and fourth quadrants represent weakly and strongly correlated result drivers. Derived influence relationships are visualized in directional arrows from the influencing driver towards the influenced one based on Table 5. A cut-off of 17.09 was set to stress higher dependencies, and only relationships with values higher than that threshold are depicted in the diagram.

Influence Diagram of CE initiatives.
Sensitivity analysis
To test the sensitivity of the model, a sensitivity analysis was performed by changing the weights of the experts. The weight of the first expert in the beginning was set most heavily, while the others were given equal weights. This scenario was conducted to investigate the impact of shifts in expert opinion on the prioritization of the CE initiatives. The outcome of the sensitivity analysis of ordinal ranks before and after expert weights adjustment are compared in Table 7 and Fig. 4.
The results show that the list of important initiatives remains more or less the same, even if the weights of experts are not the same. C21 (Advanced Technology in Recycling and Sterilization) remains the most relevant initiative in both cases. Likewise, C14 (Sustainable Medical Supplies) is still number 6, C22 (Monitor and Tracking the Waste Matrices) and C24 (Decentralized Medical Waste Treatment Models by Technology) are still 7 and 5 respectively. These findings indicate that these attempts are not sensitive to the weight distribution and can carry significant significance. But there are no longer so clear gradients within certain initiatives after having carried out the sensitivity analysis. C4 (Management Development) improves rank the most with a difference of 2 ranks (from 4th to 2nd) since this activity becomes much more valuable when expert weights are updated. Also, C34 (Taking Waste Mitigation Actions) moves from 11th to 8th indicating more relevance with the re-arranging of expert’s weights. Contrarily, the second biggest increase takes place in C44 (Regenerative Practices) which leaps from 18th to 4th, indicating that once expert opinions are revised, there is room for substantial increase in the relevance attributed to this initiative. Meanwhile, some initiatives reduce their ranking with the sensitivity analysis. For example, C1 (Sustainable Development) which still would be rated as the highest priority falls from rank 15 to 17, an indicator of its decreasing importance. C43 (Energy Recovery) also decreases substantially from the 19th to the 20th, which means that it is considered less important when the expert weights are reassigned.
The high sensitivity indicates that the order of the different CE initiatives to a great extent remains the same, yet it can shift the position within the different development strategies. While a few initiatives, including C21 (Advanced Technology in Recycling and Sterilization) and C14 (Sustainable Medical Supplies) receive the same ranking whether the packing weight distribution is considered, some, such as C4 (Management Development) and C44 (Regenerative Practices) tend to rank higher, highlighting the salience of these initiatives. On the other hand, initiatives such as C1 (Sustainable Development) and C43 (Energy recovery) show variability, which means that their importance is more sensitive to expert opinion changes. This study highlights the fluidity of ranking systems within decision-making models and the importance of vetting expert input to inform strategic priorities.

Sensitivity analysis.
ANP results
The DEMATEL method was also applied to ascertain influence relationships among drivers, following its use in ANP to obtain the hierarchical weights and priorities of the group of initiatives. The expert-derived pair-wise comparisons were organized systematically into multiple matrix forms, the unweighted super-matrix (see Table S11), normalized weighted super-matrix (see Table S12), and the converged limit super-matrix, as encapsulated in Eqs. (10–13), respectively. The obtained priority values of CE primary and secondary initiatives, derived from the stabilization of the eigenvector of the limit super-matrix, are listed in Tables 8 and 9 (Figs. 5 and 6). All computations were performed using the Super Decisions software v3.2 and Excel to help guarantee methodological rigor in matrix manipulation and analytical replicability. Based on Table 7, the most important primary initiatives towards decarbonization in the CE are ranked in the following order: C1(Sustainable Development = 0.3684), C2 (Advanced Technology Adoption = 0.2776), C3 (Education and institutional actions = 0.2132), and C4 (Management Development = 0.1408). The top secondary initiatives with weights higher than 0.1 are C14 (Sustainable medical supplies = 0.1472), C23 (Blockchain for traceability of medical waste = 0.2113), C31 (Training and Education of Medical staff = 0.1556), and C41 (Eco-Friendly medical products = 0.1714). These initiatives are highlighted as crucial for driving systemic change toward sustainable circularity through ANP analysis.

CE initiatives with the context of medical waste and UN-SDGs.

Impact level of CE Initiatives by ANP results.
Discussion
Influence relationships of CE drivers
The highlights of Fig. 3; Table 6 provide the influence relationships among CE initiative drivers. This study’s results offer new understandings of the effect relationships involving the drivers of CE initiatives and their effects for decarbonizing healthcare. Sustainable development (C1) and management development (C4) were the most influential at both the technological adoption (C2) and institutional actions (C3) levels. This serves to emphasize that technical solutions are not enough unsupported within a clear wider context of sustainability and good government. All these outcomes converge with global discourse around the need for healthcare to step beyond piecemeal waste solutions, and integrate systemic decarbonisation strategies, which have impacts on SDG 3 (Health and well-being), SDG 12 (Responsible consumption and production) and SDG 13 (Climate Action). These findings have particular significance as policy and management changes are prerequisites for increasing the adoption of advanced technology. This is also consistent with Sharma and Bangur6 argued that CE consumption requires robust governance to realize its complete mitigation potential. In developing countries, where the predominant healthcare systems have a quite deterrent infrastructure, significance of this study C1 and C4, concerning the impact of CE on policy strategies, suggest that these need to focus mainly on strengthening institutions and regulation while fostering leadership for the successful integration of CE in countries with more deterrent healthcare infrastructures. Such policies are consistent with countries’ pledges under the Paris Agreement and take available local health and environmental co-benefits into account. Finally, at the operational level, cause factor such as eco-design of medical devices (C13), blockchain traceability (C23) and decentralized treatment models (C24) demonstrate that CE initiatives can lower emissions directly. But their large central distances imply lots of cost and feasibility trade-offs as well. Advanced technologies, such as plasma pyrolysis or the introduction of blockchain systems are likely to have high capital costs and human resource requirements that may limit application in low-resource settings. However, when combined with sustainable procurement measures and trainings (C32), these technological measures are more realizable and scalable, supporting former results of necessity of technical and institutional measures integration10,13. Practical barriers persist budget limitations, legal voids, cognitive rigidity to name a few. At the same time, high book entry costs have shackled the development of eco-innovations, and the facility management is lack of standards owing to different management make their own rules. Add this to the fact that staff adherence to new waste segregation or digital tracking systems might be low without cultural and behavioral change. And how can CE initiatives overcome these obstacles? Economic incentives such as resource efficiency, lower disposal costs, heightened accountability through digital transparency and moves to more sustainable practices due to knowledge/institutional awareness are offered by CE initiatives. Training and policy nudging are indispensable to the institutionalizing sustainability into healthcare practices Dixit and Dutta13 reported similar findings.
The understanding that cause and results are not being driven the same way should also imply a case for trade-offs in priorities. For example, environmentally friendly healthcare products (C41) and health asset sharing (C42) are low-impact but orthogonal outputs. While these interventions can convey persuasive story of sustainability symbolism, they are heavily dependent on systemic enablers -sustainable procurement (C11) and managerial leadership (C4). This suggests the importance for policy makers to tread a fine line between ambitiously high-impact system level interventions and consumer facing responses, not over-betting on result drivers but under-investing in foundational enablers.
In summary, this study adds to the extant literature by providing a holistic picture of CE drivers and their connections in healthcare decarbonisation. Where previous work has focused on particular technologies11,12 or policy level targets17, the results in our work accentuate the need of sustainable development and management reform to guide both technology and behavioral change. Especially for developing countries, the discovered alternatives suggest an opportunity to invest in governance and institutional reform (C1 - C4), enable capacity building and sensitization (C32), and focus investments on high-performing technologies (C13, C23, C24). A such multi-level strategy could be employed to tackle the financial, regulatory and behavior challenges to employing CEs for health and holding the health sector accountable for delivering on climate mitigation and enabling of SDGs.
Weights of drivers
Sustainable development
C1 (Sustainable Development, weight = 0.3684) is found to be the most influential factor in promoting decarbonization of circular healthcare economies to demonstrate the systemic consistency of environmental goals and clinical management practices. Under this pillar sustainable procurement (C11, weight = 0.1078) lowers residual emission by favoring low-carbon materials, in line with the findings of Sawyer16 who concluded that green procurement of surgical apparatus reduced the supply chain emission with 35%. C12 (Investments in Innovative Setups, weight=0.1141) (C12, weight = 0.1141), such as AI data-driven waste tracking, showed a return rate of 25% in two years in recycling performance improvement21. C13 (Circular Design, weight = 0.1308) for reusable medical devices, reducing the lifecycle emissions up to 30%59. C14 (Sustainable medical supplies, weight = 0.1472), replaces single-use plastics with biodegradable alternatives, resulting in 40% less emissions in neonatal units60. To conclude, they are, altogether, a closed-loop system comprising C11 as a sustainable input, C12 as ICT–based efficiency, C13 as extended-life products, and C14 as waste at the end of use. This ordering corresponds to the priorities defined by the EC’s Green Deal (2023), grounded in systemic change over downstream fixing and upstream action compared to downstream patching61. However, scalability presents trade-offs. Although biodegradable supplies (C14) provide a significant reduction in emissions, their cost is currently unaffordable in low-resource settings and may conflict with priorities of cost-effectiveness and carbon reduction. C12 is also limited in the same way, since the expansion of digital technologies requires investment and expertise absent in many poor nations. Mitigating these barriers merits backing by tailor-made policy roadmaps, such as incentives for sustainable sourcing, integration of CE targets into healthcare regulations and the strengthening of local manufacturing capabilities to reduce reliance on imports. Such moves are not only conducive to global decarbonization but also contribute to achievement of the SDG targets, notably those under SDG3, SDG12, and SDG13. At a deeper level, their findings reinforce the importance of sustainability as an ethical imperative and leverage point, offering policymakers a more agile governance framework that can enable performance achievements in health systems to better contribute to planetary health.
Advanced technology adoption
C2 (Advanced Technology Adoption weight = 0.2776) represents the utilization of digital tools and break-through technologies in order to increase resource utilization and reduce emissions. Sub-initiatives C21 (Advanced Technology in Recycling and Sterilization, weight = 0.0628), recycling and sterilization technologies, and C22 (Monitor and tracking the waste matrices, weight = 0.0847) which were able to decrease 20% of mismanagement of medical waste62. These sub-initiatives are in turn aligned with the EU Circular Economy Action Plan (2023), advocating digitalizing waste streams63. C23 (Blockchain for traceability of medical waste, weight = 0.2113) introduces another level of transparency and a 25% reduction in fraud reporting71, possibly serving as a powerful tool for regulators to enforce compliance. Similarly, C24 (Decentralized medical waste treatment models by technology, weight = 0.2113) can decrease transportation emissions by 18%64, consistent with the advocacy of action UNEP (2023) that would aid distributed infrastructure development to create healthcare waste management resilience. C21 and C22 together result in operational transparency, while C23 and C24 lead to systemic decarbonization through decentralized energy provision and material usage. But trade-offs also come with IoT, blockchain and decentralized systems. These tools are so technically sophisticated, but you need to invest a lot of capital in them and you need the connectivity like which not found in many other emerging economies. This forms a feasibility gap between high-income and constrained circumstances of low resources. Hybrid analog/digital models with paper-based audits combined with IoT-based surveillance or mobile technologies enabling community-scale distributed systems may also be intermediate solutions. At the very least, systems of this new scale are technologically tense, suggesting that governance mechanism would be required to guarantee accountability and fairness an issue mostly overlooked in the literature on these systems such as for blockchains shortcomings of commercial origins and detect and clean approach may also create economic incentive challenges. Here, C2 is a pathway, not only for technological decarbonization, but also a policy blueprint aligning innovation with affordability, bake compliance into regulation, and incentivize South–South cooperation to share digital infrastructure. Such strategies contribute to several SDGs, most notably SDG 9, SDG 12, and SDG 13, and decarbonization of healthcare must be technologically resilient and socially inclusive.
Education and institutional practice
C3 (Education and Institutional Practice = 0.2132) induces the adoption of CE into healthcare through behavioral and systemic changes, leading mainly to decarbonization. Sub-initiatives tackle information gaps and institutional change to support gradual cultural metamorphosis. C31 (Training and Education of Medical staff, weight = 0.1556) enhances capability and decreases procedural waste by 15%65, compliant with WHO standards on competency-based training. C32 (Education and awareness in medical facilities, weight = 0.1203) involves stakeholders and increases recycling by 20% [74], for instance, gamifying initiatives in the UAE hospitals66. C33 (Increase the pharmaceutical resource efficiency, weight = 0.0890) as a way of optimizing resource use and by reducing expenditure at least by 25% through the use of equipment-sharing platforms as per the EU Circular Economy Action Plan67. C34 (Taking waste mitigation actions, weight = 0.1351), such as the extended producer responsibility (EPR) policies, require compliance and penalty for non-recyclable residual waste burden68. Cumulatively, the sub-initiatives illustrate C3’s dual role: C31 supports bottom-up compliance, C32 fosters top-down cultural assimilation, C33 improves operational efficiency, and C34 creates accountability. But there are practical barriers such as programs cannot be sustained with low levels of literacy and producers resist EPR models. Such challenges may need hybrid solutions, pairing tech-based training programs with community led advocacy to improve engagement and retention. By institutionalizing the circular practices, C3 helps convert passive compliance into stewardship and also underscores the interdependency between education and governance in fostering sustainability. This approach directly responds to SDG 12 and may offer a transferable for attempting to mainstream CE into health care. Importantly, the findings emphasize that capacity of institutions is not a tangential but a core enabler necessary to support the delivery of net-zero healthcare systems, with reference to the nexus between policy-making, professional practice and system-wide decarbonization.
Management development
C4 (Management Development = 0.1408) facilitating recovery and loaded efficiency, confirms the contribution to decarbonization of healthcare by integrating circular practices into institutional operation. Its sub-initiatives serve to optimize operations in the short term and the system in the long term. C41 (Eco-friendly medical products, weight = 0.1714) stimulates material innovation that complies with WHO requirements, with a 25% drop in emissions encouraged69. C42 (Optimizing healthcare asset sharing platforms among healthcare facilities, weight=0.1401) is utilization maximization, easing of over-capacity pressure, and a response to resilience of the EU Circular Economy Action Plan (2023) regarding both economic and operational resilience. C43 (Energy Recovery, weight = 0.1219) through waste-to-energy technologies can reduce emissions by 10–15%70. C44 (Regenerative Practices, weight=0.0666) can sequester carbon and improve ecological stewardship71. C41 and C42 have a short-term focus on operational enhancements, while C43 and C44 will provide longer-term, system-wide benefits. Yet existing practicalities restrict the implementation of regenerative systems, which require high initial costs, while non-uniform waste streams restrict energy recovery efficiency. However, C4 is essential for solidifying C1-C3 by grounding with institutional strength, which is critical to ensure that environmental initiatives are enacted successfully. Hybrid approaches that integrate asset-sharing (C42) and regenerative processes (C44) are likely choices offering more evolutionary solutions, trading short-term efficiency improvements against long-term ecological impact72. In conclusion, C4 demonstrates that management training is the key to realizing CE principles in healthcare and, thereby enabling health systems in particular those from under and emerging countries to move along the pathway towards being net zero capped. C4 combines operational, technological and environmental interventions for the advancement of SDG 12, SDG 13 and SDG 3 as model system of resilient, low-carbon healthcare.
Conclusion
This study systematically explored the CE approaches through the perspective of health care waste management and its impact on decarbonization and provided a well-organized framework for strategic decision making. In outcomes, C3 (Education and institutional actions) emerges as the representation that exerts the highest causal influence on these feedback interactions to drive changes associated with CE adoption. C1 (Sustainable Development) and C4 (Management Development) equally make important contributions towards the setup of institutional and policy foundation. C2 (Advanced Technology Adoption) is the second-ranked archetypes, capturing the importance of digitalized and decentralized solutions for resource efficiency and emission reduction. Therefore, the high inter-influence of cause-driving sub-initiatives. C13 (Design for upgrade/reuse), C23 (Blockchain for traceability of medical waste), C24 (Decentralized medical waste treatment models by technology), C31 (Training and Education of Medical staff), C32 (Education and awareness in medical facilities), C34 (Taking waste mitigation actions) and C43 (Energy Recovery) reinforced the indirect perceived strategy effectiveness through measures. Building on these findings, the study offers several policy suggestions for health systems particularly those from lower income countries, which include integrating CE principles in procurement and sustainability strategies, providing incentives to decentralized waste treatment and traceability technologies, investing in staff training programs/thematic awareness campaigns, and fostering managerial leadership of health institutions under a circular economy ethos. They can be part of the solution for achieving low-carbon healthcare and contribute to SDGs 3, 12 and 13. The study has limitations. Both DEMATEL and ANP approaches are intuitionist, which would bring subjectivity and are no generalizability of the results for other areas or healthcare system. Although these limitations, this study is a valuable addition to the CE literature as it makes an effort to develop a holistic, data-driven framework for incorporating policy, technology network level effects, and relationships between drivers of decarbonization efforts in healthcare systems alongside offering practical advice on how to implement multiple intervention options. It remains to be seen whether the methodology is validated in further work, calibrated through piloting in real-life cases and embedded in lifecycle assessment modelling, and used in various healthcare settings before it can be said that the developed framework is actually valid and applicable. This form part of the evidence for implementing CE as a strategic option for sustainable, low-carbon healthcare.
Data availability
Data is provided within the manuscript or supplementary information files.
References
Sukumaran, K. Impact of human activities inducing and triggering of natural disasters. In A System Engineering Approach to Disaster Resilience: Select Proceedings of VCDRR 2021 17–31 (Springer, 2022).
Teymourian, T. et al. Challenges, strategies, and recommendations for the huge surge in plastic and medical waste during the global COVID-19 pandemic with circular economy approach. Mater. Circular Econ. 3, 1–14 (2021).
Bozoudis, V., Sebos, I. & Tsakanikas, A. Action plan for the mitigation of greenhouse gas emissions in the hospital-based Health Care of the Hellenic Army. Environ. Monitor. Assess. 194, 221 (2022).
Kandpal, V. et al. Circular Economy Principles: Shifting Towards Sustainable prosperity, in Sustainable Energy Transition: Circular Economy and Sustainable Financing for environmental, Social and Governance (ESG) Practices 125–165 (Springer, 2024).
Sanyal, T., Rakshit, I. & Bhattacharjee, P. Green healthcare: initiatives and adaptations for sustainable future. Env. Dev. Sustain. 2024, 1–28 (2024).
Sharma, S. & Bangur, P. Circling to wellness: health implications of transitioning to a circular economy. Circ. Econ. Sustain. 2025, 1–30 (2025).
Wright, C. Y. et al. Circular economy and environmental health in low-and middle-income countries. Globaliz. Health. 15, 1–5 (2019).
Shaw, E. et al. AMEE consensus statement: planetary health and education for sustainable healthcare. Med. Teach. 43 (3), 272–286 (2021).
Kurniawan, T. A. et al. Unlocking synergies between waste management and climate change mitigation to accelerate decarbonization through circular-economy digitalization in Indonesia. Sustain. Prod. Consum. 46, 522–542 (2024).
Alfina, K. N. et al. Prioritizing performance indicators for the circular economy transition in healthcare supply chains. Circ. Econ. Sustain. 2024, 1–46 (2024).
Shafik, W. IoT-Enabled Model and Waste Management Technologies for Sustainable Agriculture, in IoT-Based Models for Sustainable Environmental Management: Sustainable Environmental Management 137–163 (Springer, 2024).
Geetha, K. et al. Sustainable Solutions for Global Waste Challenges: Integrating Technology in Disposal and Treatment Methods, in Handbook of Technological Sustainability 46–56 (CRC, 2024).
Dixit, A. & Dutta, P. Critical success factors for the adoption of circular economy in sustainable healthcare waste management. Clean Technol. Environ. Policy. 26 (7), 2181–2201 (2024).
Dion, H., Evans, M. & Farrell, P. Hospitals management transformative initiatives; towards energy efficiency and environmental sustainability in healthcare facilities. J. Eng. Des. Technol. 21 (2), 552–584 (2023).
Matos, J. et al. Comparative analysis of micro level indicators for evaluating the progress towards a circular economy. Sustain. Prod. Consum. 39, 521–533 (2023).
Sawyer, M. Procurement of Goods and services, in Environmentally Sustainable Primary Care 175–191 (CRC, 2024).
Ibn-Mohammed, T. et al. A critical analysis of the impacts of COVID-19 on the global economy and ecosystems and opportunities for circular economy strategies. Resourc. Conserv. Recycl. 164, 105169 (2021).
Peeriga, R. & Manubolu, K. Design strategies for waste reduction and enhanced recyclability in pharmaceutical packaging. In Sustainable Pharmaceutical Product Development and Optimization Processes: from Eco-Design To Supply Chain Integrity 179–228 (Springer, 2025).
Chew, X. et al. Circular economy of medical waste: novel intelligent medical waste management framework based on extension linear Diophantine fuzzy FDOSM and neural network approach. Environ. Sci. Pollut. Res. 30 (21), 60473–60499 (2023).
Ravindra, K. et al. Emerging green technologies for Bio-medical waste treatment and management: a systematic approach. Water Air Soil Pollut. 235 (10), 635 (2024).
Lakhouit, A. Revolutionizing urban solid waste management with AI and iot: a review of smart solutions for waste collection, sorting, and recycling. Results Eng. 2025, 104018 (2025).
Boçe, M. T. & Hoxha, J. Blockchain technology as a catalyst for sustainable development: exploring economic, social, and environmental synergies. Acad. J. Interdiscipl. Stud. 13, 2 (2024).
Sharma, M. et al. Decentralized systems for the treatment of antimicrobial compounds released from hospital aquatic wastes. Sci. Total Environ. 840, 156569 (2022).
Barua, U. & Hossain, D. A review of the medical waste management system at Covid-19 situation in Bangladesh. J. Mater. Cycles Waste Manage. 23 (6), 2087–2100 (2021).
Taylor, A. L. et al. Improving environmental sustainability in outpatient clinics: lessons from a waste audit. J. Clim. Change Health. 4, 100070 (2021).
Rizan, C., Reed, M. & Bhutta, M. F. Environmental impact of personal protective equipment distributed for use by health and social care services in England in the first six months of the COVID-19 pandemic. J. R. Soc. Med. 114 (5), 250–263 (2021).
Ranjbari, M. et al. Mapping healthcare waste management research: past evolution, current challenges, and future perspectives towards a circular economy transition. J. Hazard. Mater. 422, 126724 (2022).
Sapkota, B. & Pariatamby, A. Pharmaceutical waste management system–are the current techniques sustainable, eco-friendly and circular? A review. Waste Manage. 168, 83–97 (2023).
Camilleri, M. A. Cocreating value through open circular innovation strategies: a results‐driven work plan and future research avenues. Business Strategy Env. (2025).
Sha, M. et al. Introduction to innovative technologies for waste-to-energy conversion using automation and machine learning. In Harnessing Automation and Machine Learning for Resource Recovery and Value Creation 1–27 (Elsevier, 2025).
Hoveling, T. et al. Circular economy for medical devices: barriers, opportunities and best practices from a design perspective. Resour. Conserv. Recycl. 208, p107719 (2024).
Karuppiah, K., Sankaranarayanan, B. & Lo, H. W. A systematic literature review on the evolution of sustainable manufacturing practices: key findings and implications. Clean. Eng. Technol. 22, 100798 (2024).
Bhalaji, R. et al. A decision support model for evaluating risks in a collaborative supply chain of the medical equipment manufacturing industry. In Supply Chain Forum: An International Journal (Taylor & Francis, 2022).
Eckelman, M. J. & Sherman, J. D. Estimated global disease burden from US health care sector greenhouse gas emissions. Am. J. Public Health. 108 (S2), S120–S122 (2018).
Karliner, J. et al. Health care’s climate footprint: the health sector contribution and opportunities for action. Eur. J. Pub. Health. 30 (Supplement_5), ckaa165 (2020).
Das, S. K. et al. Challenges and potential solutions for 100% recycling of medical textiles. Mater. Circular Econ. 3 (1), 13 (2021).
Fuller, R. et al. Pollution and health: a progress update. Lancet Planet. Health. 6 (6), e535–e547 (2022).
Kanyal, D., Butola, L. K. & Ambad, R. Biomedical waste management in India-a review. Indian J. Forensic Med. Toxicol. 15 (2), 108–113 (2021).
Neves, A. C. et al. Analysis of healthcare waste management in hospitals of Belo Horizonte, Brazil. Environ. Sci. Pollut. Res. 29 (60), 90601–90614 (2022).
Dehdasht, G. et al. DEMATEL-ANP risk assessment in oil and gas construction projects. Sustainability 9 (8), 1420 (2017).
Rad, T. G. et al. A methodological framework for assessment of ubiquitous cities using ANP and DEMATEL methods. Sustain. Cities Soc. 37, 608–618 (2018).
Edalatpanah, S. et al. Prioritizing critical success factors for wind turbine suppliers: a neutrosophic hybrid DEMATEL and ANP approach. Int. J. Environ. Sci. Technol. 2025, 1–25 (2025).
Liou, J. J. Building an effective system for carbon reduction management. J. Clean. Prod. 103, 353–361 (2015).
Liou, J. J., Chuang, Y. C. & Tzeng, G. H. A fuzzy integral-based model for supplier evaluation and improvement. Inf. Sci. 266, 199–217 (2014).
Osintsev, N., Rakhmangulov, A. & Baginova, V. Evaluation of logistic flows in green supply chains based on the combined DEMATEL-ANP method. Facta Universitatis Ser.: Mech. Eng. 19 (3), 473–498 (2021).
Khan, M. I. et al. Modeling the big data challenges in context of smart cities–an integrated fuzzy ISM-DEMATEL approach. Int. J. Building Pathol. Adapt. 41 (2), 422–453 (2023).
Liu, X. et al. Analyzing the drivers of the low-carbon construction supply chain based on an integrated DEMATEL–ANP approach. Eng. Constr. Architect. Manage. (2024).
Salehi, R. et al. The information technology barriers in supply chain of sugarcane in Khuzestan province, iran: A combined ANP-DEMATEL approach. Inform. Process. Agric. 8 (3), 458–468 (2021).
Quezada, L. E. et al. An ANP model to generate performance indicators for manufacturing firms under a balanced scorecard approach. Eng. Manage. J. 34 (1), 70–84 (2022).
Wang, Z. & Sun, C. Newly applied practices to alleviate design uncertainty: a case study of a design scheme based on the DEMATEL–ANP–VIKOR theory. Int. J. Interact. Des. Manuf. (IJIDeM). 18 (9), 6859–6873 (2024).
Mavi, R. K. & Standing, C. Critical success factors of sustainable project management in construction: A fuzzy DEMATEL-ANP approach. J. Clean. Prod. 194, 751–765 (2018).
Karuppiah, K., Sankaranarayanan, B. & Ali, S. M. A fuzzy ANP–DEMATEL model on faulty behavior risks: implications for improving safety in the workplace. Int. J. Occup. Saf. Ergon. 28 (2), 923–940 (2022).
Kazemian, I. et al. A multi-attribute supply chain network resilience assessment framework based on SNA-inspired indicators. Oper. Res. Int. J. 22 (3), 1853–1883 (2022).
Lan, S. & Zhong, R. Y. An evaluation model for financial reporting supply chain using DEMATEL-ANP. Procedia Cirp. 56, 516–519 (2016).
Alghawli, A. S. A., Nasser, A. A. & Aljober, M. N. A fuzzy MCDM approach for structured comparison of the health literacy level of hospitals. Int. J. Adv. Comput. Sci. Appl. 12, 7 (2021).
Mumtaz, A. Prioritizing and overcoming barriers to e-Health use among elderly people: implementation of the analytical hierarchical process (AHP). J. Healthc. Eng. 2022 (1), 7852806 (2022).
Kaloutsa, M., Kabassi, K. & Martinis, A. Evaluating the sustainable development goals in higher education institutions using multi-criteria decision making/analysis: calculating the weights of criteria with the analytic hierarchy process. Sustain. Sci. Pract. Policy 21 (1), 2475592 (2025).
Nazari-Shirkouhi, S. & Babaarabi, R. Z. Enhancing Decision-Making in healthcare systems: Lean, Agile, Resilient, Green, and sustainable (LARGS) paradigm for performance evaluation of hospital departments under uncertainty. Ind. Manage. J. 17 (2), 116–185 (2025).
Schilperoord, J. Designing Circular Strategies for the Next-Generation of Insufflation (Springer, 2025).
Leissner, S. & Ryan-Fogarty, Y. Challenges and opportunities for reduction of single use plastics in healthcare: a case study of single use infant formula bottles in two Irish maternity hospitals. Resourc. Conserv. Recycl. 151, 104462 (2019).
Jayalath, M., Jayarathne, P. A. & Najeeb, A. Environmental Policies: Institutional Response To Smart Eco-Systematic Realities, in Climate Neutrality Through Smart Eco-Innovation and Environmental Sustainability 193–208 (Springer, 2025).
Wang, C. et al. A smart municipal waste management system based on deep-learning and internet of things. Waste Manage. 135, 20–29 (2021).
De Pascale, A. et al. The circular economy implementation at the European union level. Past, present and future. J. Clean. Prod. 423, 138658 (2023).
Kurniawan, T. A. et al. Decarbonization in waste recycling industry using digitalization to promote net-zero emissions and its implications on sustainability. J. Environ. Manage. 338, 117765 (2023).
Abdulla, F., Qdais, H. A. & Rabi, A. Site investigation on medical waste management practices in Northern Jordan. Waste Manage. 28 (2), 450–458 (2008).
AlNuaimi, A. Y. Open innovation in the public sector: a case study empowerment and education projects in health services across the public sector of the United Arab Emirates (2024).
Němá, O. The analysis of the Russian environmental cooperation with the Arctic Council member states (2020).
Guenter, M. T., Murguia, D. & Wertich, V. Report on relevant business and policy issues for Europe pertinent to CRMs. (2025).
Maxwell, J. & Blashki, G. Teaching about climate change in medical education: an opportunity. J. Public. Health Res. 5(1), jphr. 2016.673 (2016).
Manegdeg, R. F. et al. Waste-to-energy technology suitability assessment for the treatment and disposal of medical, industrial, and electronic residual wastes in metropolitan manila, Philippines. In Energy Sustainability, American Society of Mechanical Engineers (2021).
Buckley, S. et al. Carbon, indoor air, energy and financial benefits of coupled ventilation upgrade and enhanced rooftop garden installation: an interdisciplinary climate mitigation approach. Sustain. Cities Soc. 97, 104792 (2023).
Čegar, S., Drezgić, S. & Čišić, D. Exploring the regenerative economy: a comprehensive review of literature. Niš 2024, 1–40 (2024).
Acknowledgements
Princess Nourah bint Abdulrahman University Researchers Supporting Project number (PNURSP2025R754), Princess Nourah bint Abdulrahman University, Riyadh, Saudi Arabia.
Funding
There is no funding available.
Author information
Authors and Affiliations
Contributions
MI: Formal Analysis, writing – review and editing, Writing – original draft, Project administration, Conceptualization. ZX: Writing – review and editing, Conceptualization, Supervision, Resources, AW: Writing – review and editing, writing – original draft, Investigation, Conceptualization, Methodology, SM: Writing – review and editing, writing – original draft, Data curation, Software, EL-S: Writing – review and editing, Conceptualization, Visualization, Validation. AAH: Writing – review and editing, Conceptualization, Visualization, Software. ME: Writing – original draft, Conceptualization, Validation. DK: Writing – original draft, Software, Investigation,
Corresponding authors
Ethics declarations
Competing interests
The authors declare no competing interests.
Ethics approval
To ensure adherence to ethical principles, we obtained official written approval from the Research Ethics Committee of the School of Business at Xian International University.
Informed consent
Informed consent was obtained from all individual participants included in the study.
Additional information
Publisher’s note
Springer Nature remains neutral with regard to jurisdictional claims in published maps and institutional affiliations.
Supplementary Information
Below is the link to the electronic supplementary material.
Rights and permissions
Open Access This article is licensed under a Creative Commons Attribution-NonCommercial-NoDerivatives 4.0 International License, which permits any non-commercial use, sharing, distribution and reproduction in any medium or format, as long as you give appropriate credit to the original author(s) and the source, provide a link to the Creative Commons licence, and indicate if you modified the licensed material. You do not have permission under this licence to share adapted material derived from this article or parts of it. The images or other third party material in this article are included in the article’s Creative Commons licence, unless indicated otherwise in a credit line to the material. If material is not included in the article’s Creative Commons licence and your intended use is not permitted by statutory regulation or exceeds the permitted use, you will need to obtain permission directly from the copyright holder. To view a copy of this licence, visit http://creativecommons.org/licenses/by-nc-nd/4.0/.
About this article

Cite this article
Ismail, M., Zhongdong, X., Waheed, A. et al. Decarbonization pathways in medical waste management through circular economy strategies to advance UN-SDGs. Sci Rep 15, 42499 (2025). https://doi.org/10.1038/s41598-025-26635-4
Received:
Accepted:
Published:
Version of record:
DOI: https://doi.org/10.1038/s41598-025-26635-4
