
Abstract
Machine learning (ML) risk prediction models for post-stroke cognitive impairment (PSCI) are still far from optimal. This study aims to generate a reliable predictive model for predicting PSCI in Chinese individuals using ML algorithms. We collected data on 494 individuals who were diagnosed with acute ischemic stroke (AIS) and hospitalized for this condition from January 2022 to November 2023 at a Chinese medical institution. We assessed cognitive function of patients recently diagnosed with a stroke (in the preceding 3–6 months), PSCI was determined from MMSE or MOCA scores. All of the observed samples were divided into a training set (70%) and a validation set (30%) at random. The least absolute shrinkage and selection operator (LASSO) penalty and logistic regression (LR) can help filter the best predictive features for PSCI from 49 common clinical parameters collected on admission. We utilized seven different ML models, including LR, Extreme Gradient Boosting (XGBoost), Light Gradient Boosting Machine (LightGBM), Adaptive Boosting (AdaBoost), Gaussian naive bayes (GNB), Multilayer Perceptron (MLP), Support Vector Machine (SVM), and compared their performance for the resulting variables. We used tenfold cross-validation to measure the model’s AUROC (Area under the receiver operating characteristic), sensitivity, specificity, accuracy, F1 score and AP (Average precision) values. SHAP (Shapley additive exPlanations) analysis provides a comprehensive and detailed explanation of our optimized model’s performance. PSCI was identified in 58.50% of the 494 eligible AIS patients. Age, National institutes of health stroke scale (NIHSS), Hamilton depression scale (HAMD)-24, Pittsburgh sleep quality index (PSQI), ALB, FBG, hypertension, paraventricular lesion, and number of lesions were significant influencing features of PSCI. The AUROC of the XGBoost model is 0.980, which is better than the prediction performance of the other models (LR: 0.808, LightGBM: 0.800, AdaBoost: 0.893, GNB: 0.789, MLP: 0.745, and SVM: 0.868). The XGBoost model, leveraging predictors including age, NIHSS, HAMD-24, PSQI, ALB, FBG, hypertension, paraventricular lesion, and number of lesions, effectively predicts mild to moderate cognitive impairment 3–6 months post-stroke. This tool enables early identification of at-risk patients, facilitating timely clinical interventions.
Introduction
Post-stroke cognitive impairment (PSCI) is a widespread complication of stroke, affecting between 20 and 75% of survivors and significantly impacting their functional independence1,2,3. Previous research has shown that the risk of developing cognitive impairment after stroke is between 3.5 and 5.6 times greater than in healthy individuals4. While some cases of cognitive impairment are reversible early after a stroke, as many as one-third of individuals with stroke will develop dementia within 5 years5. Meanwhile, PSCI is likely to worsen the health outcomes and living conditions of post-stroke patients6, leading to increased mortality rates and the severe impact on the quality of life of these patients, which should not be underestimated7. PSCI can cause individuals to experience significant quality-of-life stress and require ongoing support, leading to profound effects on families and society8. Thus, effective management strategies are needed to address the high incidence of PSCI, with prevention strategies being particularly appealing, particularly those that focus on modifiable risk factors.
While the Montreal Cognitive Assessment (MoCA) possesses high sensitivity in detecting early PSCI and is considered a reliable indicator for predicting PSCI 6–9 months after stroke9, the pathophysiology and risk factors of PSCI are intricate and multifaceted, indicating that the traditional scoring model inclusive of MoCA possesses limited predictive power and thus, poses difficulty in timely and accurate identification of PSCI risk. Machine learning (ML) has its unique advantages in enhancing predictive model performance and improving generalization ability, presenting a novel approach for modeling predictive disease risk events. In recent years, several studies have been conducted using various ML prediction models to assess the risk of PSCI, taking into consideration various populations and predictive features10,11,12. Furthermore, a recent systematic review and meta-analysis further supports the use of ML as a potential predictive tool for PSCI13.
Despite the promising results, the evidence for building ML risk prediction models for PSCI using simple and easily available clinical data remains limited. Diagnosis of PSCI is optimally conducted 3–6 months following an acute ischemic stroke (AIS), a period during which partial neurological recovery may occur8. Therefore, this study aims to develop and evaluate the applicability of ML models in PSCI prediction based on a 3–6 month AIS patient population, and to find the optimal predictors for PSCI risk prediction.
Methods
Study design and population
This research received the approval of the ethical review body of the First affiliated Hospital of Shandong University of Chinese Medicine in accordance with the Declaration of Helsinki, and the participant’s informed consent was obtained. The inclusion criteria for this study were patients aged 30–80 years with AIS who were continuously hospitalized within 7 days of symptom onset between January 2022 and November 2023. The management and evaluation of all observed samples were in accordance with institutional stroke protocols and relevant guidelines. According to the 2018 Chinese Guidelines for the Diagnosis and Treatment of AIS14, the diagnostic criteria for AIS were established as follows: (1) acute onset; (2) focal neurological deficits (e.g., unilateral weakness or numbness of the face or limbs, speech disturbances), with a minority presenting as comprehensive neurological impairment; (3) imaging evidence of responsible lesions or symptoms/signs persisting for more than 24 h; (4) exclusion of non-vascular causes; and (5) confirmation of the absence of cerebral hemorrhage via cerebral CT or MRI. The primary outcome event was defined as the development of post-stroke cognitive impairment (PSCI) within 3–6 months following stroke onset. Cognitive function was assessed in patients diagnosed with stroke within the preceding 3–6 months. PSCI was determined based on the following thresholds: MMSE scores of ≤ 17 points (illiterate individuals), ≤ 20 points (primary school education level), or ≤ 24 points (secondary school education level and above), or MoCA scores of ≤ 26 points7,15. In addition, patients were excluded from the study if they had the following characteristics: (1) a previous diagnosis of cognitive impairment; (2) a history of psychotropic drug dependence and other drug abuse; (3) severe visual, auditory, language and consciousness disorders can not cooperate well with the investigation; (4) patients who quit during the interview. After applying stringent inclusion and exclusion criteria, we enrolled a total of 526 patients diagnosed with AIS. After eliminating 7 samples with data loss, 12 samples with abnormal inspection data due to transient findings or confounding bias during the examination process that may alter the distribution of data, and 13 samples with severe cognitive impairment (MMSE score or MOCA score < 18 scores)16, we ultimately included 494 samples for model development in this study.
Sample size calculation
According to previous reports, the prevalence of PSCI 6 months after AIS in China was 34.2%9. Using α = 0.05, β = 0.10, δ = 0.05, Zβ = 1.282, Zα = 1.960, and n = [(Zβ + Zα)/δ]2 × π0 × (1−π0). The required minimum sample size was determined to be 346 patients based on the estimation formula. Given that several patients were lost to follow-up or dropped out of the study, the final count of patients included was 494.
Screening of variables
We collected a total of 49 parameters of general information (n = 11), imaging parameters (n = 15) and laboratory indicators (n = 16), medication information (n = 3) and relevant scale indicators (n = 4) on admission. Specifically, data on general information, including gender, age, educational levels, marital status, type of work, smoking, drinking, hypertension, coronary heart disease (CHD), diabetes, and hyperlipidemia. Data on imaging test indicators, including frontal lobe lesion, parietal lobe lesion, occipital lobe lesion, temporal lobe lesion, basal ganglia lesion, paraventricular lesion, brain lesion, cerebellar lesion, thalamic lesion, pontine lesion, brain stem lesion, radiative crown lesion, hemioval central lesion, number of lesions, and focal side. Data on laboratory indicators, including white blood cell count (WBC), absolute neutrophil count (ANC), red blood cell count (RBC), red cell distribution width (RDW), alanine transaminase (ALT), aspartate transaminase (AST), albumin (ALB), serum creatinine (SCr), serum uric acid (SUA), fasting blood glucose (FBG), triglycerides (TG), total cholesterol (TC), high-density lipoprotein cholesterol (HDL-C), low-density lipoprotein cholesterol (LDL-C), apolipoprotein A1 (APOA1), apolipoprotein B (APOB). Data on scale indicators, including NIHSS, PSQI, Hamilton depression scale (HAMD) − 24, and Barthel. Data on medication information, including antihypertensive drugs, lipid-lowering drugs, and hypoglycemic drugs. In this study, key variables for the development and validation of predictive ML models for PSCI were identified through a rigorous two-step feature selection process. First, variables were selected based on the Least Absolute Shrinkage and Selection Operator (LASSO) penalty with tenfold cross-validation. The optimal regularization parameter λ was determined via grid search across the range λ ∈ [0.001, 0.01, 0.1, 1, 10], with the final value chosen based on the minimum cross-validation error. This approach ensured the selection of the most relevant predictors while minimizing overfitting. Subsequently, the influences of these variables on PSCI were further evaluated using univariate and multivariate logistic regression (LR) models to confirm their statistical significance and clinical relevance. Through this combined approach, nine key variables were ultimately identified and included as predictors for the development of the predictive models. This feature selection methodology, integrating LASSO regularization with logistic regression analysis, ensures robustness and interpretability of the selected predictors, aligning with best practices in predictive modeling.
ML model development and interpretability for PSCI
Figure 1 illustrates the model development process. To create a balanced dataset, all observed samples were randomly partitioned into 70% for training and 30% for validation, maintaining the 7:3 ratio. We employed tenfold cross-validation for model selection and hyperparameter tuning, as this approach reduces the risk of model overfitting on a specific subset of data. To comprehensively evaluate the predictive performance of post-stroke cognitive impairment (PSCI), seven ML algorithms were implemented with parameter configurations optimized through grid search and tenfold cross-validation. The specific hyperparameters for each model are detailed as follows: ① Extreme Gradient Boosting (XGBoost) Classifier: L2 regularization coefficient (reg_lambda): 0.5, Minimum child weight threshold for splitting (min_child_weight): 2, Maximum tree depth (max_depth): 4, Learning rate (learning_rate): 0.3; ② LR: Convergence tolerance (tol): 0.0001, Regularization type (penalty): L2 norm, Regularization strength (C): 0.01, Maximum iterations (max_iter): 100; ③ Light Gradient Boosting Machine (LightGBM): Number of leaves per tree (num_leaves): 100, Maximum tree depth (max_depth): 20, Number of boosting rounds (n_estimators): 5, Learning rate (learning_rate): 2.0; ④ Adaptive Boosting (AdaBoost): Number of weak learners (n_estimators): 50, Learning rate shrinkage (learning_rate): 0.3; ⑤ Gaussian Naive Bayes (GNB): Variance smoothing factor (var_smoothing): 1e−7; ⑥ Multilayer Perceptron (MLP): Hidden layer dimensions (hidden_layer_sizes): (30, 30), Activation function (activation): Logistic sigmoid, Maximum training iterations (max_iter): 10; ⑦ Support Vector Machine (SVM): Convergence tolerance (tol): 0.001, Kernel: rbf, Penalty parameter (C): 1.0. The definition of the best predictive model was based on multiple evaluation metrics. For each model, the Area Under the Receiver Operating Characteristic Curve (AUROC) was computed using tenfold cross-validation. A higher AUROC value signifies better discriminatory ability, where values closer to 1 indicate superior performance in distinguishing PSCI patients from non-PSCI ones. In addition to AUROC, other metrics such as sensitivity, specificity, accuracy, F1 score, and Average Precision (AP) were also considered. The model that demonstrated consistently good performance across all these metrics was regarded as the most predictive. To better understand the performance of the optimized XGBoost model, we conducted the SHAP (Shapley additive exPlanations) analysis. SHAP comprehensively explains how each feature contributes to the model’s prediction, quantifying the impact of each on the predicted PSCI probability for an individual patient. The analysis reveals the significant contribution of predictive features. Moreover, feature contributions vary among patients, reflecting the individual variability in PSCI risk factors.
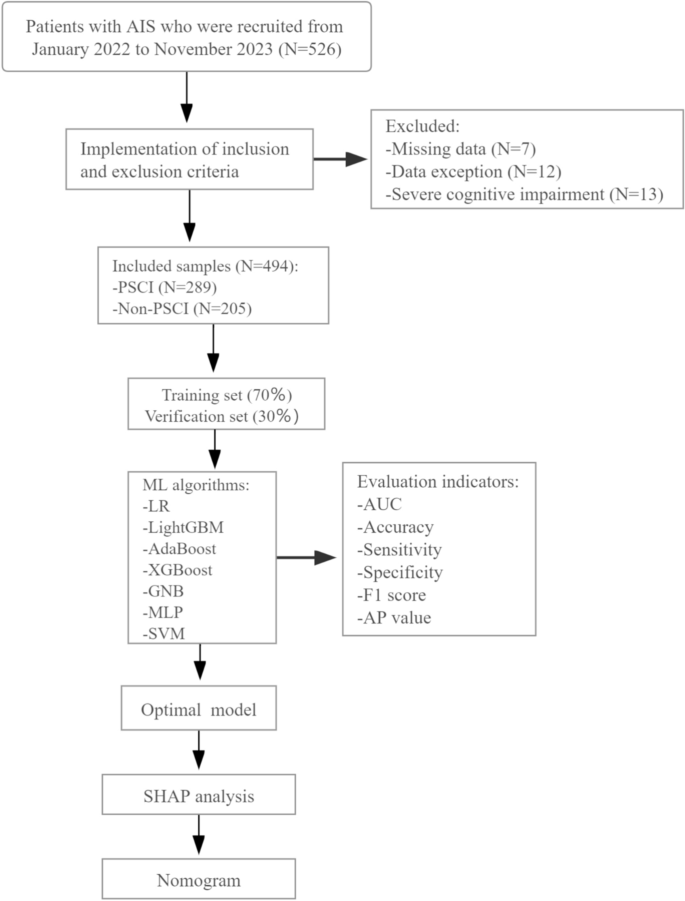
Process of study enrollment and model development. Abbreviations: PSCI: post-stroke cognitive impairment; LR: Logistic Regression, XGBoost: Extreme Gradient Boosting, LightGBM: Light Gradient Boosting Machine, AdaBoost: Adaptive Boosting, GNB: Gaussian Naive Bayes, MLP: Multilayer Perceptron, SVM: Support Vector Machine; AUC: Area under the curve; AP:Average precision; SHAP: Shapley Additive EXPlanations.
Statistical calculation
In this study, we used Python 3.7 and R 3.6.3 for all statistical analyses and visualizations. Normal distributed continuous data were represented by the mean ± standard deviation (SD), and compared using the Students’ t-test. Non-normal continuous data were expressed as the median [IQR], and compared using the Mann–Whitney U test. Categorical data were measured as frequency or percentage and compared using the Chi-square or Fisher’s exact test. All continuous variables were standardized to have a mean of zero and a standard deviation of one to ensure comparability across features and to facilitate the regularization process. We used LASSO penalty and LR models to simplify the number of variables modelled. In the LASSO penalty model, the tenfold cross-validation method was used to obtain LASSO penalty coefficients and cross-validation curves, and the corresponding modelling variables were screened out by setting the minimum distance standard error λ. In the LR model, univariate and multivariate LR analyses were conducted to screen for significant influencing factors of PSCI. The adjusted covariates included marital status, smoking status, diabetes, frontal lobe lesion, parietal lobe lesion, temporal lobe lesion, WBC, ALT, APOA1, and Barthel Index. In addition, to address the issue of multiple testing and control the risk of false positives, we applied False Discovery Rate (FDR) correction to all statistical tests. Specifically, we used the Benjamini–Hochberg procedure to adjust the P-values in both univariate and multivariate analyses. The FDR threshold was set at P < 0.05 to ensure that the false discovery rate was controlled at 5%. The corrected P-values (denoted as “P-value_FDR”) were explicitly reported in the Results section and tables, alongside the uncorrected P-values, to allow readers to comprehensively evaluate the significance of the findings. Seven ML algorithms including LR, XGBoost, LightGBM, AdaBoost, GNB, MLP, and SVM were used to develop a predictive model for PSCI, and the model was rigorously verified internally by Bootstrapping validation method. Decision curve analysis (DCA) was conducted to ascertain the net benefits at each threshold probability. SHAP analysis and nomogram provide a visual and interpretable approach for determining the optimal ML model of PSCI. Statistical significance was considered to be significant at the 0.05 level, and all tests were conducted using a two-tailed analysis.
Results
Baseline comparator
As shown in Table 1, a total of 494 AIS patients (aged 63.75 ± 9.35 years, 61.34% male) were included in this study, including 289 patients with PSCI (aged 65.38 ± 8.75 years, 59.86% male) and 205 patients with non-PSCI (aged 61.45 ± 9.68 years, 63.42% male) . Current results showed differences in age, marital status, smoking, hypertension, diabetes, frontal lobe lesion, parietal lobe lesion, temporal lobe lesion, paraventricular lesion, thalamic lesion, number of lesions, WBC, ALT, ALB, FBG, APOA1, NIHSS score, PSQI score, HAMD-24 score, Barthel, and lipid-lowering drugs between the two groups (P < 0.05).
Screening for key predictor variables in LASSO penalty and LR models
As shown in Fig. 2, we constructed the LASSO penalized model to perform dimensionality reduction on 21 significantly different predictor variables listed in Table 1. The results show that when the λ of the standard error of the minimum distance was set to 0.034, the variables selected for the corresponding model were: hypertension, parietal lobe lesion, temporal lobe lesion, paraventricular lesion, thalamic lesion, number of lesions, age, ALB, FBG, NIHSS, PSQI, HAMD-24, and lipid-lowering drugs. Further univariate and multivariate LR analyses revealed that age (OR 1.588, 95% CI 1.297–1.944), NIHSS (OR 1.753, 95% CI 1.305–2.355), HAMD-24 (OR 3.019, 95% CI 2.237–4.075), PSQI (OR 1.899, 95% CI 1.528–2.360), ALB (OR 0.665, 95% CI 0.533–0.830), FBG (OR 1.362, 95% CI 1.046–1.774), hypertension (OR 1.815, 95% CI 0.169–2.817), paraventricular lesion (OR 3.766, 95% CI 1.572–9.022), and number of lesions (OR 2.067, 95% CI 1.290–3.311) remained significantly associated with PSCI (all P < 0.05). After applying the Benjamini–Hochberg procedure to control the FDR, the these variables retained statistical significance (P < 0.05) (Table 2).

LASSO penalty model with tenfold cross-validation. (A) Coefficient profiles for the LASSO penalty; (B) LASSO penalty cross-validation curve. Abbreviations: LASSO: The least absolute shrinkage and selection operator.
Results of ML models development and validation
Figure 3 and Table 3 show the development and validation of different ML models. Results based on the training set data indicate that XGBoost model had the best performance, with the AUROC of 0.980 (0.973–0.988) (Fig. 3A), the sensitivity of 0.942(0.904–0.979) (Table 3), the specificity of 0.954(0.925–0.983) (Table 3), the accuracy of 0.947(0.914–0.979) (Table 3), the F1 score of 0.951 (0.932–0.970) (Table 3), and the AP value of 0.987 95%CI (0.976–0.997) (Fig. 3C). Moreover, results based on the validation set data also show that XGBoost model had the excellent performance, with the AUROC of 0.887 (0.794–0.978) (Fig. 3B), the sensitivity of 0.848(0.807–0.888) (Table 3), the specificity of 0.806(0.750–0.862) (Table 3), the accuracy of 0.830(0.798–0.863) (Table 3), the F1 score of 0.853(0.824–0.883) (Table 3), and the AP value of 0.910 (0.871–0.948) (Fig. 3D).

Performance of different ML models for PSCI. (A) ROC curve of training set data; (B) ROC curve of validation set data. (C) PR curve of training set data; (D) PR curve of validation set data; (E) DCA curve plot; (F) Calibration curve plot. Abbreviations: ROC: Receiver operating characteristic; AUC: Area under the curve; LR: Logistic Regression, XGBoost: Extreme Gradient Boosting, LightGBM: Light Gradient Boosting Machine, AdaBoost: Adaptive Boosting, GNB: Gaussian Naive Bayes, MLP: Multilayer Perceptron, SVM: Support Vector Machine; PR: Precision recall; AP: Average precision; DCA: Decision curve analysis.
Multiple testing correction and evaluation of seven ML models for PSCI
As shown in Fig. 3, we evaluated the clinical applicability of seven ML models by using DCA curves, and the results showed that within a certain threshold range, the net benefit rate value of the XGBoost model was higher, suggesting a higher clinical applicability of the XGBoost model. In addition, we also performed correction of multiple comparisons of the seven ML models. The results showed that the XGBoost model had a good degree of calibration (P > 0.05), indicating that the predicted probability of PSCI was positively correlated with the actual probability of PSCI.
Visualization of the XGBoost model for PSCI
Figure 4 presents a comprehensive nomogram developed for predicting PSCI, incorporating nine significant predictors: age, NIHSS score, HAMD-24 score, PSQI score, ALB, FBG, hypertension, paraventricular lesions, and the number of lesions. This nomogram provides a user-friendly and clinically applicable tool for estimating the probability of PSCI based on these key variables. In the nomogram model, a score is assigned to each variable predictor, and then the score of each predictor is added together to obtain the total score of the patient, which can correspond to the risk value of PSCI. Most individuals in the study had a risk total points of PSCI ranging from 0 to 240. Through the application of the nomogram, the individualized risk of mild to moderate cognitive impairment can be accurately estimated for each patient with AIS during the critical 3–6 month post-stroke period.

Nomogram of the predictive model for PSCI. Abbreviations: NIHSS: National institutes of health stroke scale; HAMD-24: Hamilton depression Scale-24; PSQI: Pittsburgh sleep quality index; ALB: Albumin; FBG: Fasting blood glucose.
SHAP analysis for model interpretation
As shown in Fig. 5, we used SHAP values of XGBoost to determine the feature importance for predicting PSCI. The X-axis shows the SHAP value of the feature, which can reflect the influence of the feature on the model, and is displayed in different colors, where red represents the high risk value and blue represents the low risk value. Y-axis shows the feature value, which can reflect the predictive value of each predictor to the model. Results indicate that the risk of PSCI can be significantly associated with the following predictors: HAMD-24 emerged as the most notable positive predictor (colored in red), followed by ALB, FBG, PSQI, age, NIHSS, number of lesions, paraventricular lesion, and hypertension. The SHAP force plot shown in Fig. 6 shows the XGBoost model’s personalized prediction of PSCI risk, facilitating easy visualization of the results. It shows that different predictors can affect the outcome of different samples, that is, whether PSCI occurs or not, and shows the contribution of the expression of each predictor to the sample prediction.

(A) Feature importance of XGBoost model; (B) Feature importance ranking and interpretation. The greater a feature SHAP, the higher the individual’s risk of PSCI. A feature with a red color indicates a higher value. Abbreviations: HAMD-24: Hamilton depression Scale-24; ALB: Albumin; FBG: Fasting blood glucose; PSQI: Pittsburgh sleep quality index; NIHSS: National institutes of health stroke scale; SHAP: Shapley additive exPlanations.

SHAP force plot of XGBoost model for PSCI. (A) Mispredicted Non-PSD. (B) Mispredicted PSD. (C) Correctly predict Non-PSD. (D) Correctly predict PSD. Red represents the predictive predictors of PSCI and blue represents the predictive predictors of Non-PSCI. Abbreviations: HAMD-24: Hamilton depression Scale-24; FBG: Fasting blood glucose; PSQI: Pittsburgh sleep quality index.
Discussion
In this study, the development of seven ML models for predicting the risk of mild and moderate PSCI occurring within 3–6 months after stroke in patients with AIS represents a significant advancement in the pursuit of more precise and efficacious strategies for managing post-stroke cognitive complications. The XGBoost model, which incorporates age, NIHSS, HAMD-24, PSQI, ALB, FBG, hypertension, paraventricular lesion, and lesion number as features, exhibits exceptional predictive performance for the risk of PSCI during this specific time frame. SHAP analysis validates the model's capacity to effectively integrate and leverage multiple clinical features, thereby enabling accurate predictions of mild and moderate PSCI within 3–6 months post-stroke. The findings of this study suggest a possible tool for predicting PSCI within 3–6 months post-stroke, which could be useful in clinical decision making.
The XGBoost model demonstrated remarkable predictive accuracy in the context of PSCI prediction. It exhibited an AUROC of 0.980 (95% CI 0.973–0.988), signifying a high discriminatory capacity between patients who develop PSCI and those who do not17. This metric, nearer to the ideal value of 1, reflects the model’s adeptness at capturing the intricate associations and interactions among input clinical features and the outcome variable, PSCI, likely attributable to its proficiency in handling complex non-linear relationships18. The sensitivity, defined as the proportion of true positive cases correctly identified by the model, was calculated at 0.942 (95% CI 0.904–0.979), thereby ensuring the accurate identification of a substantial proportion of high-risk PSCI patients and facilitating the implementation of early intervention and treatment strategies19. Similarly, the specificity, which quantifies the proportion of true negative cases correctly classified, was determined to be 0.954 (95% CI 0.925–0.983), indicating a low false positive rate and reducing unnecessary anxiety and interventions in patients not at risk20. The overall predictive reliability of the model was further evidenced by an accuracy of 0.947 (95% CI 0.914–0.979). Additionally, the F1 score, the harmonic mean of precision and recall, was ascertained to be 0.951 (95% CI 0.932–0.970), reflecting the model’s capacity to balance precision and recall effectively21. Moreover, the AP value of 0.987 (95% CI 0.976–0.997) underscored the model’s proficiency in prioritizing positive predictions while maintaining a high level of precision22. Collectively, these performance metrics collectively attest to the robustness and reliability of the XGBoost model in predicting PSCI within the specified time frame. Its ability to accurately stratify patients according to their risk of PSCI has the potential to revolutionize clinical decision-making, enabling healthcare providers to allocate resources more efficiently and target interventions precisely to those patients most in need23. To elucidate the predictive mechanisms underlying the XGBoost model, we conducted the SHAP analysis. This analysis revealed the contribution of each predictor to the model’s output, identifying HAMD-24 as the most significant positive predictor of PSCI. HAMD-24 is a widely recognized tool for assessing depressive symptoms, and its prominence as a predictor suggests a potential bidirectional relationship between depression and cognitive impairment following stroke24. Depression is hypothesized to contribute to cognitive decline through various complex biological mechanisms, including neuroinflammation, disruption of neural networks, and altered neurotransmitter function25,26. Patients with higher HAMD-24 scores may experience more severe cognitive deficits due to these underlying biological processes27. Moreover, depression may indirectly exacerbate cognitive impairment by influencing a patient’s engagement in rehabilitation and lifestyle behaviors28. The accurate prediction of PSCI within the first 3–6 months after stroke has profound clinical implications. The other variables identified as significant predictors in the SHAP analysis also offer valuable insights into the pathophysiology of PSCI. ALB levels reflect nutritional status and fluid balance, both of which have been implicated in cognitive function29,30. Similarly, FBG levels may serve as an indicator of underlying metabolic abnormalities contributing to cognitive decline31. Sleep quality, as assessed by the PSQI, is recognized as a critical factor in cognitive health. Poor sleep quality has been associated with increased inflammation, reduced neural plasticity, and impaired memory consolidation, all of which may contribute to the development of PSCI32,33. Advanced age remains a well-established risk factor for cognitive impairment, with age-related changes in brain structure and function, such as reduced synaptic density and increased neurodegeneration, likely playing a role34,35. Stroke severity, as measured by the NIHSS, and the presence of paraventricular and other lesions may directly impact neural tissue damage and cognitive function36,37,38. Hypertension, a major risk factor for stroke, may contribute to cognitive decline through its effects on blood vessels and brain perfusion39,40.
Positive prediction of high risk of cognitive impairment in the months after stroke has far-reaching clinical implications. Healthcare professionals can leverage the results of our model to identify patients at high risk of developing PSCI early in their post-stroke course. For instance, patients with high HAMD-24 scores could be prioritized for mental health support and interventions, such as cognitive - behavioral therapy, pharmacotherapy, or a combination of both. These interventions may not only alleviate depressive symptoms but also have a positive impact on cognitive function by reducing inflammation, improving neural plasticity, and enhancing motivation to engage in rehabilitation activities41,42. In addition to mental health interventions, tailored strategies can be developed to optimize sleep quality, nutritional status, and glycemic control based on an individual patient's predicted risk of PSCI. Lifestyle modifications, such as increased physical activity, cognitive training, and adherence to a healthy diet, have been shown to have beneficial effects on cognitive function and may serve as important components of a comprehensive treatment plan for stroke patients at risk of PSCI43,44. Furthermore, our model can assist clinicians in making informed decisions regarding the intensity and type of rehabilitation therapies to prescribe. For patients with a high predicted risk of PSCI, more intensive and personalized rehabilitation programs may be warranted to maximize cognitive recovery and functional independence. Conversely, for patients with a lower risk, less intensive or maintenance-based interventions may be appropriate, reducing healthcare costs and resource utilization while still providing adequate support for the patient's needs.
Despite the promising results, our study has several limitations. Firstly, the data were collected from a single medical institution in China, potentially limiting the generalizability to other populations and settings. Future studies should validate our model in diverse cohorts globally. Secondly, although we included comprehensive clinical features, other contributing factors may have been missed. Future research could incorporate detailed neuroimaging data (e.g., advanced MRI for white matter integrity, gray matter atrophy, and brain connectivity)45, genetic markers (e.g., SNPs related to cognitive function or stroke risk)46, and environmental factors (e.g., pollutants exposure, socioeconomic status, and educational attainment)47,48. Furthermore, while our model showed excellent predictive performance in cross-validation, its performance might vary in real-world clinical settings, influenced by factors like data quality, missing values, and confounding variables. Future studies should conduct external validations across multiple healthcare settings and time points. Finally, the causal relationships between the identified risk factors and PSCI need further clarification. Given the potential overfitting performance of other algorithms and and forms such as random forest and decision tree, the current research only focuses on modeling with seven ML algorithms and excludes these algorithms. XGBoost is one of the variants of decision trees. To ensure model robustness and generalizability, we opted for XGBoost due to its superior performance in handling complex non-linear relationships and reducing overfitting. Longitudinal studies with repeated measurements over an extended follow-up period, as well as experimental studies for causal effect investigations, are warranted.
Conclusion
In conclusion, this study developed an XGBoost model that accurately predicts mild and moderate PSCI within 3–6 months post-stroke. SHAP analysis identified HAMD-24 as the most significant positive predictor, along with other crucial clinical features. Our findings offer a valuable tool for early identification and targeted intervention in clinical practice, with the potential to improve cognitive outcomes in stroke patients during this critical period. However, limitations exist, and future research should focus on enhancing model generalizability, exploring additional risk factors, validating the model in real-world settings, and elucidating causal relationships between risk factors and PSCI. With further refinements, the model holds promise for clinical management of PSCI.
Data availability
Data sets are not publicly available because they contain information that could compromise the privacy of research participants, but minimal data is available from the corresponding author upon reasonable request.
References
Yu, K. H. et al. Cognitive impairment evaluated with vascular cognitive impairment harmonization standards in a multicenter prospective stroke cohort in Korea. Stroke 44, 786–788 (2013).
Sun, J. H., Tan, L. & Yu, J. T. Post-stroke cognitive impairment: Epidemiology, mechanisms and management. Ann. Transl. Med. 2, 80 (2014).
Leys, D., Henon, H., Mackowiak-Cordoliani, M. A. & Pasquier, F. Poststroke dementia. Lancet Neurol. 4, 752–759 (2005).
Zuo, L. J. et al. New progress in the study of cognitive dysfunction after stroke. Chin. J. Stroke 12, 962–967 (2017).
El Husseini, N. et al. Cognitive impairment after ischemic and Hemorrhagic stroke: A scientific statement from the American heart association/American stroke association. Stroke 54(6), e272–e291 (2023).
Tang, E. Y. et al. Longitudinal effect of stroke on cognition: A systematic review. J. Am. Heart Assoc. 7, e006443 (2018).
Yuan, X., Zhang, L., Sui, R. & Wang, Z. A risk prediction model of post-stroke cognitive impairment based on magnetic resonance spectroscopy imaging. Neurol. Res. 43(8), 642–652 (2021).
Huang, Y. Y. et al. Post-stroke cognitive impairment: Epidemiology, risk factors, and management. J. Alzheimers Dis. 86(3), 983–999 (2022).
Dong, Y. et al. Development and validation of a clinical model (DREAM-LDL) for post-stroke cognitive impairment at 6 months. Aging (Albany NY). 13(17), 21628–21641 (2021).
Ji, W., Wang, C., Chen, H., Liang, Y. & Wang, S. Predicting post-stroke cognitive impairment using machine learning: A prospective cohort study. J. Stroke Cerebrovasc. Dis. 32(11), 107354 (2023).
Lee, M. et al. Prediction of post-stroke cognitive impairment after acute ischemic stroke using machine learning. Alzheimers Res. Ther. 15(1), 147 (2023).
Lee, M. et al. Machine learning-based prediction of post-stroke cognitive status using electroencephalography-derived brain network attributes. Front. Aging Neurosci. 15, 1238274 (2023).
Li, X. et al. Machine learning in the prediction of post-stroke cognitive impairment: A systematic review and meta-analysis. Front. Neurol. 14, 1211733 (2023).
Peng, B. & Wu, B. Chinese guidelines for diagnosis and treatment of acute ischemic stroke 2018. Chin. J. Neurol. 51(09), 666–682 (2018).
Li, Y. et al. Development and validation of a predictive model for early identification of cognitive impairment risk in community-based hypertensive patients. J. Appl. Gerontol. 43(12), 1867–1877 (2024).
Zhong, X. et al. A risk prediction model based on machine learning for early cognitive impairment in hypertension: Development and validation study. Front. Public Health 11, 1143019 (2023).
Betrouni, N. et al. Texture features of magnetic resonance images: An early marker of post-stroke cognitive impairment. Transl. Stroke Res. 11(4), 643–652 (2020).
Lee, R., Choi, H., Park, K. Y., Kim, J. M. & Seok, J. W. Prediction of post-stroke cognitive impairment using brain FDG PET: Deep learning-based approach. Eur. J. Nucl. Med. Mol. Imaging. 49(4), 1254–1262 (2022).
Weaver, N. A. et al. Strategic infarct locations for post-stroke cognitive impairment: a pooled analysis of individual patient data from 12 acute ischaemic stroke cohorts [published correction appears in Lancet Neurol. 2024 Apr;23(4):e8. 10.1016/S1474-4422(24)00094-2.]. Lancet Neurol. 20(6), 448–459 (2021).
Monaghan, T. F. et al. Foundational statistical principles in medical research: Sensitivity, specificity, positive predictive value, and negative predictive value. Medicina (Kaunas). 57(5), 503 (2021).
DeVries, Z. et al. Using a national surgical database to predict complications following posterior lumbar surgery and comparing the area under the curve and F1-score for the assessment of prognostic capability. Spine J. 21(7), 1135–1142 (2021).
Zhu, Y. X. et al. Application of ROC and PR curves in the evaluation of clinical diagnostic testing. Zhonghua Yu Fang Yi Xue Za Zhi 56(9), 1341–1347 (2022).
Yang, Y. et al. Prediction models for post-stroke cognitive impairment: A systematic review and meta-analysis. Public Health Nurs. 42(3), 1375–1388 (2025).
Baccaro, A. et al. [24] Does stroke laterality predict major depression and cognitive impairment after stroke? Two-year prospective evaluation in the EMMA study. Prog. Neuropsychopharmacol. Biol. Psychiatry 30(94), 109639 (2019).
Nadeau, S. E. Neural mechanisms of emotions, alexithymia, and depression. Handb. Clin. Neurol. 183, 299–313 (2021).
Sapsford, T. P. et al. Forgetful, sad and old: do vascular cognitive impairment and depression share a common pre-disease network and how is it impacted by ageing?. J. Psychiatr. Res. 156, 611–627 (2022).
Liang, W. et al. Longitudinal relationships between depressive symptoms and cognitive function after stroke: A cross-lagged panel design. J. Psychosom. Res. 174, 111486 (2023).
Aziz, R. & Steffens, D. Overlay of late-life depression and cognitive impairment. Focus (Am Psychiatr Publ). 15(1), 35–41 (2017).
Eckart, A. et al. Relationship of nutritional status, inflammation, and serum albumin levels during acute illness: A prospective study. Am. J. Med. 133(6), 713–722 (2020).
Roberts, S. B. et al. Effects of food supplementation on cognitive function, cerebral blood flow, and nutritional status in young children at risk of undernutrition: Randomized controlled trial. BMJ 370, m2397 (2020).
Lim, J. S. et al. Effects of glycemic variability and hyperglycemia in acute ischemic stroke on post-stroke cognitive impairments. J. Diabetes Complic. 32(7), 682–687 (2018).
Irwin, M. R. Sleep and inflammation: Partners in sickness and in health. Nat. Rev. Immunol. 19(11), 702–715 (2019).
Minkel, J. et al. Sleep deprivation potentiates HPA axis stress reactivity in healthy adults. Health Psychol. 33(11), 1430–1434 (2014).
Zweig, J. A., Caruso, M., Brandes, M. S. & Gray, N. E. Loss of NRF2 leads to impaired mitochondrial function, decreased synaptic density and exacerbated age-related cognitive deficits. Exp. Gerontol. 131, 110767 (2020).
Fang, E. F. et al. Mitophagy inhibits amyloid-β and tau pathology and reverses cognitive deficits in models of Alzheimer’s disease. Nat. Neurosci. 22(3), 401–412 (2019).
Tu, Q. et al. The current situation on vascular cognitive impairment after ischemic stroke in Changsha. Arch. Gerontol. Geriatr. 58(2), 236–247 (2014).
Sachdev, P. S. et al. Clinical determinants of dementia and mild cognitive impairment following ischaemic stroke: The Sydney Stroke Study. Dement. Geriatr. Cogn. Disord. 21(5–6), 275–283 (2006).
Tang, W. K. et al. Frequency and determinants of poststroke dementia in Chinese. Stroke 35(4), 930–935 (2004).
Ferrari, F. & Villa, R. F. Brain bioenergetics in chronic hypertension: Risk factor for acute ischemic stroke. Biochem. Pharmacol. 205, 115260 (2022).
Baggeroer, C. E., Cambronero, F. E., Savan, N. A., Jefferson, A. L. & Santisteban, M. M. Basic mechanisms of brain injury and cognitive decline in hypertension. Hypertension 81(1), 34–44 (2024).
Lei, A. A. et al. Chronic stress-associated depressive disorders: The impact of HPA axis dysregulation and neuroinflammation on the hippocampus-A mini review. Int. J. Mol. Sci. 26(7), 2940 (2025).
Orgeta, V. et al. Psychological treatments for depression and anxiety in dementia and mild cognitive impairment. Cochrane Database Syst. Rev. 4(4), CD009125 (2022).
Kivipelto, M., Mangialasche, F. & Ngandu, T. Lifestyle interventions to prevent cognitive impairment, dementia and Alzheimer disease. Nat. Rev. Neurol. 14(11), 653–666 (2018).
Brainin, M. et al. Prevention of poststroke cognitive decline: ASPIS–a multicenter, randomized, observer-blind, parallel group clinical trial to evaluate multiple lifestyle interventions–study design and baseline characteristics. Int. J. Stroke. 10(4), 627–635 (2015).
Zhao, J., Ding, X., Du, Y., Wang, X. & Men, G. Functional connectivity between white matter and gray matter based on fMRI for Alzheimer’s disease classification. Brain Behav. 9(10), e01407 (2019).
Duan, H. et al. Association of unhealthy lifestyle and genetic risk factors with mild cognitive impairment in chinese older adults. JAMA Netw Open. 6(7), e2324031 (2023).
Jones, A. et al. Environmental risk factors for all-cause dementia, Alzheimer’s disease dementia, vascular dementia, and mild cognitive impairment: An umbrella review and meta-analysis. Environ. Res. 270, 121007 (2025).
Bian, S. et al. Assessing cognitive impairment in home-dwelling Chinese elders aged 80+: A detailed survey of 13,000 participants focusing on demographic factors, social engagement, and disease prevalence. Front. Psychiatry 2(15), 1355708 (2024).
Acknowledgements
I would like to express my special thanks to my partners and our funding agency for their encouragement and support during this study.
Funding
This study was supported by National Natural Science Foundation of China (General Program) under Grant Number 82474422 and the Postdoctoral Fellowship Program of CPSF under Grant Number GZB20240036. Funding agencies had no role in research design, data collection, analysis, interpretation, manuscript writing and submission.
Author information
Authors and Affiliations
Contributions
Huachen Jiao and Jing Li were the main coordinators of the project and were responsible for the design of the study. Tianen Zhao and Xia Zhong drafted the manuscript of this paper. Shimeng Lv and Guangheng Zhang were involved in the supervision of data collection and stratification. Donghai Liu and Xia Zhong contributed to data compilation and analysis. All authors contributed intellectually to this manuscript and have approved this final version.
Corresponding authors
Ethics declarations
Competing interests
The authors declare no competing interests.
Ethical approval and consent to participate
This study was approved by the Ethics Committee of the Affiliated Hospital of Shandong University of Chinese Medicine with the informed consent of all participants. All the steps/ methods were performed in accordance with the relevant guidelines and regulations.
Consent for publication
Not applicable.
Additional information
Publisher’s note
Springer Nature remains neutral with regard to jurisdictional claims in published maps and institutional affiliations.
Rights and permissions
Open Access This article is licensed under a Creative Commons Attribution-NonCommercial-NoDerivatives 4.0 International License, which permits any non-commercial use, sharing, distribution and reproduction in any medium or format, as long as you give appropriate credit to the original author(s) and the source, provide a link to the Creative Commons licence, and indicate if you modified the licensed material. You do not have permission under this licence to share adapted material derived from this article or parts of it. The images or other third party material in this article are included in the article’s Creative Commons licence, unless indicated otherwise in a credit line to the material. If material is not included in the article’s Creative Commons licence and your intended use is not permitted by statutory regulation or exceeds the permitted use, you will need to obtain permission directly from the copyright holder. To view a copy of this licence, visit http://creativecommons.org/licenses/by-nc-nd/4.0/.
About this article

Cite this article
Zhong, X., Zhao, T., Lv, S. et al. Development and validation of a machine learning-based risk prediction model for post-stroke cognitive impairment. Sci Rep 15, 32942 (2025). https://doi.org/10.1038/s41598-025-98054-4
Received:
Accepted:
Published:
Version of record:
DOI: https://doi.org/10.1038/s41598-025-98054-4
