
Abstract
To examine the influence of borehole parameters on the instability and precursor characteristics of large-diameter boreholes in coal seams, this study conducts instability failure tests on coal samples with varying diameters, spacing, and row spacing. The investigation explores the effects of borehole parameters on the damage and failure of coal samples from the perspectives of stress distribution, crack propagation, failure modes, and acoustic emission characteristics. The following three points are addressed: (1) Increasing the borehole diameter and reducing the row spacing significantly enhances the pressure relief effect of large-diameter boreholes, necessitating rational adjustment of borehole spacing parameters for optimal performance. (2) The damage mechanism induced by borehole parameters primarily manifests as shear cracks, with minimal impact on tensile cracks. (3) A sudden decrease in the b-value indicates imminent rupture, and when the b-value reaches its minimum, the final failure of the coal sample occurs. The research findings enhance the understanding of the pressure relief process in large-diameter boreholes and provide a scientific basis for parameter selection and optimization in large-diameter borehole operations.
Introduction
With the continuous increase in coal mining depth, the average mining depth in China has now reached approximately 700 m1,2,3. Mining deep coal seams under high ground stress and significant mining disturbances is prone to induce coal bursts4,5. In recent years, frequent coal bursts have severely constrained safe and efficient production in deep mines. Consequently, there is an urgent need to develop a convenient, efficient, and applicable pressure relief method6,7. Large-diameter boreholes have emerged as the most widely adopted pressure relief measure for deep mines due to their ability to effectively redistribute high stress in the surrounding rock and mitigate regional impact risks8.
Domestic and foreign scholars have carried out extensive research on the pressure relief principle of large-diameter boreholes9,10,11. Lu et al.12 developed an elastoplastic mechanical model for roadway floor heave, systematically analyzed the relationship between the pressure relief range and the volume of floor heave, and demonstrated that a reasonably designed borehole depth can effectively control floor heave and surrounding rock deformation. Based on coal burst stress control theory, Ma et al.13 investigated the distribution characteristics of the pressure relief radius around boreholes, further extended the analysis of the influence of borehole diameter on the pressure relief zone, and concluded that increasing the borehole diameter is advantageous for expanding the pressure relief zone. Zhang et al.14 comprehensively examined the influence of borehole parameters on the wave dissipation energy of roadway surrounding rock. Zhang et al.15 established an elastic mechanical model for pressure relief in large-diameter boreholes, and systematically studied the stress distribution characteristics and energy release laws of coal under large-diameter borehole pressure relief at varying seam thicknesses. Hao et al.16 conducted uniaxial compression tests combined with acoustic emission (AE) monitoring on borehole coal samples, revealing that the conversion rate and growth rate of elastic energy in coal-like materials significantly decreased after drilling, thereby delaying the release of energy within the coal.
Several scholars have conducted extensive research on the pressure relief parameters of large-diameter boreholes17,18. Zhao et al.19 analyzed the effects of various borehole configurations on coal energy evolution and explored their implications for preventing and controlling coal bursts. Li et al.20 monitored pressure relief in boreholes at coal mine sites and examined the effects of parameters such as borehole diameter, spacing, and time on the pressure relief efficiency. Zhang et al.21 investigated the influence of boreholes on the strength of coal samples, energy dissipation index, and other related parameters, concluding that a higher density of boreholes results in improved pressure relief outcomes. Cui et al.22 studied the characteristics of stress, displacement, strain energy, and plastic zones in roadway side rocks under various parameters, including large-diameter borehole diameter, depth, and spacing, highlighting the influence of these parameters on coal pressure relief. Wang et al.23 optimized the simulation effectiveness of pressure relief from large-diameter boreholes through the secondary development of the FLAC3D strain softening model, discussed the influence of borehole parameters on pressure relief, and applied the findings to engineering sites for enhance roadway stability maintenance.
Currently, the majority of scholars concentrate on investigating the impact of borehole parameters on the pressure relief effectiveness of large-diameter boreholes, while relatively less emphasis has been placed on exploring the processes associated with borehole instability and its precursor signals. To address this issue, this paper presents both laboratory and numerical experimental studies on coal samples involving coal samples characterized by varying borehole diameters, spacings, and row spacings. The analysis focuses on the characteristics of crack initiation, propagation, and evolution throughout the instability process in these coal samples. Simultaneously, AE monitoring technology is employed to examine AE characteristics throughout the entire damage process of coal, exploring the precursor signal characteristics of borehole coal sample failure and instability. The research results help to understand the pressure relief process associated with large-diameter boreholes and offer theoretical support for selecting and optimizing relevant parameters.
Laboratory experimental on failure and instability of large diameter borehole
Sample Preparation and arrangement
The coal sample was selected from the same area of a mine, considering the stress environment of the roadway and the arrangement of boreholes. The sample was processed into a cube with dimensions of 50 mm × 50 mm × 100 mm. Boreholes were drilled into the coal sample using various parameters, followed by polishing all six surfaces to achieve a roughness level of less than 0.02 mm. To facilitate observation of crack development, the surface of the coal sample was precoated with matte white paint. Samples featuring different borehole diameters, spacings, and row spacings arrangements are shown in Fig. 1.
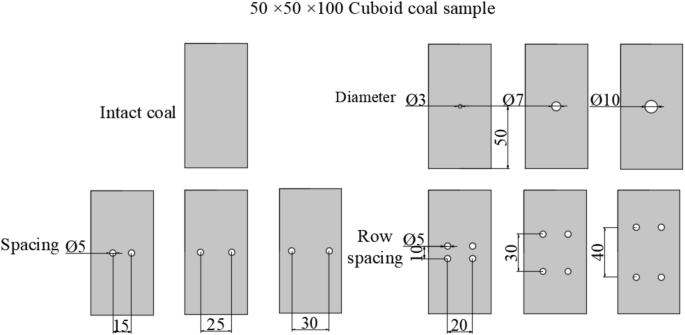
Coal sample scheme (unit: mm).
The experiment employed a DRTB-4000 electrohydraulic servo rock mechanics testing machine along with a PCI-2 multichannel AE system. The AE sensors were strategically positioned, with two sensors placed on each of the three sides of the coal sample, excluding the side facing the borehole. A coupling agent was applied at the interface between the sensor surface and the coal sample to eliminate any contact gaps, thereby ensuring accurate localization of source information. A partial view of the coal sample and AE sensor layout is shown in Fig. 2.

Partial coal sample and AE sensor layout.
The experimental loading protocol consists of the following three stages:
-
1.
(1) The loading head establishes contact with the sample and applies an initial load of 0.5 MPa.
-
2.
(2) The applied load is sustained for 10 s, during which the AE monitoring system is concurrently activated.
-
3.
(3) A displacement-controlled loading approach is utilized, with a loading rate of 0.1 mm/min, continuing until sample failure occurs.
Analysis of instability characteristics
Stress‒strain characteristics
The stress‒strain curve of a coal sample subjected to uniaxial compression serves as a fundamental indicator for analyzing the fracture and damage characteristics of coal. By examining the morphology of this curve, one can determine the pre-peak trend, peak stress, and post-peak behavior. Figure 3 shows the stress‒strain characteristics of coal samples with different borehole diameters. Figure 4 shows the stress‒strain characteristics of coal samples with different borehole spacings. Figure 5 shows the stress‒strain characteristics of coal samples with different borehole row spacings.

Stress‒strain characteristics of coal samples with different borehole diameters.

Stress‒strain characteristics of coal samples with different borehole spacings.

Stress‒strain characteristics of coal samples with different borehole row spacings.
The uniaxial compressive strength (UCS) of the intact coal sample was measured at 25.76 MPa. Following the introduction of boreholes, the UCS of all the coal samples exhibited different degrees of reduction. The slope of the Stress‒strain curve prior to peak stress for the borehole coal sample is significantly lower than that of the intact samples. Furthermore, the trend in the shear modulus variation among the coal samples mirrored that of peak stress, likely influenced by the inherent heterogeneity present within these samples. Nevertheless, it was observed that the shear modulus for all coal samples experienced a substantial decrease after borehole, indicating that boreholes enhance deformability in these samples. This suggests that the ability of coal samples to store elastic strain energy up to peak stress is compromised due to borehole presence, which acts as a mechanism for stress relief. Regarding different borehole diameter groups, it was found that UCS decreases with increasing diameter. In terms of the borehole spacing groups, a spacing distance of 25 mm resulted in the lowest peak stress, and its rate of increase in peak stress is markedly lower compared to single-borehole samples. Lastly, concerning borehole row spacing groups, an increase in row spacing correlates with a decrease in UCS across all tested coal samples.
Fracture distribution characteristics
The final instability characteristics and crack propagation (projection) of both intact coal samples and those with different borehole diameters are shown in Fig. 6. A local fracture initiates at the top-right corner of the intact coal sample, causing surface spalling. Subsequently crack propagate in this region, identified as a weak zone, leads to the formation of cracks extending from the top-right to the middle and lower sections of the coal sample, ultimately resulting in failure at the bottom-left corner. For coal samples with different borehole diameters, the failure modes include fracture expansion, borehole collapse and surface spalling. When the borehole diameter is 3 mm, multiple cracks develop during the fracturing process, propagating from the upper-left to the lower-right regions. Surface spalling damage remains minimal. In contrast, when the borehole diameter increases to 7 mm and 10 mm, cracks traverse the entire length of these larger boreholes. Additionally, as the borehole diameter increases, coal burst and detachment around the borehole perimeter become more pronounced. Consequently, the severity of damage and deformation within these larger boreholes becomes increasingly significant.

Fracture distributions of both intact coal samples and those with different borehole diameters.

Fracture distribution of coal samples with different borehole spacings.
The instability characteristics and crack propagation (projection) of coal samples with different borehole spacings are shown in Fig. 7. When the borehole spacing is 15 mm, extensive burst failure is observed on the left side of the coal sample and in the vicinity of the borehole region. This phenomenon can be attributed to the excessively narrow borehole spacing, which induces high stress concentrations between the boreholes and leads to the accumulation of significant elastic strain energy. Under uniaxial compression, the burst surrounding the borehole triggers a rapid release of this stored energy, resulting in widespread burst failure. When the borehole spacing increases to 25 mm, fractures propagate through the boreholes on both sides. This occurs because as the borehole spacing increases, the interaction between adjacent boreholes diminishes, enhancing the individuality of each borehole and approaching the condition of isolated boreholes. When the borehole spacing reaches 30 mm, the primary areas of coal sample fracture are located near the edges of the boreholes and beneath the coal sample. This is due to the boreholes being positioned too close to the sample edge, reducing the wall thickness on either side of the boreholes, thereby causing premature cracking and subsequent damage to the coal sample.

Fracture distributions of coal samples with different borehole row spacings.
The instability characteristics and crack propagation (projection) of coal samples with different borehole row spacings are shown in Fig. 8. When the borehole row spacing is 10 mm, a crack is observed traversing the central region of the coal sample’s surface, while another crack is located near the upper row of boreholes. At a borehole row spacing of 30 mm, two prominent cracks are evident, extending through the left and bottom double boreholes, with additional cracks appearing between the upper and lower rows of boreholes. For a borehole row spacing of 40 mm, the coal sample exhibits significant borehole collapse and surface spalling, indicating a pronounced high-stress concentration between the upper and lower borehole rows. In conjunction with the Stress‒strain curve of the coal sample, the UCS values for coal sample with different borehole row spacings are substantially higher than those of the initial two groups, thereby exacerbating surface spalling failure during instability.
Numerical study on failure and instability of large diameter borehole
Model establishment
UDEC is a computational analysis program based on discrete element method theory, specifically designed for simulating the behavior of jointed rock systems or discontinuous mass assemblies under complex loading conditions24. In this study, UDEC is employed to investigate the crack characteristics of borehole coal samples subjected to dynamic fracture conditions. For model selection, an enhanced UDEC-Trigon model was adopted to more accurately represent actual internal friction angles and crack propagation while minimizing grid dependency25,26. The dimensions of the model were established as 50 mm × 100 mm, with an average block side length of 1 mm. The model is constrained at both its top and bottom by rigid loading plates. Specifically, the bottom loading plate is fixed, while the top loading plate is allowed to move freely. A linear elastic constitutive model was adopted for the block material, whereas a Coulomb constitutive model was applied to describe contact surface behavior. Displacement loading was selected as the method of application, with a rate at 0.05 m/s and a time step size of 3 × 10− 7 s/step27. A schematic representation of the model is shown in Fig. 9. The borehole diameter, spacing, and row spacing are identified as critical variables influencing borehole configuration. Through systematic variation of these parameters, an extensive investigation into how borehole arrangement affects cracks within samples has been conducted. Detailed descriptions of these borehole parameters are provided in Table 1.

Schematic diagram of uniaxial compression of the borehole model.
Parameter calibration
The parameters were calibrated through uniaxial compression and Brazilian splitting experiments28,29. By systematically adjusting the mesoscopic parameters (block and joint) of the model, optimal values that accurately represent the failure behavior of the sample were identified. The selected mechanical parameters for the numerical model are detailed in Tables 2 and 3. The results from both the corrected laboratory experiments and numerical simulations are shown in Fig. 10.
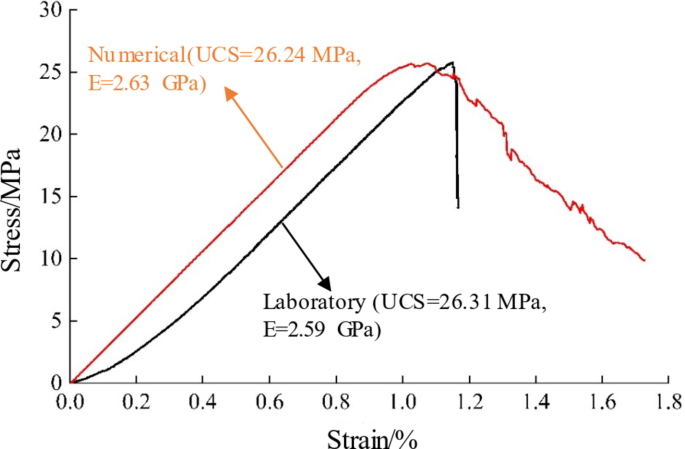
Results of the laboratory and numerical experiment.
The UCS and elastic modulus of the coal sample obtained in the laboratory are 26.31 MPa and 2.59 GPa, respectively. The numerical results indicate that the UCS of the coal sample is 26.24 MPa, while the elastic modulus measures at 2.63 GPa. Both values fall within a margin of 5%, suggesting that the parameters presented in Tables 1 and 2 effectively reflect the instability characteristics of coal samples.
Numerical analysis of instability characteristics
Effect of the borehole diameter on fracture of coal samples
The damage patterns of coal samples with different borehole diameters are shown in Fig. 11. It is worth noting that the color scales for all cloud images remain consistent and have not been re-rendered. The primary failure mode of intact coal sample is shear failure, which is characterized by a few long cracks and a multitude of short cracks. As the borehole diameter increases, stress concentration around the borehole perimeter becomes more pronounced, leading to an increase in crack formation and surrounding fractures. Consequently, the proportion of shear failure increases, along with more pronounced volumetric expansion. This indicates that an increase in borehole diameter promotes the propagation and penetration of cracks around the borehole perimeter, thereby enhancing the likelihood of shear failure in coal samples.
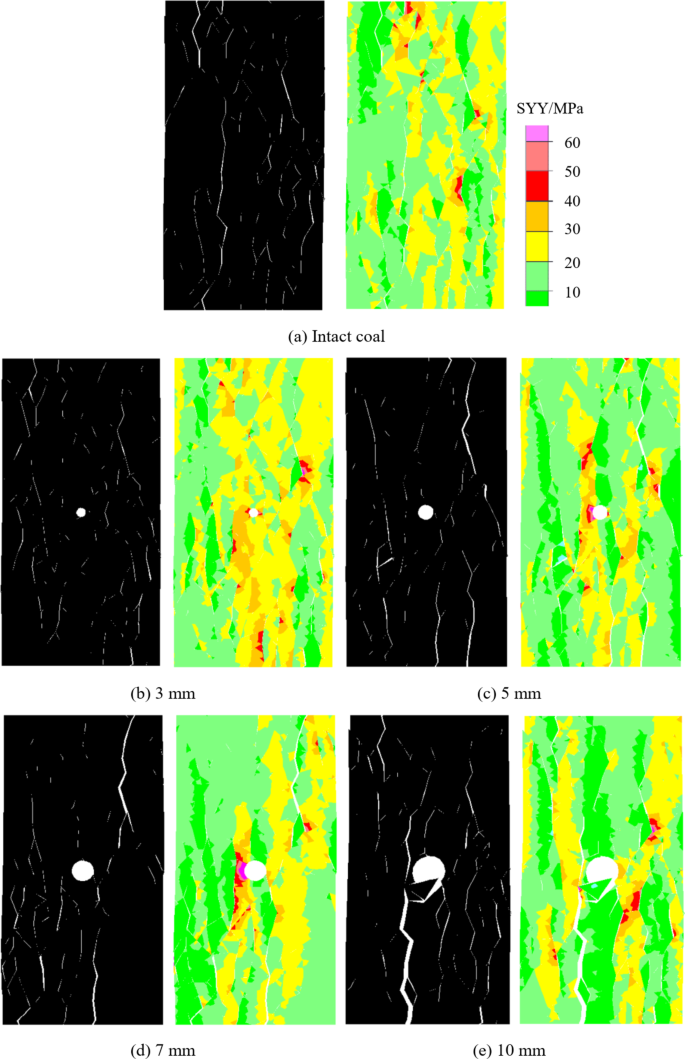
Failure patterns and nephograms of the maximum principal stress of coal samples with different borehole diameters.
The evolution of crack development in coal samples with different borehole diameters is shown in Fig. 12. For intact coal samples and those with borehole diameters of 3 mm, 5 mm, 7 mm, and 10 mm, the proportion of tensile cracks and the overall damage crack ratio remained below 2% (where the crack ratio refers to the ratio of crack length to the total joint length25). This indicates that the cracks in the samples reached their peak stress when the fine-grained damage was primarily in the form of shear cracks. An increase in borehole diameter resulted in a rapid decline in the proportion of shear cracks and damage cracks within the coal samples, indicating that the influence of borehole diameter on the fine-grained damage mechanism is primarily associated with shear cracks. When the borehole diameter was 3 mm, the ratio of peak stress relative to that of the intact coal sample was 99.9%, and the ratio of the fracture stress (defined as the initial crack to the joint surface30,31) relative to the intact coal sample was 100%. This implies minimal depressurization effects for small borehole diameters. Upon increasing the borehole diameter to 5 mm, the ratio of fracture stress decreased slightly to 95% of the intact coal sample, while the ratio of peak stress dropped significantly to 90%. This indicates that an increase in borehole diameter reduces both fracture stress and peak stress, promoting crack initiation and propagation during loading. At a borehole diameter of 7 mm, the peak stress decreased to 81% of the intact sample, enhancing the depressurization effect. Conversely, when the borehole diameter increased to 10 mm, there was a substantial reduction in both cracking stress and peak stress, along with a marked decrease in the ratio of the intact coal sample. This change also led to a significant enhancement in the depressurization effect.

Damage evolution laws of coal samples with different borehole diameters.
Generally, an increase in the borehole diameter exacerbates the local stress concentration around the borehole region. This intensification is more likely to induce fractures within the coal sample, thereby accelerating crack initiation. Such phenomena significantly affect the cracking threshold. Simultaneously, as the borehole diameter increases, the stress experienced by cracks within the coal sample decreases, leading to structural damage and a rapid deterioration of crack stability. Consequently, there exists a cascading relationship among the borehole diameter, stress concentration, crack propagation, and peak stress. This highlights that enlarging the borehole diameter represents a rational strategy for enhancing pressure relief during large-diameter borehole operations.
Effect of the borehole spacing on fracture of coal samples
The destruction patterns of coal sample and the distributions of maximum principal stress for different borehole spacings are shown in Fig. 13. Significant differences can be observed in the destruction patterns of coal samples at different borehole spacings. When the borehole spacing is set at 15 mm, distinct degrees of deformation are evident around both circular boreholes. The regions experiencing high stress are primarily concentrated from the upper left to the middle and lower sections of the coal sample, as well as between the two boreholes. As the borehole spacing increases to 20 mm, cracks begin to accumulate around both circular boreholes, leading to a significant change in the area of high-stress concentration. The previously existing high-stress region between the boreholes dissipated, leading to a reduction in their mutual influence. When further increasing the borehole spacing to 25 mm and 30 mm, no substantial differences are observed regarding either fracture distribution or propagation paths within the coal samples. However, high-stress concentrations remain prominent within both circular boreholes. The left circular borehole demonstrates more pronounced deformation accompanied by phenomena related to stress transfer. In contrast, while maintaining relative structural integrity, extensive areas of high-stress concentration persist around the right circular borehole region.

Failure patterns and nephograms of the maximum principal stress of coal samples with different borehole spacings.
The damage evolution of coal samples with different borehole spacings are shown in Fig. 14. As the borehole spacing increases, the number of damage cracks and shear cracks within the coal samples initially decreases before subsequently increases. Specifically, the coal sample with a 15 mm spacing exhibits the highest proportion of damage cracks (18.3%) among the four groups, while the sample with a 25 mm spacing has the lowest proportion (12.4%). The proportion of tensile cracks in both intact and borehole coal samples consistently remains below 1.7%, indicating that shear cracks are predominant. This indicates that modifications to borehole spacing do not significantly impact the fine-grained damage mechanism of coal samples during peak stress attainment. The coal sample featuring a 20 mm borehole spacing achieves superior ratios for peak stress (88.2%), fracture stress (97%), and integrity compared to intact coal samples, whereas the sample with a 25 mm spacing has the lower ratios for peak stress (82.4%), fracture stress (75.6%), and integrity. The reduction in peak stress is relatively minor, exhibiting a maximum difference of only 5.8%, whereas there is a more pronounced decrease in fracture stress levels. This indicates that the borehole spacing has a more significant effect on the initiation of cracking in the coal sample but a limited effect on crack propagation and fracture, and a lesser effect on the peak stress. A comparison between these two curves reveals that as borehole spacing increases, the peak stress of the coal sample initially decreases and then slightly increases, indicating that borehole spacing can effectively reduce the peak stress and enhance depressurization effects only within specific ranges.

Damage evolution of coal samples with different borehole spacings.
Effect of the borehole row spacing on fracture of coal samples
The failure modes and distributions of maximum principal stress in coal samples with different borehole row spacings are shown in Fig. 15. When the borehole row spacing is set at 10 mm, the primary failure mechanism observed is cleavage, characterized by a pronounced stress concentration area located between the lower circular borehole region and the longitudinal crack at the base. At a borehole row spacing of 20 mm, while the failure mode remains consistent, there is an evolution in maximum principal stress that manifests as a high-stress surface extending from the upper crack along the inner wall of the circular borehole to its bottom. When the borehole row spacing is 30 mm, the extent of coal cleavage diminishes, and the maximum principal stress forms a high-stress surface from the upper and lower crack along the inner wall of the borehole. When further increasing to a spacing of 40 mm, numerous short cracks begin to appear while long crack formation becomes inhibited. High-stress regions are evident surrounding all areas of the circular boreholes, indicating that excessively large borehole row spacing impedes crack propagation and expansion, thereby compromising the depressurization efficiency of the sample.

Failure patterns and maximum principal stress nephograms of coal samples with different borehole row spacings.
The evolution of damage in coal samples with different borehole row spacings is shown in Fig. 16. As the borehole row spacing increases, the curve of damage cracks also increases. The proportion of tensile cracks in the coal samples remains relatively stable, not exceeding 2%, while shear cracks continue to dominate the damage pattern. The ratio of peak stress in the coal sample with a borehole row spacing of 10 mm to that of the intact sample is the lowest at 76.1%, whereas the ratio for a borehole row spacing of 40 mm is the highest at 87.3%. The difference between these two ratios is 11.2%. The variation trend of cracking stress aligns closely with that of peak stress, indicating that reducing the borehole row spacing can significantly enhance the depressurization effect of large-diameter boreholes.

Damage evolution of coal samples with different borehole row spacings.
Precursor signal characteristics on failure and instability of large diameter borehole
Energy and cumulative count
The evolution of stress, AE energy, and cumulative count in the borehole coal samples is shown in Fig. 17. The uniaxial compression tests performed on the borehole coal samples can be classified into four distinct stages: the compaction stage (I), stable crack propagation stage (II), unstable fracture stage (III), and post-peak stage (IV). The specific characteristics of these stages are summarized as follows:
(1) During the compaction stage (I), the stress‒strain curve demonstrates a nonlinear increase as the intrinsic defects within the sample are progressively compressed and closed. At this stage, external energy input begins to be converted into elastic energy stored within the sample. Only a small fraction of events exceed the seismic emission threshold, causing the cumulative count and energy curves to remain at very low levels.
(2) As the sample transitions from compaction stage (I) to the stable crack propagation stage (II), it undergoes elastic deformation characterized by a steady rise in the stress curve. The AE energy begins to exhibit minor fluctuations, while the cumulative counts gradually increase but still remain at relatively low levels. This indicates that cracks start to nucleate within the sample, accompanied by a small release of elastic energy.
(3) When the sample transitions from the stable crack propagation stage (II) to the unstable fracture stage (III), two distinct forms of stress‒strain curves can be observed. The first form is characterized by a sudden decrease in stress, primarily attributed to the expansion and interconnection of internal cracks within the coal sample under external loading, leading to significant localized fracturing. An analysis of the AE characteristic parameters reveals a marked increase in energy and cumulative count near the point of stress drop, indicating a strong correlation between these phenomena. The second form exhibits a steady increase in stress until it reaches its peak value without any subsequent decline. For uniform classification purposes, this type of peak stress is divided into three segments based on variations in the AE characteristic parameters. Specifically, two-thirds of the peak stress serves as an entry threshold for transitioning into the stable crack propagation stage (II). Beyond this threshold, AE energy displays noticeable fluctuations, while cumulative counts steadily increase, reflecting characteristics similar to those observed in the first form. Consequently, this interval leading up to peak stress is classified as part of the unstable fracture stage (III).
(4) As samples transition from the unstable fracture stage (III) to the post-peak stage (IV), the elastic energy stored prior to reaching the peak is rapidly released through cracks or other mechanisms. This results in a significant increase in both the number and cumulative count of large energy signals detected by AE. Concurrently, under continuous stress application, coal samples exhibit cyclic patterns characterized by stress concentration, crack propagation, localized failure, and subsequent energy release.

Relationships curves between stress, energy, cumulative count and loading time for different borehole parameters.
In summary, preceding substantial energetic events in coal samples are typically periods marked by fewer energetic occurrences. This phenomenon is primarily attributed to the accumulation of elastic energy that facilitates crack expansion and penetration before macroscopic failure occurs. Such observations indicate that large-scale failures (stress drops) in coal samples are precipitated by cumulative damage resulting from multiple cracks. Furthermore, when AE values demonstrate relative quiescence while their cumulative counts increase sharply, this serves as an indicator of impending instability or loss of stability in borehole coal sample formations.
Lack of shock b-value
The lack of shock b-value is defined as the slope of the amplitude distribution, serving as an effective parameter that indicates the fracture stage. The relationship between magnitude and frequency, proposed by Gutenberg and Richter, can be expressed as follows32,33:
where, M represents the earthquake magnitude, N(M) denotes the number of earthquakes with magnitudes exceeding M, and a and b are constants.
Numerous researchers have employed formula (1) to calculate the b value based on AE data collected during experiments. It is important to note that both the AE peak amplitude and the Richter magnitude of an earthquake are defined as logarithms of the maximum amplitude. To accurately apply formula (1) for calculating the b value, scholars34 have refined formula (1) as follows:
where, AdB is the peak amplitude of the AE events, N is the incremental frequency, a1 is the empirical constant, and b1 is the b value.
To minimize the influence of errors on the experimental results, a sliding average of 100 AE signals is employed to calculate the b value. By correlating stress‒time curves with b values, stress drop points are digitally aligned with the corresponding low points of b values, as shown in Fig. 18. The evolution pattern of b values indicates that prior to the initial decrease (point 1) in the Stress‒strain curve, relatively slow fluctuations in b values occur, indicating gradual and stable development of internal cracks. Upon reaching point 1 on the stress‒strain curve, an abrupt decrease in stress occurs, signifying a sudden macrofracture event within the sample. Simultaneously, there is a rapid decline in b values. Following point 1, both the frequency of fluctuations in b values and the number of AE events increase significantly, indicating rapid crack propagation at this stage. As testing progresses, the drop points on the stress‒strain curve of the coal sample strongly correspond to low b values, while most b values remain concentrated within the range of 0.3 to 0.9. Ultimately, upon sample failure, the b values decrease to their lowest point.

Relationships between the b value and loading time for different borehole parameters.
In summary, the occurrence of an instantaneous low b value indicates that the coal sample is approaching macrofracture or instability. When the b value reaches its lowest point, the coal sample has undergone final failure. Therefore, a sharp decline in the b value can be regarded as a precursor index for the instability of borehole coal sample. Additionally, strain energy is released rapidly with each macroscopic fracture in the borehole coal sample. Consequently, a sudden drop in the b value can also function as a predictive indicator for large-scale events.
Velocity tomography
Using P-wave velocity tomography imaging technology, the stress field of coal samples was inverted to facilitate an analysis of the spatial distribution and stress concentration of fracture events at each stage of coal sample fracturing. Considering that the borehole within the coal sample substantially affects positioning inversion, coal samples with optimal positioning effects were selected from a group with a row spacing of 10 mm. The spatial distribution of fracture events during each stage of coal sample fracturing is shown in Fig. 19.

Spatial distribution of fracture events at different stages of coal fracture.
During the compaction stage, only a limited number of fracture events were observed in the coal sample, with the majority exhibiting low energy levels. This indicates that the coal sample experienced minimal damage and that the initial scale of fracture was relatively small. As the system transitioned to the stable crack propagation stage, there was a significant increase in both the frequency and intensity of high-energy events. A considerable number of these high-energy events occurrences emerged near fracture events from the compaction stage, indicating an expansion and coalescence of fractures into larger fractures. Concurrently, an heightened density of event points was detected in the central region of the sample, indicating that pore-induced stress concentrations began to influence its fracturing process. Upon entering the unstable fracture stage, there was a marked decrease in fracture event frequency due to this stage’s relatively brief duration. However, high-energy events escalated rapidly during this period, particularly in areas previously characterized by dense fracturing activity and around borehole regions. This indicates that macroscopic fractures are developing within the coal sample, highlighting interconnections among damaged areas within existing fractures. The increased frequency and spatial clustering of high-energy events further indicate that the coal sample is approaching its peak stress threshold and approaching instability. In the post-peak stage, while instances of high-energy events diminished, there was an overall increase in fracture event frequency-culminating in ultimate destabilization of the coal sample.

Evolution characteristics of the wave velocity distribution.
The evolution characteristics of the wave velocity distribution area are shown in Fig. 20. From Fig. 20a, it is evident that the majority of the area exhibits low velocity, indicating that the pre-existing fractures in most regions are still undergoing closure. Small areas of high velocity can be observed in the central, right-central, and lower-left sections of the coal, indicating a higher density in these regions, likely attributed to stress concentration caused by the presence of boreholes. From Fig. 20b, as the loading process progresses advances into an unstable fracture stage, there is a noticeable increase in the number of high-velocity regions. Notably, high-velocity regions previously identified in both the lower-left and right-central regions have shifted the center, with a significant high-velocity region forming centrally. This indicates an emergence of high-stress concentration at this location due to stress redistribution around two rows of boreholes. From Fig. 20c, there is a marked reduction in low-velocity regions while high-velocity regions have consolidated into a large central region. The prominent high-velocity area is centered around the left double row of boreholes, indicating a state of elevated stress concentration within this vicinity. Finally, the low-velocity area has expanded, and the high-velocity region has significantly decreased, indicating that energy release has occurred, leading to reduced stress concentration.
In summary, the entire process of damage and destruction to coal samples induced by boreholes can be expressed by the presence of these boreholes, which accelerates the expansion and connectivity of localized fracture events. This phenomenon subsequently triggers additional local fractures, ultimately resulting in a state of overall instability.
Conclusion
The influence of borehole parameters (diameter, spacing, and row spacing) on coal sample damage was investigated through laboratory experiments and numerical simulations. Additionally, the characteristics of precursor signals during coal sample instability were identified. These research findings enhance the understanding of the pressure relief process associated with large-diameter boreholes and provide theoretical support for the selection and optimization of large-diameter borehole parameters. The specific research outcomes are summarized as follows:
(1) Large-diameter boreholes can effectively release the elastic energy accumulated in coal samples and achieve a significant pressure relief effect. The pressure relief efficiency of large-diameter boreholes can be significantly enhanced with an increase in borehole diameter and a reduction in borehole row spacing. However, the influence of borehole spacing on pressure relief requires careful optimization and reasonable adjustment to ensure optimal results.
(2) After drilling, the coal sample transitions from a brittle state to a more ductile one, which consequently diminishes the impact resistance properties of the coal sample. The influence of borehole on coal sample damage is predominantly characterized by shear cracks, with minimal effect observed on tensile cracks.
(3) The borehole plays a significant role in controlling the initiation and propagation of fractures within the coal sample. The instantaneous drop in the b-value of AE indicates the occurrence of macroscopic failure, while reaching the minimum b-value signifies the final destruction of the coal sample. The high stress concentration around the borehole can facilitate local fracture convergence and connectivity, thereby accelerating the destabilization process leading to failure.
Data availability
The datasets used and analysed during the current study available from the corresponding author on reasonable request.
References
Dou, L. M., Cai, W., Cao, A. Y. & Guo, W. H. Comprehensive early warning of rock burst utilizing microseismic multi-parameter indices. Int. J. Rock. Mech. Min. Sci. 28 (5), 767–774 (2018).
Bukowska, M. The probability of rockburst occurrence in the upper Silesian coal basin area dependent on natural mining conditions. J. Min. Sci+. 42 (6), 570–577 (2006).
Yang, F., Lin, H. X., Shen, L. Y., Yan, A. Z. & Wu, Y. J. Water Inrush Mechanism of Karst Collapse Column in Coal Seam Floor Based on a Variable Mass Seepage Mechanical Model. Geofluids. 8148203 (2022).
Zhang, M. & Jiang, F. X. Rock burst criteria and control based on an abutment-stress-transfer model in deep coal roadways. Energy Sci. Eng. 8 (8), 2966–2975 (2020).
Mottahedi, A. & Ataei, M. Fuzzy fault tree analysis for coal burst occurrence probability in underground coal mining. Tunn. Undergr. Sp Tech. 83, 165–174 (2019).
Gong, F. Q., He, Z. C. & Jiang, Q. Internal mechanism of reducing rockburst proneness of rock under high stress by real-time borehole pressure relief. Rock. Mech. Rock. Eng. 55 (8), 5063–5081 (2022).
Li, X. S., Wang, Q., Wu, K. B., Wang, J. M. & Qi, Q. X. Microscopic fracture evolution and propagation mechanism of coal with high coal burst liability. Theor. Appl. Fract. Mec. 130, 104331 (2024).
Zhang, H., Li, T., Ouyang, Z. H., Liu, S. & Yi, H. Y. Research on optimization of coal pressure relief borehole parameters under high-stress conditions. Geofluids. 1–13 (2021).
Peng, C. & Liu, W. R. Study on pressure relief effect of rock mass with different borehole parameters. Adv Civ Eng. 1–15 (2021).
Chen, M. et al. Experimental investigation on pressure relief mechanism of specimens with prefabricated reaming boreholes. Rock. Mech. Rock. Eng. 56, 2949–2966 (2023).
Hu, X. C. et al. Experiment on rockburst process of borehole and its acoustic emission characteristics. Rock. Mech. Rock. Eng. 52, 783–802 (2019).
Lu, J., Gong, P. L. & Li, P. Research on the mechanism of floor heave and borehole pressure relief technology in deep soft rock roadway. Min. Saf. Environ. Prot. 46 (06), 35–41 (2019). (In Chinese).
Ma, B. W., Deng, Z. G., Zhao, S. K. & Li, S. G. Analysis on mechanism and influencing factors of drilling pressure relief to prevent rock burst. Coal Sci. Technol. 48 (05), 35–40 (2020). (In Chinese).
Zhang, Y., Yin, L. D., Zhang, J. P., Yang, C. C. & Li, J. J. Numerical study on energy dissipation mechanism of high stress tunnel borehole under dynamic disturbance. J. Saf. Sci. Technol. 19 (09), 61–68 (2023). (In Chinese).
Zhang, D. X. et al. Influence of coal seam thickness on pressure relief and energy release mechanism of large-diameter drilling hole. Coal Sci. Technol. 52 (06), 40–50 (2024). (In Chinese).
Hao, C. B., Hou, Z. Y., Xiao, F. K. & Liu, G. Experimental study on influence of borehole arrangement on energy conversion and acoustic characteristics of coal-like material sample[J]. Shock Vib. 1–15 (2020).
Dai, L. P. et al. Parameter design method for destressing boreholes to mitigate roadway coal bursts: theory and verification. Rock. Mech. Rock. Eng. 57 (11), 9539–9556 (2024).
Yin, Y. C. et al. Drill cuttings test of coal under different stresses and characteristics of coal particle distribution during borehole collapse. Processes 13 (2), 499 (2025).
Zhao, T. B., Guo, W. Y., Yu, F. H. & Tan, Y. L. Numerical investigation of influences of borehole arrangements on the mechanical behavior and energy evolution of coal models. Adv. Civ. Eng. 2018 (3), 1–12 (2018).
Li, Y. P., Sun, D. Q., Zhao, S. K. & Liang, K. H. Investigation of pressure relief borehole effects using in situ testing based on distributed optical fibre sensing technology. Adv. Civ. Eng. 2021 (11), 1–11 (2021).
Zhang, S. C., Li, Y. Y., Shen, B. T., Sun, X. Z. & Gao, L. Q. Effective evaluation of pressure relief borehole for reducing rock bursts and its application in underground coal mines. Int. J. Rock. Mech. Min. Sci. 114, 7–16 (2019).
Cui, F., Zhang, S., Chen, J. Q. & Jia, C. Numerical study on the pressure relief characteristics of a Large-Diameter borehole. Appl. Sci. 12 (16), 7967 (2022).
Wang, M., Wang, X. Y. & Xiao, T. Q. Borehole destressing mechanism and determination method of its key parameters in deep roadway. J. China Coal Soc. 42 (05), 1138–1145 (2017) (In Chinese).
Itasca, U. D. E. C. User’s Manual. Itasca consulting group, inc (2014).
Gao, F. Q., Stead, D., Kang, H. P. & Wu, Y. Z. Discrete element modelling of deformation and damage of a roadway driven along an unstable goaf-A case study. Int. J. Coal Geol. 127, 100–110 (2014).
Gao, F. Q., Stead, D. & Coggan, J. Evaluation of coal Longwall caving characteristics using an innovative UDEC trigon approach. Comput. Geotech. 55, 448–460 (2014).
Gao, F. Q. & Stead, D. The application of a modified Voronoi logic to brittle fracture modelling at the laboratory and field scale. Int. J. Rock. Mech. Min. Sci. 68, 1–14 (2014).
Li, X. H., Ju, M. H., Yao, Q. L., Zhou, J. & Chong, Z. H. Numerical investigation of the effect of the location of critical rock block fracture on crack evolution in a gob-side filling wall. Rock. Mech. Rock. Eng. 49, 1041–1058 (2016).
Zhang, H. et al. Numerical investigation on crack development and energy evolution of stressed coal-rock combination. Int. J. Rock. Mech. Min. Sci. 133, 1365–1609 (2020).
Hoek, E. & Martin, C. D. Fracture initiation and propagation in intact rock-a review. J. Rock. Mech. Geotech. 6 (4), 287–300 (2014).
Hoek, E. & Brown, E. T. Practical estimates of rock mass strength. Int. J. Rock. Mech. Min. Sci. 34 (8), 1165–1186 (1997).
Gutenberg, B. & Richter, C. F. Frequency of earthquakes in California. B Seismol. Soc. Am. 34 (4), 185–188 (1944).
Zhang, H. et al. Microseismic comprehensive evaluation method for coal burst: a case study in the Zhaolou coal mine. Sci. Rep. 14 (1), 15588 (2024).
Niu, Y., Zhou, X. P. & Zhou, L. S. Fracture damage prediction in fissured red sandstone under uniaxial compression: acoustic emission b-value analysis. Fatigue Fract. Eng. M. 43 (1), 175–190 (2020).
Acknowledgements
We gratefully wish to acknowledge Sponsors of the Natural Science Foundation of Henan (242300420353, 252300421472), Research Project on Science and Technology of Nanyang City (24KJGG018, 24KJGG066), Basic and Frontier Technology Research Project of Nanyang City (23JCQY2014).
Author information
Authors and Affiliations
Contributions
C.-J.S.: Conceptualization, methodology, visualization, formal analysis, writing—original draft preparation; G.-J.L.: Project administration, methodology, formal analysis, writing-review and editing; J.-C.Z.: Conceptualization, validation, methodology, supervision, writing—original draft preparation; H.Z.: Data curation, funding acquisition, investigation; W.-Y.L.: Formal analysis, visualization, validation, , funding acquisition; Y.-D.X.: Validation, supervision; J.-Q.W.: Investigation, validation.
Corresponding authors
Ethics declarations
Competing interests
The authors declare no competing interests.
Additional information
Publisher’s note
Springer Nature remains neutral with regard to jurisdictional claims in published maps and institutional affiliations.
Rights and permissions
Open Access This article is licensed under a Creative Commons Attribution-NonCommercial-NoDerivatives 4.0 International License, which permits any non-commercial use, sharing, distribution and reproduction in any medium or format, as long as you give appropriate credit to the original author(s) and the source, provide a link to the Creative Commons licence, and indicate if you modified the licensed material. You do not have permission under this licence to share adapted material derived from this article or parts of it. The images or other third party material in this article are included in the article’s Creative Commons licence, unless indicated otherwise in a credit line to the material. If material is not included in the article’s Creative Commons licence and your intended use is not permitted by statutory regulation or exceeds the permitted use, you will need to obtain permission directly from the copyright holder. To view a copy of this licence, visit http://creativecommons.org/licenses/by-nc-nd/4.0/.
About this article

Cite this article
Shao, C., Liu, G., Zhou, J. et al. Research on the impact of borehole parameters on the instability and precursor characteristics of large diameter borehole in coal seam. Sci Rep 15, 14712 (2025). https://doi.org/10.1038/s41598-025-99829-5
Received:
Accepted:
Published:
Version of record:
DOI: https://doi.org/10.1038/s41598-025-99829-5
