
Abstract
With the rapid development of China’s civil aviation industry, the Beijing-Tianjin regional multi-airport system faces challenges such as route homogenization and low resource utilization efficiency. This paper evaluates selected routes operated by Beijing Capital Airport, Daxing Airport, and Tianjin Airport by comprehensively considering both operational level and efficiency. First, an improved entropy-TOPSIS model is applied to analyze the operational level of the airline routes. Next, a three-stage DEA model is used to evaluate the operational efficiency of the routes after removing the influence of environmental factors. Finally, based on the above evaluation results, a two-dimensional classification framework of ' operational level-operational efficiency ' is established to classify each airport route, and differentiated optimization suggestions are proposed for different types of routes. The results show that some routes with high operational levels have relatively low efficiency, while others with lower operational levels exhibit higher resource utilization. We provide scientific guidance for optimizing route resource allocation within the multi-airport system and offers recommendations for coordinated airport development.
Introduction
With the rapid development of China’s civil aviation industry, the multi-airport system in the Beijing-Tianjin region has gradually become an important support for regional air transportation. However, one of the main challenges currently faced by this multi-airport system is the homogenization of air routes, which leads to vicious competition among airports and reduces the efficiency of resource utilization1. The airport cluster in the Beijing-Tianjin region suffers from significant resource waste and market overlap, particularly due to the lack of clear functional differentiation among airports, resulting in a limited synergistic effect of the overall system2. This situation not only hinders the optimal development of the multi-airport system but also impedes the realization of regional transportation integration goals3.
Effective management and optimization of regional air transportation systems are key to enhancing national economic competitiveness4. Compared to mature multi-airport systems in other countries, China’s multi-airport systems still face numerous challenges in terms of resource allocation and collaborative management5. These issues have prompted us to conduct an in-depth study on how to improve the overall operational efficiency of the multi-airport system, aiming to enhance service quality and competitiveness through reasonable route distribution and efficient resource utilization.
Studies have shown that the rational distribution of air routes and the scientific positioning of airport functions are crucial for the success of multi-airport systems6. Many mature multi-airport systems abroad have achieved increased operational efficiency and reduced competition and resource waste through clear functional positioning and route planning among airports7. In contrast, due to a lack of clear functional differentiation, China’s multi-airport systems often suffer from overlapping routes and insufficient utilization of flight slot resources8. Therefore, exploring an optimization method suitable for China’s multi-airport systems is of great practical significance.
Against this backdrop, this study aims to conduct a comprehensive analysis and evaluation of the alignment of route functions, operational performance, and operational efficiency of the multi-airport system in the Beijing-Tianjin region using an improved entropy weight method, TOPSIS, and a three-stage DEA model. Through this approach, we aim to identify paths to enhance the synergistic effects of the airport cluster, providing scientific decision-making support for policymakers and promoting the optimization of regional air transport resources.
The key features of this study are reflected in the following aspects: First, by combining the improved entropy weight method and TOPSIS, the weight of each indicator in the multi-attribute decision-making process can be objectively determined, minimizing the influence of subjective factors9,10. Secondly, the innovation of this study lies in the methodological approach of analyzing the operational performance and operational efficiency of hub airport routes separately, rather than conflating these two aspects as seen in previous studies. By assessing the operational performance and efficiency of routes separately, this study provides more precise insights into the strengths and weaknesses of different routes, enabling more targeted optimization suggestions.
Through the comprehensive analysis of the routes at the three major airports in the Beijing-Tianjin region, this study identifies routes that are misaligned with the development positioning of the airports, with poor operational performance and low efficiency, providing a scientific basis for optimizing resource allocation and improving overall efficiency. Moreover, this study hopes to provide a reference for other multi-airport systems in different regions, helping achieve coordinated development between airports, avoid resource wastage, and enhance the overall competitiveness of regional air transportation systems11.
We proposed an innovative comprehensive evaluation method to address the issue of route homogenization in the Beijing-Tianjin multi-airport system, aiming to improve the overall operational efficiency and synergy of the system. By providing a detailed introduction to the research background, significance, and methodologies, this study hopes to offer new perspectives and solutions for the development and management of regional multi-airport systems.
The remainder of this paper is structured as follows:
Section 2 reviews the relevant literature on multi-airport systems and methodologies for evaluating route operational efficiency. Section 3 presents the methodology, detailing the improved entropy-TOPSIS model and the three-stage DEA model, along with the data collection process. Section 4 provides the results, including the classification of routes based on operational level and efficiency. Finally, Sect. 5 concludes the paper by summarizing the key findings, offering recommendations for optimizing route allocation in the Beijing-Tianjin multi-airport system, and discussing future research directions.
Literature review
For airlines, air routes are the foundation of their survival, and rational planning and arrangement of routes are crucial for improving operational efficiency. For airports, the proper allocation of routes is key to enhancing the utilization rate of airport resources. Therefore, evaluating and analyzing airport service routes to identify those that do not align with airport development goals and have poor operational performance and efficiency is essential for optimizing and adjusting route resources.
Route evaluation methods
In the area of route evaluation, scholars both domestically and internationally have proposed a variety of methods, which mainly include multi-criteria decision-making methods, optimization models, and hybrid approaches.
Multi-criteria decision-making methods, such as Analytic Hierarchy Process (AHP) and Technique for Order Preference by Similarity to an Ideal Solution (TOPSIS), have been widely applied in route evaluation. Guo proposed a route evaluation method for drone reconnaissance based on a spatiotemporal attention mechanism, which utilizes spatial and temporal data to improve the accuracy of route selection12. Yu Geng proposed a fuzzy multi-criteria decision-making method to effectively address the uncertainties involved in route evaluation13. Feng Yu used an entropy-weighted TOPSIS method to evaluate 12 air transport network nodes in Xinjiang based on connectivity, service quality, operational scale, and future development, providing an important reference for future network planning14. Zhang Jing used an entropy-weighted TOPSIS method to evaluate the military transport capacity of 27 domestic ports, demonstrating the reliability and effectiveness of TOPSIS in multi-criteria decision-making10.
Determining the weight of indicators is a crucial step in route evaluation as it directly impacts the objectivity and scientific validity of the results. The weight determination methods are generally categorized into subjective and objective approaches. Subjective approaches, such as AHP and expert judgment, rely on experts’ knowledge and experience, which may introduce biases15. To overcome this, many studies employ objective methods, such as Principal Component Analysis (PCA) and the Entropy Weight Method. For example, some studies used PCA to determine the weights in route evaluation, thereby reducing the influence of human factors on the results16.
In addition to TOPSIS, optimization models have also made significant progress in route evaluation in recent years. Some studies have used genetic algorithms and particle swarm optimization to optimize route planning and selection17,18, which have shown great potential in handling large-scale data and complex optimization problems.
Hybrid methods have also been applied to route evaluation. Muhammet et al. combined fuzzy logic with the TOPSIS method to evaluate the new aspects for new route feasibility, achieving good results19. By integrating the strengths of various methods, hybrid approaches help provide a more comprehensive and systematic evaluation of routes from multiple perspectives.
Efficiency evaluation methods
In recent years, researchers have extensively studied airport efficiency from an input-output perspective, with Data Envelopment Analysis (DEA) and its variants becoming the core methods for evaluating airport efficiency.
From the perspective of airport operational efficiency, on the one hand, some researchers have analyzed and evaluated airport operational efficiency20,21 and its influencing factors23,24,25,32 from the perspective of airport operation, considering factors such as runways, gates, number of employees, operating costs, and macroeconomics22,26. On the other hand, some researchers have adopted more complex models to conduct in-depth research on the internal influencing mechanisms of airport efficiency. Liu et al. used a two-stage DEA model to study the impact of high-speed rail development on airport technical efficiency27. Jiang et al.28, Pei Guolin et al.29, and others employed a three-stage DEA model to evaluate airport operational efficiency, analyzing the technological spillover effects of small and medium-sized airports and the reasons for low airport efficiency respectively. Fan Huanli et al. constructed a DEA cross-efficiency model based on non-cooperative game theory to analyze the operational efficiency of 22 airports in China30. Xu Aiqing et al. introduced a temporal dimension to the existing network DEA model, establishing a multi-period dynamic network DEA efficiency evaluation model to analyze efficiency changes in different periods and reveal the dynamic evolution law of airport operational efficiency31.
From the perspective of air network operational efficiency, Deng Zhi used a DEA-Tobit model to evaluate the operational efficiency of airline networks, concluding that increasing market share and passenger load factors could enhance the overall efficiency of airline networks33. Shao Y et al. developed a multi-period network DEA model to analyze the route efficiency of 82 airports, providing empirical support for route optimization and efficiency improvement34. YC Chiou et al. used the DEA method to evaluate the operational efficiency of routes in Taiwan from multiple dimensions, including cost efficiency, service quality, and cost-effectiveness, providing valuable references for optimizing routes and resource allocation in airports35.
In terms of the innovative development of efficiency evaluation models. On the one hand, traditional DEA models have been continuously upgraded and optimized. For example, in response to the problem of large-volume data, Chu et al.36 designed a DEA environmental efficiency assessment program applicable to massive data. Lahdelma et al.37 combined the DEA model with SMAA to enhance the DEA model’s ability to handle uncertain data, enabling it to provide stochastic efficiency measures. With the advancement of data collection and storage technologies, enterprises and organizations have amassed a vast amount of data. Big-data-based efficiency analysis methods can integrate multi-source heterogeneous data, such as production process data, market transaction data, environmental monitoring data, etc., to comprehensively evaluate efficiency. For instance, Wu38 proposed a dynamic environmental performance evaluation model based on real -time big data and DEA. In supply chain management, big - data analysis can be used to monitor the operation of each link in real - time, such as regional energy efficiency39 and transportation management40, thus improving the overall operational efficiency. Badiezadeh41 utilized big-data methods to develop a network DEA model for calculating optimistic and pessimistic efficiencies in supply chain performance evaluation. In addition, to handle ratio - formatted data, some researchers have established DEA models for ratio data in their analyses. Soltanifar42 proposed an inverse DEA model for merger analysis to deal with DEA - R models in the presence of negative ratio data.
On the other hand, the SFA model has been increasingly and widely applied in efficiency evaluation due to its high sensitivity and accuracy. For example, Liu et al.43. used the SFA - Tobit panel model to evaluate the industrial water use efficiency of each province in China from 2003 to 2021. Alimhanova44 employed the SFA parametric approach, taking into account the parameters of enterprise performance efficiency, to develop a dynamic model for enterprise revenue management. Luo45 proposes a new method based on multi-LCA and country-specific SFA. This model can assess the potential environmental benefits of recycling by modeling the typical recycling systems and two recycling technology routes for used power batteries.
In summary, the field of efficiency evaluation is experiencing vibrant development. The continuous evolution of traditional DEA models, such as enhanced capabilities in handling large - volume data, uncertain data, and ratio - formatted data, showcases its adaptability and extensibility. The SFA model, on the other hand, has been widely applied due to its high sensitivity and accuracy. Additionally, emerging big - data - based efficiency analysis methods are integrating multi-source data to provide a more comprehensive evaluation. These developments not only enrich the toolbox for researchers in efficiency evaluation but also offer more accurate and detailed perspectives for various industries to assess and improve their efficiency, ultimately promoting sustainable development across different sectors.
The SFA model decomposes random errors and technical inefficiency to reduce interference from non-efficiency factors, but its ability to handle environmental factors is limited. In contrast, the three-stage DEA model, although more procedurally complex, offers the following advantages: First, it handles environmental factors more effectively. In the second stage, SFA is used to separate environmental factors and random errors, followed by DEA analysis in the third stage, making the results more reflective of the management level of decision-making units29. Second, the model offers greater flexibility in specification. It does not require a predefined production function and is based on linear programming for relative efficiency analysis, with less stringent data requirements and stronger adaptability. In comparison, SFA imposes strict requirements on the specification of the production function54, and incorrect or inappropriate specification can directly affect the accuracy of the results. Third, it enables quantitative analysis of environmental factors. In the second stage, SFA can visually demonstrate the extent to which environmental variables affect efficiency, facilitating researchers’ in-depth analysis of the mechanisms of different environmental factors and enabling more detailed efficiency deconstruction.
Therefore, given the mentioned advantages, the three-stage DEA model is more widely applied in efficiency evaluations where the influence of environmental factors needs to be eliminated. Many researchers have achieved favorable results using this model in efficiency calculations related to airports, ports, road traffic, and other fields, effectively demonstrating its robustness and validity in efficiency analysis. For instance, Wei et al.50 employed the three-stage DEA model to measure airport passenger efficiency and analyzed the impact of high-speed rail as an environmental factor on civil aviation passenger efficiency. Lyu et al.51 and Wang et al.52 applied the three-stage DEA model to assess the transportation efficiency of urban rail transit and examined the varying degrees of influence exerted by different environmental factors on efficiency. Du et al.53 utilized the three-stage DEA model to eliminate environmental variables and evaluate the efficiency of major ports along the Yangtze River trunk line. Similarly, Li et al. adopted this method to investigate the effects of different environmental factors on the operational efficiency of urban bus systems.
Research gaps and contributions of this study
Although significant progress has been made in the evaluation of route and airport efficiency, some research gaps and issues remain. Firstly, most studies have focused on the overall efficiency of airports or airlines, with relatively few studies on the operational efficiency of specific routes, especially concerning the alignment between routes and airport functional positioning. Furthermore, traditional DEA models, while capable of evaluating overall efficiency, are influenced by management, environmental factors, and random errors, making it challenging to accurately reflect controllable management efficiency. Therefore, it is necessary to adopt improved models that can remove the influence of environmental variables to provide more accurate and targeted evaluation results.
To fill these gaps, this study adopts a three-stage DEA model to eliminate the influence of environmental factors and place all routes under the same conditions, thereby providing a more accurate assessment of route operational efficiency. In addition, a multi-dimensional evaluation is conducted from two perspectives: route operational level and operational efficiency.
Summary of Research Contributions
This study aims to fill the research gaps, with contributions as follows:
Innovative Integration of Improved Entropy-TOPSIS and Three-Stage DEA Models:
This study systematically integrates an improved entropy-weighted TOPSIS method with a three-stage DEA model to comprehensively evaluate the operational level, alignment with airport positioning, and operational efficiency of airport service routes. The entropy-weighted TOPSIS method is used to assess route performance and alignment with airport goals, providing a foundation for subsequent efficiency analysis. The three-stage DEA model is then used to eliminate the effects of environmental factors and random noise, ensuring the accuracy and feasibility of operational efficiency evaluation.
Multi-Level Comprehensive Evaluation Framework:
This study constructs a comprehensive evaluation framework that includes two dimensions: the operational level of airline routes and their operational efficiency. Through this framework, a more comprehensive evaluation and classification of airport routes can be achieved. It helps to identify the comprehensive capabilities and development potential of routes, and also provides airport managers with more precise optimization directions. Consequently, it can enhance the operational level of airports and the efficiency of resource utilization.
Fine-Grained Analysis of Specific Routes:
Different from previous studies that mainly focused on the overall efficiency of airports, this study focuses on the efficiency analysis of specific routes. It conducts a comprehensive evaluation and classification of these routes, proposes targeted optimization suggestions based on the classification results, and offers support for rational resource allocation. This refined analysis helps to enhance the synergy effect of the airport group, enhance the pertinence of optimization, and improve the overall operational efficiency.
In summary, this study aims to analyze and evaluate airport service routes through more accurate and comprehensive methods, providing a scientific basis and practical reference for improving the operational efficiency of airport clusters and optimizing route resource allocation. The process of route comprehensive evaluation and classification is shown in Fig. 1.
Despite the significant progress made in route evaluation and airport efficiency assessment, there are still some research gaps. Firstly, most existing studies focus on evaluating the overall efficiency of airports or airlines, while there are relatively few studies on the operational efficiency of specific routes. Moreover, the evaluation results of traditional DEA models include the influence of management factors, environmental factors, and random errors. For airport management, management factors are adjustable, making it necessary to remove the interference of environmental variables and obtain efficiency evaluations that are management-based. To address this gap, this study adopts a three-stage DEA model that removes the effects of environmental factors, allowing all routes to be evaluated under consistent environmental conditions for a more accurate assessment of route operational efficiency.
Research framework
In conclusion, to evaluate airport service routes more accurately and comprehensively, this study conducts a multi-faceted analysis and assessment from two angles: operational level and operational efficiency. First, an improved Entropy-TOPSIS method is used to evaluate the operational level of airport service routes. Then, a three-stage DEA model is employed to assess the operational efficiency of routes. Finally, based on the above evaluation results, a two-dimensional classification framework of ' operational level-operational efficiency ' is established to classify each airport route, and differentiated optimization suggestions are proposed for different types of routes. The evaluation results provide a scientific basis for the subsequent targeted optimization of airport service routes and flight resources.
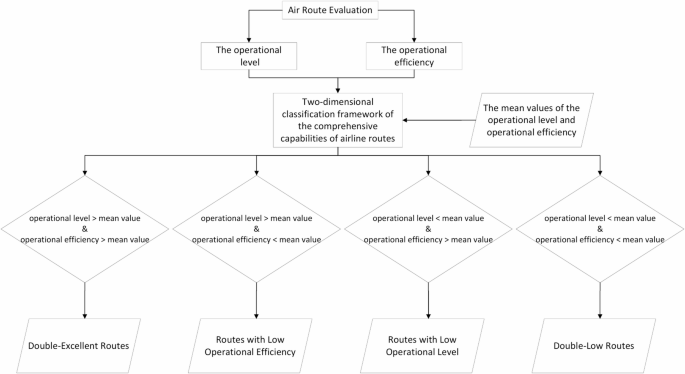
Air Route Evaluation.
Data and methodology
Methodology
Evaluation of route operational level
In this section, a multi-attribute decision-making method will be adopted to evaluate the operation level of airline routes from the perspectives such as the degree of conformity with the functional positioning of airport routes, the convenience of passenger travel, and the transportation capacity of routes, so as to reflect the operation quality and service capability of the routes. To improve the accuracy of the evaluation results, the improved entropy weight method will be first used to determine the index weights, and then the TOPSIS method based on orthogonal projection will be applied to evaluate and rank the operation levels of the airline routes. The specific process is as follows.
Indicator system for route operational performance evaluation model
Different airports have varying levels and functional positioning based on their development goals and development levels. To ensure that route evaluations align more closely with the developmental positioning of the respective airports, this study classifies major hub airports in China according to Jiao’s research46. as shown in Table 1.
The primary function of international hub airports is to enhance their competitiveness as international hubs. To achieve this goal, it is essential to increase the number of international destinations while reducing flights connecting to non-hub domestic airports. The function of composite hub airports is to strengthen their role as gateways to specific countries or regions and as international hubs. Therefore, these airports should increase routes to specific countries and regions while reducing flights to non-hub airports. The role of regional hubs is to serve as core hubs for specific regions, meeting passenger demand from non-hub airports to hub airports and strengthening connections with other hub airports.
The evaluation index system in this chapter is divided into three layers: the target layer, the criterion layer, and the indicator layer. Combined with the summary of the route evaluation indicators in the existing research47,48,39, the evaluation indicators that can measure the alignment with airport functional positioning, passenger convenience and route transportation capacity of the route are mainly selected to comprehensively evaluate the operation level of the route. Additionally, considering the different functional positioning of Tianjin Airport compared to Beijing Capital Airport and Daxing Airport, two sets of evaluation index systems have been established39,48: one for international hub airports and the other for regional hub airports, as shown in the Table 2 below.
The positioning alignment indicators for airports evaluate whether a route aligns with the functional development positioning of the airport. For the functional positioning of served airports: For international hub airports, higher-level airports as destinations have higher alignment scores, indicating greater suitability for the development positioning. For regional hub airports, the goal is to strengthen their role as a core hub in a specific region, so higher scores are assigned when the served destination is a non-international hub airport. Route Category: Based on the developmental positioning of the departing airport, different values are assigned to various types of routes.
Passenger Travel Convenience measures whether a route can effectively facilitate passenger travel. Flight Punctuality Rate: A higher punctuality rate indicates higher operational efficiency, moderate congestion, and a rational airspace structure. Airspace Connectivity of Destination Airport: The more connections an airport has, the more convenient it is for passengers to transfer at that destination. Weekly Flight Frequency on Route: Reflects the frequency of operations on the route. Higher frequency allows greater flexibility for passengers to arrange travel or reschedule, enhancing travel convenience.
Route Transport Capacity is measured from three perspectives: passenger volume, load factor, and passenger competitiveness on the route. Annual Passenger Volume: A higher annual passenger volume indicates greater demand for the route. Load Factor: A lower load factor indicates a lower level of route operational performance, which may result in a waste of airport resources. Route Passenger Competitiveness: Assesses the competitiveness of passengers on the route based on travel costs, particularly in light of the increasing competition from high-speed rail, which impacts some short- and medium-haul routes.
Through the above analysis, it can be seen that the eight evaluation indicators selected in this paper are all positive indicators. In other words, the larger the value of the indicator, the better the performance of the route in the corresponding dimension, the more it conforms to the development objectives of airport routes, and the higher the operational level of the route.
Weight calculation of evaluation indicators based on improved entropy weight method
At present, the subjective evaluation method and the objective evaluation method are the main methods for determining the index weights. Among them, the subjective evaluation method is a method that relies on the professional knowledge and personal judgment of the evaluators to allocate the index weights, including the analytic hierarchy process, the experience judgment method, etc. This method is overly subjective and is carried out based on personal opinions and experiences, making it difficult to fully analyze the information carried by the original data itself. The objective evaluation method is a quantitative analysis method. It obtains the corresponding weights through a series of calculations and derivations of the data of the indicators themselves. The main methods include the principal component analysis method, the factor analysis method, the entropy weight method, etc. This paper aims to objectively and accurately evaluate the operation levels of the routes of each airport. Therefore, the entropy weight method is adopted to determine the index weights.
The entropy weight method calculates the weight of each indicator by computing the information entropy of each indicator, which determines the weight based on its importance within the comprehensive evaluation system. A smaller information entropy value indicates a greater degree of dispersion for the indicator. This also indicates that the impact of this index is greater, and its weight is also larger.
In the classical entropy weight method, a problem arises when assigning weights based on information entropy: when the entropy value approaches 1, the numerator in the corresponding weight calculation formula becomes very close to zero, increasing the sensitivity of the calculation. This makes the result less reasonable and stable in practical applications. To address this issue, this study optimizes the traditional entropy weight method49, resulting in more stable and accurate indicator weights. The detailed calculation steps are shown in the Appendix 1.
Route evaluation based on the orthogonal projection TOPSIS method
After obtaining the weights of each indicator using the improved entropy weight method, this paper continues to use the TOPSIS method to comprehensively evaluate and rank the routes.
The TOPSIS method is a method for ranking evaluation objects according to their proximity to the idealized target. This method first obtains the positive ideal solution and negative ideal solution among the evaluation objects. Then, it calculates the Euclidean distances from each evaluation object to the positive and negative ideal solutions one by one, and ranks the evaluation objects based on the calculation results. However, when the distances from a certain evaluation object to the positive and negative ideal solutions are the same, the traditional TOPSIS method is difficult to accurately reflect the advantages and disadvantages of the solution. Therefore, this paper uses the TOPSIS method based on orthogonal projection to comprehensively evaluate the studied routes, and the process is as follows:
-
(1)
Establishing the Normalized Matrix
The normalized matrix is calculated as:
where \(X={{(x}_{ij})}_{n\times m}\) represents the initial evaluation index matrix, and \(V={{(v}_{ij})}_{n\times m}\) represents the normalized evaluation index matrix.
-
(2)
Weighted Matrix
The weighted matrix is computed as:
where \(R={{(r}_{ij})}_{n\times m}\) represents the weighted normalized matrix, and \({\omega}_{j}\) represents the weight of index j, which is obtained using the improved entropy weight method.
-
(3)
Ideal Solution
The positive ideal solution is determined as follows:
The set of ideal solutions is \({S}^{+}=\left\{{S}_{j}^{+}|j=\text{1,2},3,\cdots,m\right\}\), where \({S}_{j}^{+}\) is the positive ideal solution of index j.
-
(4)
Translation Matrix
The translation matrix is calculated by shifting the weighted matrix as follows:
where \(T={\left({t}_{ij}\right)}_{n\times m}\) represents the matrix obtained after translating the weighted matrix so that the ideal solution becomes the origin of the coordinate axis. After translation, the ideal solution coordinates are \(\left\{\text{0,0}\cdots0\right\}\).
-
(5)
Translated Negative Ideal Solution
The translated negative ideal solution is determined as follows:
The set of translated negative ideal solutions is \({S}^{-{\prime}}=\left\{{S}_{j}^{-{\prime}}|j=\text{1,2},3,\cdots,m\right\}\).
-
(6)
Distance Calculation
Let the ideal solution coordinates be \(A=\left\{{S}_{1}^{+},{S}_{2}^{+},{S}_{3}^{+}\cdots{S}_{n}^{+}\right\}=\left\{\text{0,0}\cdots0\right\}\) and the negative ideal solution coordinates be \(B=\left\{{S}_{1}^{-{\prime}},{S}_{2}^{-{\prime}},{S}_{3}^{-{\prime}}\cdots{S}_{n}^{-{\prime}}\right\}\). The coordinates of the i route are \({T}_{i}=\left\{{t}_{i1},{t}_{i2},{t}_{i3}\cdots{t}_{im}\right\},(i=\text{1,2},3\cdots n)\) The distance between the iii-th route and the ideal solution is calculated as:
\({D}_{i}\) represents the distance between the i route and the ideal solution. The smaller the value of \({D}_{i}\), the higher the performance level of the route.
Evaluation of route operational efficiency
Route operational efficiency is an indicator used to measure the ratio between the input provided by airports for route operations and the actual output achieved. The operational efficiency of a route reflects the transport level of various routes as well as their efficiency in utilizing airport resources. This helps airports understand the status of resource utilization, promptly identify routes with inefficient resource use, and provides a reference for optimizing resource allocation. It contributes to improving the sustainable development capacity of airports and airlines, enabling efficient use of flights, personnel, and time slots, thereby enhancing the level of civil aviation transport.
This section evaluates route operational efficiency from the perspective of input-output analysis. Finally, by combining the evaluation results of operational levels, we select routes with low alignment in terms of airport functionality, operational level, and operational efficiency, providing a foundation for optimizing the allocation of route resources in airport clusters.
Data envelopment analysis (DEA)
Data Envelopment Analysis (DEA) is a mathematical model based on linear programming, commonly used to evaluate the relative efficiency of similar types of projects with comparable input and output. In this paper, the SBM (Slack-Based Measure) model in DEA is used to evaluate the operational efficiency of airline routes. First, this model is non-radial, allowing it to flexibly handle proportional changes in inputs and outputs. Second, it considers slack improvements in inefficiency, enabling a more accurate identification and treatment of potential efficiency losses. Lastly, the SBM model can measure non-oriented efficiency, identifying deficiencies in both inputs and outputs.
When evaluating the operational efficiency of airport routes, factors such as the economic development level and population size of the destination city vary, which are environmental factors that influence the evaluation of route operational efficiency. To objectively and accurately evaluate route operational efficiency, these environmental factors need to be excluded. We adopt a three-stage DEA model based on the SBM approach to evaluate route operational efficiency. The steps are as follows:
Steps for evaluating route operational efficiency
(1) Establishing the Evaluation Index System
The input, output, and environmental variables selected for this study are shown in Table 3.
(2) First Stage of the Three-Stage DEA Model
In the first stage, the non-radial SBM model is used to calculate the operational efficiency of each decision-making unit (DMU).
(3) Second Stage of the Three-Stage DEA Model
The efficiency values calculated in the first stage include the combined effects of managerial inefficiencies, random disturbances, and environmental factors. Since the results cannot distinguish the impact of these three factors on the operational efficiency of routes, in the second stage, the SFA model is used to decompose the input slack variables from the first stage, eliminating the influence of environmental and random disturbance factors on the efficiency evaluation. This adjustment ensures that all decision-making units are evaluated under the same “environment,” thereby improving the accuracy of the efficiency assessment. The specific calculation formulas are provided in the Appendix.
(4) Third Stage of the Three-Stage DEA Model
In the third stage, the adjusted input variables from the second stage are used as the new input variables, and the original output variables are combined into the SBM model again to calculate the operational efficiency of the routes. The results at this stage reflect the route operational efficiency based on management levels.
Airport flight schedule data and social economic data
This study collated flight scheduling data for Beijing Capital Airport (PEK), Daxing Airport (PKX), and Tianjin Airport (TSN) in 2023. There are 60 overlapping destinations among the three airports, including 53 domestic destinations, 5 international destinations, and 2 regional destinations. The study collected operational data for 53 shared domestic routes from the three airports. Data on flight punctuality rate, route passenger traffic, load factor, number of flights, number of seats, number of operating airlines, and aircraft types were obtained from the VariFlight database (https://flightadsb.variflight.com/). Information on airspace connectivity of destination airports and weekly flight frequencies for routes was obtained from the flight schedules published on the official websites of the airports (https://www.bcia.com.cn/index.html) (https://daxing-pkx-airport.com/) (http://tbia.cn/cn/index.do) and the OAG database (https://oag.cn/). Regional economic and population data were collected from the official websites of regional statistics bureaus. Partial data in the evaluation matrices of the three airports are shown in Table 4.
Results and discussion
Route operational performance evaluation
The entropy weight method is used to calculate the weights of various indicators for different airports. The results are shown below:
As shown in Table 5, the calculated indicator weights vary across different airports. However, overall, the indicator with the highest weight for all three airports is the route’s passenger transport volume, followed by the weekly flight frequency. After these, the next most important indicators are airspace connectivity at the destination airport, route type, and the functional positioning of the destination airport. The indicator with the smallest weight for all airports is the flight punctuality rate.
The goal of this section is to rank the routes based on their operational performance and development positioning, selecting those with lower operational levels, weaker transport capacity, and those that do not align with the airport’s development strategy. Thus, the calculated indicator weights are reasonable.
First, passenger transport volume reflects the demand and transport capacity of a route; higher passenger volumes indicate higher passenger demand and operational levels for that route. Second, weekly flight frequency reflects the flexibility of flight choices for passengers, with higher frequency indicating greater convenience for passengers, more mature route development, and stronger operational capacity. Third, airspace connectivity at the destination airport reflects the convenience for passengers on one hand, and on the other hand, higher airspace connectivity indicates a higher functional positioning of the destination airport and stronger transit capability. Routes operating through such airports align with the development positioning of the three airports. Fourth, the punctuality rate for different routes shows minimal variation, so this indicator has a relatively small impact on the route evaluation.
Table 5 also shows the results of the traditional entropy weight method. It can be seen that the magnitude differences between the indicator weights are significantly larger with the traditional method. Furthermore, the method is overly sensitive to small differences in entropy values. For example, the entropy values for the seat utilization rate and airspace connectivity at the destination airport differ by only 0.08, but the corresponding weights differ by 0.215. The factors affecting route operational performance are multidimensional, and such large weight differences reduce the accuracy and comprehensiveness of the evaluation. In contrast, the improved entropy weight method narrows these large differences, enhancing the comprehensiveness and scientific rigor of the route evaluation.
Route evaluation results based on the TOPSIS method
The calculated indicator weights were applied to the TOPSIS method based on orthogonal projection to evaluate the operational performance of the routes. To enhance the comparability and distinguishability of the results, both the weight values and TOPSIS values were multiplied by 10 to obtain the final evaluation scores for the routes. The final results show that all the route scores were scaled by the same factor, which does not affect the evaluation of the routes.
This paper conducts route evaluations using different scoring weights (e.g., a weight variation of ± 0.1 for the hub airport indicator in the airport functional positioning evaluation). The results demonstrate that, while the numerical values of the route evaluation scores for each airport exhibit certain fluctuations, the route classification outcomes remain consistent and unchanged. Therefore, the evaluation results show a certain degree of robustness across different scoring schemes. The route operation level evaluation results of Capital Airport are shown in Table 6. Those of the other two airports are in the Appendix.
TOPSIS measures the distance between the rating value of the route to be evaluated and the ideal solution. The smaller the distance, the higher the route operation level and the better it conforms to the functional positioning of the airport. According to the calculation results, the route operation levels of each airport are evaluated as follows:
Beijing Capital International Airport:
(1) The top three routes are those from Capital Airport to Shanghai Hongqiao, Shenzhen Bao’an, and Chengdu Shuangliu. These routes all have a high annual passenger transport volume and a large number of weekly flights, with strong transport capacity and a relatively mature transport level. These routes all connect important composite hub airports, and their airspace connectivity is better than that of other airports, which is in line with the strategic positioning of Capital Airport as an international hub airport. It is worth noting that the destinations of these routes are all important first-tier cities, and there are close personnel and economic exchanges with Beijing. Therefore, the high-level operation of such routes helps to promote regional coordinated development and the continuous and rapid operation of the civil aviation industry.
(2) Although both are in Shanghai, and the airspace connectivity of Pudong Airport is stronger than that of Hongqiao Airport. However, due to the relatively small number of weekly flights and annual passenger volume of the route from Capital Airport to Pudong Airport, the transport capacity is relatively weak. Therefore, the ranking of the route to Pudong Airport is lower than that to Hongqiao Airport. This is related to the development strategy of differentiated coordination and development of the two hubs in Beijing.
(3) The routes to Changzhi Wangcun, Lvliang Dawu, Qingyang, etc., which rank at the bottom, also have some commonalities, such as low weekly flight frequency, small annual passenger volume, poor airspace connectivity of the destination airport, and the airports of the navigation points are non-hub airports. The transport capacity of these routes is weak, which does not conform to the development positioning of Capital Airport. Moreover, the low flight frequency and poor airspace connectivity of the destination airport reduce the convenience and freedom of passengers’ travel, resulting in a low route operation level. From the perspective of regional economic development, most of the destination airports of these routes are in fourth and fifth-tier cities, and there are relatively infrequent personnel and economic exchanges with Beijing, with weak support capacity for civil aviation demand.
Beijing Daxing International Airport:
(1) The top three routes are those from Daxing Airport to Guangzhou Baiyun, Shenzhen Bao’an, and Chongqing Jiangbei. Similarly, these routes have a high annual passenger volume and a large number of weekly flights, and the locations of the airports are all important first-tier cities with good economic development, a large population, and close connections with the Beijing area. Therefore, the route development is relatively mature.
(2) The routes to Changzhi, Jingdezhen, and Qingyang rank relatively low. This is related to the low route traffic volume, less passenger demand, low flight frequency of the route, and the fact that it does not conform to the development positioning of Daxing Airport.
It can be seen that although Capital Airport and Daxing Airport are both located in Beijing and have the same functional positioning, there are differences in the rankings of their routes. This is mainly because under the planning of “two airports in one city”, in order to achieve the coordinated development of the airports, a certain differentiated allocation of routes departing from Beijing has been carried out. At the same time, due to the different main operating airlines at the two airports, there are also differences in the routes opened by the airlines. Therefore, the flight frequencies of the two airports to the same destination are different. However, generally speaking, the routes from Beijing to Shenzhen and Guangzhou rank relatively high at both airports, indicating that there are the closest economic and personnel exchanges between Beijing and these two places. On the contrary, due to the small population flow, the limited development level of the destination cities, and the fact that the routes do not conform well to the development positioning of the two airports in Beijing, the route operation levels of the routes from Beijing to Qingyang, Lvliang, and Changzhi are the lowest.
Tianjin Binhai International Airport:
The routes from Tianjin to Guangzhou, Xi’an, and Chengdu rank among the top three. These routes are in line with the functional positioning of Tianjin Airport as a regional hub, and their operation levels are strong. The routes to Daqing, Lvliang, Changzhi, Tongliao, and Qiqihar rank at the bottom. The navigation points of these routes are all non-hub airports, with a small annual passenger volume and low passenger demand.
Route operational efficiency evaluation results
Pearson correlation analysis
Pearson correlation analysis is used to explore the correlations between the input and output variables for each airport. The results are as shown in Table 7 and the Appendix Table 12.
The results of the correlation analysis show that there is a strong correlation between the input and output variables, and all correlations are positive. Therefore, the selection of variables is reasonable, and the next step of route operational efficiency analysis can proceed.
First-stage route operational efficiency analysis
The initial input-output data for the routes were imported into the MaxDEA software, and the SBM model was used to calculate efficiency. The parameters were set as follows: 53 routes to be evaluated as DMUs; flight frequency, seat count, aircraft types, and operating airlines as inputs; and route passenger transport volume as the output. The evaluation is based on the farthest distance from the strong efficient frontier, non-oriented, and variable returns to scale. The results of the route operational efficiency evaluation are shown in Table 8:
The table shows that, without considering the influence of environmental variables and random disturbances, the average operational efficiency values of the routes at PEK, PKX, and TSN airports are 0.775, 0.757, and 0.791, respectively. It can be observed that the overall operational efficiency of each airport is not very high, indicating that the efficiency of converting airport route resource inputs into outputs is relatively low, and there is room for improvement in resource allocation and utilization.
Comparing these results with the TOPSIS evaluation, it can be seen that the routes with low alignment to airport functional positioning and low operational levels do not necessarily have low operational efficiency scores. For example, the TOPSIS evaluation score for the route from Capital Airport to Quzhou is 0.07293, and for the route to Qiqihar Sanjiazi is 0.07272, both of which rank in the bottom ten of all evaluated routes. However, the operational efficiency scores for these routes are 0.817 and 0.850, respectively, which are above the average. This indicates that for some routes, despite the low development level of the connected airports, low flight frequency, and relatively low annual passenger volume, the existing resources are utilized efficiently, resulting in relatively high operational efficiency.
However, there are also some cases of input redundancy in some high-volume routes. The difference in evaluation results suggests that the operational level and transport capacity of a route are not necessarily related to its operational efficiency. Some routes may have high operational levels, but the conversion of input costs into output efficiency still has room for improvement.
In the first stage of the analysis, the impact of random disturbances and environmental factors on operational efficiency is not considered. In the next stage, the input variables will be further adjusted to eliminate the effects of random disturbances and environmental factors, placing all evaluated routes at the same airport under the same environmental background to ensure objective and accurate evaluation of management operational efficiency.
Second-stage SFA analysis
In this stage, the input variables are optimized based on the results from the first stage to eliminate the effects of random disturbances and environmental factors on the evaluation of route operational efficiency. The Frontier 4.1 software was used to perform the second-stage SFA regression analysis, and the results are shown in Table 9.
From the regression results, the following conclusions can be drawn:
First, the γ values of all input slack variables for the environmental factors are close to 1 and have passed the significance test at the 1% level, indicating that management factors are the main influences on operational efficiency measurements.
Second, the LR values of all regression results exceed 7.045 and have passed the significance test at the 1% level, showing that the two environmental factors have a statistically significant impact on route operational efficiency, confirming the reasonableness and necessity of constructing the SFA model.
Finally, most variables have passed the significance tests, demonstrating that external environmental factors have a significant impact on route operational input and operational efficiency.
By analyzing the regression results of environmental variables on input slack, it can also be observed that the coefficients of regional economic factors for most input slack variables are negative, indicating that regional economic growth helps reduce input redundancy, improve resource utilization, and enhance route operational efficiency.
The coefficients of regional population for most input slack variables are positive. For example, the coefficients of regional population on the slack variables for flight frequency and seat count are positive, suggesting that population growth may increase input redundancy for flights and seat availability. This indicates that regional population growth does not necessarily improve route operational efficiency because the increase in overall population may not align with the increase in the population that demands air travel. If the population growth rate exceeds the growth rate of air passengers in the region, it will inevitably lead to increased flight input redundancy.
In summary, to ensure more accurate and reliable evaluations of route operational efficiency, it is necessary to eliminate the influence of environmental factors and random disturbances.
Third-stage route operational efficiency analysis
In this stage, the adjusted input variables from the second stage and the initial output variables were again input into the MaxDEA software for calculation. This resulted in the route operational efficiency values after eliminating the effects of random disturbances and environmental factors. The results of PEK are as follows, the results for other airports are presented in Appendix Tables 13 and 14:
As can be seen from the tables, compared to the first stage, the average route operational efficiency at Capital Airport increased by 0.02 in the third stage, Daxing Airport increased by 0.023, and Tianjin Airport increased by 0.047. This further confirms that random disturbances and environmental factors indeed affect the calculation of route operational efficiency. Therefore, to objectively and accurately measure the efficiency of route management, it is necessary to adjust the input variables accordingly.

Changes in Route Operational Efficiency Before and After Adjustments at Each Airport.
Analysis of Changes in Operational Efficiency Before and After Removing: Environmental Variables:
Figure 2 illustrates the changes in route operational efficiency before and after adjustments for each airport. From Tables 10, 11 and 12; Fig. 2, it is evident that the impact of environmental factors varies across different routes. After eliminating the influence of environmental factors, the operational efficiency of some routes increased, while others decreased. Below is a discussion of the changes in route operational efficiency before and after input variable adjustments for each airport.
(1) Beijing Capital International Airport:
As shown in Table 10, after removing the influence of environmental factors, 68% of the routes at Capital Airport experienced an increase in operational efficiency, indicating that these routes were indeed constrained by environmental factors, and their actual operational efficiency, based on management factors, is higher. The routes with relatively significant changes in efficiency are those from Capital Airport to Ganzhou, Ordos, and Qiqihar, with increases of 0.167, 0.142, and 0.150, respectively. This suggests that the operational efficiency of these routes was significantly affected by environmental factors, and removing these effects can improve their efficiency evaluations to some extent.
On the other hand, 26% of the routes were not affected by environmental factors, as their efficiency values remained unchanged before and after adjustment. These routes include those from Capital Airport to Chengdu, Dalian, Guangzhou, Sanya, Hongqiao, Xishuangbanna, and Xilinhot. Only the routes from Capital Airport to Haikou, Shenzhen, and Yiwu showed a decrease in operational efficiency after adjustment. This suggests that these routes benefited from a favorable external environment, which enhanced their operational efficiency but also masked the underlying management inefficiencies. Management-based operational efficiency is an area that airports and airlines can optimize and improve, making the use of the three-stage DEA model necessary to evaluate routes by removing environmental factors. This method more accurately reflects the true operational efficiency of each route, helping airports identify low-efficiency routes and optimize resource allocation.
(2) Beijing Daxing International Airport:
According to Table 13, 45% of the routes at Daxing Airport saw an increase in operational efficiency after the removal of environmental factors. The routes that experienced significant efficiency increases, indicating a strong impact from environmental factors, include Daxing to Qingyang (increase of 0.616), Daxing to Changzhi (increase of 0.393), Daxing to Yibin (increase of 0.184), and Daxing to Quzhou (increase of 0.141). Eleven routes, including those from Daxing to both Chengdu airports, Ordos, Ganzhou, Guangzhou, Jingdezhen, Mianyang, Qiqihar, Sanya, Shiyan, and Yiwu, remained efficient frontier routes unaffected by environmental factors. On the other hand, 18 routes saw a decrease in operational efficiency after the environmental factors were removed, with the most significant decreases seen in routes to Shanghai Hongqiao (decrease of 0.149), Xilinhot (decrease of 0.028), and Yangzhou (decrease of 0.017).
(3) Tianjin Binhai International Airport:
As shown in Table 14, after removing environmental factors, 60% of the routes from Tianjin Airport showed an increase in operational efficiency, with the largest increase observed in the route to Xilinhot (increase of 0.535). The efficiency gains for routes from Tianjin were greater overall than those from Capital and Daxing airports, indicating that routes originating from Tianjin are more constrained by environmental factors. Twelve routes, including those to both Chengdu airports, Guangzhou, Sanya, Shenzhen, Xi’an, Yangzhou, and Yibin, remained unaffected by environmental factors, with efficiency values of 1 before and after adjustment. Nine routes saw a decrease in efficiency after environmental factors were removed, including routes to Ningbo, Wuhan, Yulin, Fuzhou, both Shanghai airports, Hefei, Nantong, and Quanzhou, with the largest decrease observed in the route to Quanzhou (decrease of 0.01182).
Comprehensive evaluation and classification of routes of each airport
According to the evaluation results of the route operation level and operational efficiency, this chapter establishes a two-dimensional classification framework of “operational level - operational efficiency”, and divides the routes of each airport into four categories. Taking the mean values of the route operational level and operational efficiency as the demarcation values, the routes with both the operation level and operational efficiency values higher than the average level are defined as “double-excellent routes”; the routes with a high operational level but low operational efficiency are defined as “routes with low operational efficiency”; the routes with a low operational level but high operational efficiency are defined as “routes with low operational level”; and the routes with both values being low are defined as “double-low routes”. The evaluation results for routes at each airport are shown in Figs. 3, 4 and 5. Using Capital Airport as an example, each category is analyzed below:
-
Double-Excellent Routes—— High Operational Efficiency and High Operational Level Routes:
The routes from Beijing Capital Airport to Shanghai Hongqiao, Sanya, Guangzhou, Dalian, Chengdu Shuangliu, Chengdu Tianfu, Shenzhen, Haikou, and Changsha have both high operational efficiency values and high operational level evaluation values, and they are the double-excellent routes of Beijing Capital Airport. Such routes are in line with the development positioning of the airport, and they have both high resource utilization rates and high passenger demand. They can contribute to the development of the airport and the region, and they are the routes that the airport should prioritize for development and do not require optimization.
Through an analysis of such routes, it is found that the majority of them link Beijing Capital International Airport to other Level 1–2 hub airports (e.g., CAN, SZX, CTU) or key tourist destinations (e.g., SYX, HAK). These routes are highly consistent with PEK’s functional orientation as an international aviation hub.
The structural drivers behind their dual excellence are threefold: first, the destinations have high economic vitality and large population bases, generating sustained and substantial passenger demand (e.g., the annual passenger volume of PEK-SHA route exceeds 2.3 million). Second, the high weekly flight frequency (e.g., 283 weekly flights for PEK-SHA) and optimal aircraft type allocation enable economies of scale in operations. Third, the strong airspace connectivity of destination airports (e.g., SHA has 75 connected destinations, CAN has 219) enhances transfer convenience, forming a positive cycle of demand and operational efficiency.
For policy and operational implications, these routes should be designated as “core hub routes” and receive priority resource guarantees. Specifically, airports should maintain or moderately increase flight frequencies during peak travel seasons, allocate large-capacity wide-body aircraft to further improve load factors, and strengthen inter-airport cooperation to expand code-sharing agreements. This not only consolidates the hub status of PEK but also promotes the integrated development of the Beijing-Tianjin multi-airport system by enhancing the radiation capacity of key air corridors.
-
Routes with Low Operational Efficiency ——Low Operational Efficiency but High Operational Level Routes:
The routes from Beijing Capital Airport to Harbin, Chongqing, Xi’an, Hangzhou, Urumqi, Shanghai Pudong, etc. are “routes with low operational efficiency”. These routes are in line with the functional positioning of the airport and have strong transportation capacity and a large passenger demand. However, the level of cost-output conversion rate is low. The airport should re-evaluate the resource input of these routes.
A notable empirical regularity is that these routes have strong market demand and high operational standards (e.g., high passenger volume and flight frequency) but suffer from inefficient resource conversion, with third-stage DEA efficiency values 15%-25% lower than the Double-Excellent Routes.
The root causes of this inefficiency are structural and operational: structurally, the overlapping route networks between Beijing’s two airports (PEK and PKX) lead to redundant resource input (e.g., both airports operate frequent flights to CKG and XIY, resulting in fragmented capacity). Operationally, there is a mismatch between aircraft type and passenger demand (e.g., using large-capacity aircraft on routes with fluctuating demand leads to low off-peak load factors) and unreasonable flight scheduling (e.g., concentrated takeoff and landing times cause air traffic congestion and increased operational costs).
To address this, targeted optimization strategies are proposed. First, implement “differentiated capacity allocation” between PEK and PKX. PEK can focus on international transfer-oriented flights to these destinations, while PKX undertakes more domestic point-to-point travel demand to reduce internal competition. Second, adopt “dynamic aircraft type adjustment”. For example, using medium-capacity aircraft during off-peak seasons and increasing wide-body aircraft deployment only during peak periods (e.g., holidays, exhibitions) to improve seat utilization. Third, optimize flight scheduling by staggering takeoff and landing times between the two airports to reduce air traffic control delays and lower operational costs.
-
Routes with Low Operational Level——High Operational Efficiency but Low Operational Level Routes:
The routes from Beijing Capital Airport to Ningbo, Quanzhou, Changchun, Qiqihar, Xishuangbanna, Jingdezhen, etc. are “routes with low operational level”. Although these routes do not quite match the functional positioning of Beijing Capital Airport, and their transportation capacity is relatively weak with a relatively small number of passengers having travel demands for these routes, the conversion efficiency of cost-output or the resource utilization rate is relatively high.
The key empirical finding is that these routes do not fully align with PEK’s international hub positioning (e.g., destinations are mostly regional hubs or non-hubs with weak international connectivity) and have relatively small passenger demand. But their resource utilization efficiency is high (third-stage DEA efficiency values above 0.8), indicating efficient conversion of limited inputs to outputs.
The underlying logic is that these routes serve small but stable demand. Such as business travel between Beijing and coastal manufacturing cities (NGB, JJN) or tourism demand to characteristic destinations (JHG, JDZ). The low operational level, characterized by low flight frequency and passenger volume, reduces resource occupation, while the high efficiency originates from precise market positioning and minimal input redundancy.(e.g., using small-to-medium capacity aircraft with high load factors).
For operational implications, these routes should not be canceled. It can be considered to adjust these routes by changing direct flights to transfer flights. This can not only meet the travel needs of passengers but also improve the functional compatibility of the routes operated by the airport.
-
Double-Low Routes——Low Operational Efficiency and Low Operational Level Routes:
The routes from Beijing Capital Airport to Hefei, Yinchuan, Nanchang, Guilin, Lanzhou, Yangzhou and other places are “double-low routes”. Such routes not only do not conform to the functional positioning of Beijing Capital Airport, but also have weak transportation capacity and a low conversion rate of input and output. Opening too many such routes is not conducive to improving the resource utilization level of the airport. Therefore, it is necessary to optimize and adjust such routes from two aspects: route optimization and optimal allocation of flight resources.
The empirical regularity is that these routes not only conflict with PEK’s international hub positioning (destinations are regional non-hubs with low economic and population density) but also have weak market demand and inefficient resource utilization.
The structural causes may include: first, overlapping coverage with high-speed rail—short-to-medium haul routes (e.g., PEK-HFE, PEK-YTY) face fierce competition from high-speed rail, which has shorter travel times and higher punctuality, leading to low passenger demand for air travel. Second, insufficient industrial and economic ties between Beijing and these destinations result in weak sustained demand, with most flights operating at low load factors (e.g., PEK-HFE’s average load factor is only 0.58). Third, the small scale of operations (low flight frequency and small aircraft type) leads to high unit costs, further reducing operational efficiency.
The optimization direction should focus on “resource reallocation and route adjustment”: first, gradually reduce flight frequency for routes with severe high-speed rail competition (e.g., PEK-HFE, PEK-YTY) or suspend them during off-peak seasons, reallocating the released slots to Double-Excellent Routes. Second, transfer these routes to TSN. As a regional hub, TSN’s positioning is more compatible with these regional destinations, and transferring can enhance TSN’s regional radiation capacity while reducing PEK’s non-core route burden. Third, for routes with potential demand (e.g., PEK-KWL, PEK-LHW), cooperate with local governments and tourism departments to launch “air + tourism” packages to stimulate demand, but only maintain minimal flight frequency to avoid resource waste.

Evaluation Results for Routes at Capital Airport.

Evaluation Results for Routes at Daxing Airport.

Evaluation Results for Routes at Tianjin Airport.
Cross-context generalization of research findings and framework
The analysis of the Beijing-Tianjin multi-airport system in this study is deeply rooted in China’s institutional context (e.g., top-down functional positioning planning for airports) and functional characteristics. To enhance the academic value and practical applicability of the research, this section further discusses the generalizability of the observed patterns and the research framework, exploring their transferability across global multi-airport systems.
This study find that mismatches between route operational level and operational efficiency is not unique to China but rather a universal attribute of functionally differentiated multi-airport systems. The underlying logic lies in the inherent tension between “functional positioning-driven operational scale” and “resource allocation efficiency” in multi-airport systems worldwide. As long as airports within a system have differentiated functional positioning (e.g., international hub vs. regional hub), the tension between scale expansion for functional fulfillment and efficiency improvement through resource concentration will inevitably lead to such mismatches.
For example, studies have shown that in the Los Angeles airport group, the homogenization level is relatively high among three pairs of secondary airports: BUR-ONT, BUR-SNA, and ONT-SNA, with the homogenization coefficient of each pair around 0.50. In the London airport cluster, LTN-STN and LGW-STN exhibit relatively high homogenization, with their homogenization coefficients exceeding 0.45. In the Paris airport cluster, CDG-ORY has a relatively high homogenization level, with a homogenization coefficient of 0.4255.
While the research findings and framework have strong generalizability, they require targeted adjustments based on regional differences to avoid “one-size-fits-all” applications. The key adjustment principles are as follows:
Institutional Context Adjustment: In market-oriented multi-airport systems (e.g., the U.S.), where route allocation is dominated by airlines rather than government planning, the “operational level” evaluation should reduce the weight of “government-defined functional positioning” and increase indicators such as “airline hub network integration degree” (e.g., alignment with airline alliance networks). In government-guided systems (e.g., China, Japan), the functional positioning weight should be retained to align with top-down planning goals.
Market Environment Adjustment: In regions with intense high-speed rail competition (e.g., Europe, China), environmental variables should include “high-speed rail travel time/cost ratio” to eliminate the impact of alternative transportation on route efficiency. In regions with underdeveloped high-speed rail (e.g., the U.S.), this variable can be omitted, and “highway accessibility” can be added instead.
Airport Type Adjustment: For multi-airport systems with prominent low-cost carriers (e.g., London, Southeast Asia), the operational level evaluation should add indicators such as “route profit margin” and “LCC operational proportion” to reflect the characteristics of low-cost operations. For leisure-oriented airports (e.g., LGW, Orlando MCO), increase the weight of “seasonal demand stability” in the efficiency evaluation.
In summary, the mismatch between operational level and efficiency observed in the Beijing-Tianjin multi-airport system is a universal phenomenon in functionally differentiated multi-airport systems globally. The proposed two-dimensional evaluation framework and integrated methodology have broad cross-context transferability, provided that indicator systems and model parameters are adjusted based on local institutional, market, and functional characteristics.
Conclusion
From the perspectives of operational level and operational efficiency, this paper constructs a comprehensive evaluation model, which enables the comprehensive evaluation and classification of airport routes. Firstly, the improved Entropy-TOPSIS model is used to evaluate the operational level of the routes. Then, the three-stage DEA model is employed to eliminate the influence of environmental factors and evaluate the operational efficiency of the routes. Furthermore, based on the above evaluation results, a two-dimensional classification framework of “operational level- operational efficiency” is established, and the involved routes are divided into four categories. Finally, aiming at reducing the operation costs of the routes and improving the coordinated development level of the multi-airport system, differentiated optimization suggestions are put forward for different types of routes. This paper takes the three airports in the Beijing-Tianjin region as a case study to validate the model.The conclusions are as follows:
First, the analysis of changes in operational efficiency before and after removing environmental variables reveals that:
Overall, after removing environmental variables, the average operational efficiency of routes at each airport increased. This indicates that, in general, environmental factors had a constraining effect on the evaluation of route operational efficiency, and most routes showed improved efficiency after the removal of environmental factors.
For example, Tianjin Airport showed the largest increase in average operational efficiency among its routes after adjustments. This suggests that the routes originating from Tianjin Airport were more significantly constrained by environmental factors.
Some routes experienced a decrease in operational efficiency after removing the influence of environmental factors, indicating that these routes benefited from a favorable external environment. This favorable environment, to some extent, elevated the overall operational efficiency evaluation of the routes while masking the underlying management inefficiencies. For airports, the aspect that can be regulated and improved is the management-based operational efficiency. This further emphasizes the necessity of eliminating environmental variables to achieve a more accurate assessment.
Secondly, this study classifies the routes at each airport into four categories based on their operational level and operational efficiency. This method is applicable to most airports both domestically and internationally.
Routes with both high operational level and high operational efficiency align with the airport’s development positioning and have high resource utilization and passenger demand. These routes contribute to the development of both the airport and the region, making them key routes that the airport should prioritize.
Some routes have a high operational level but low operational efficiency. These routes align with the airport’s functional positioning, have strong transport capacity, and meet high passenger demand, but their cost-to-output conversion rates are low. The airport should reevaluate the resource allocation for these routes and explore ways to improve resource utilization, such as adjusting aircraft types.
Some routes have a low operational level but high operational efficiency. Although these routes do not align well with the airport’s functional positioning and have relatively weak transport capacity, they demonstrate high cost-to-output conversion efficiency or resource utilization. These routes serve a niche group of passengers with specific travel needs, efficiently utilizing the airport’s resources.
The last category consists of routes with low scores in both operational level and operational efficiency. Operating too many of these routes would not improve the airport’s resource utilization rate. These are the routes that the airport should consider optimizing or adjusting.
Thirdly, based on the optimization results, targeted management implications are proposed for different types of routes. Double-excellent routes: Maintain existing resource input and strengthen hub functions. High operational level–low efficiency routes: Adjust the aircraft type structure to reduce ineffective capacity. Low operational level–high efficiency routes: Retain the routes and convert them to connecting/transfer services. Double-low routes: Reduce flight frequency or suspend the routes, and reallocate resources to high-efficiency routes.
In addition to the airports investigated in this study, numerous airports worldwide are confronted with issues including inefficient resource allocation, ambiguous functional positioning, and underutilization of route resources. The classification framework and optimization strategies proposed in this paper are generally applicable to the analysis and evaluation of route networks across diverse multi-airport systems, thereby providing a scientific basis for optimizing route network configuration and fostering the coordinated development of multi-airport systems.
Different from existing studies, this chapter innovatively constructs a two-dimensional classification framework of “operational level - operational efficiency”, providing a basis for the differentiated optimization of routes. The results show that, in order to improve the coordinated development level of the multi-airport system and the resource utilization efficiency, targeted optimization strategies should be formulated for different types of routes. For example, for routes with low operational efficiency, flight allocation should be optimized; for routes with low operational level, coordinated route planning should be carried out; and for double-low routes, comprehensive optimization of route flights should be conducted.
Nowadays, the demand for civil aviation travel continues to grow, while airspace and airport resources are limited. The coordinated optimization of route and flight resources around the multi-airport system has gradually become a research hotspot. And the prerequisite for effective optimization is the accurate selection and evaluation of the objects to be optimized. The comprehensive route evaluation method and the two-dimensional route classification framework proposed in this paper can help provide new ideas for the comprehensive evaluation of airport routes. It also provides a basis for carrying out targeted optimization of routes in the multi-airport system to improve the coordinated development level of multiple airports and the efficiency of resource utilization. However, there are also some limitations in this study. In the future, more advanced efficiency evaluation models can be selected to improve the accuracy of the evaluation. Moreover, from the perspective of optimizing the efficiency evaluation model, continuous innovation in the evaluation method can be carried out.
Data availability
The datasets used and/or analysed during the current study available from the corresponding author on reasonable request.
References
Wang, X. & Guo, X. Multi-airport System Route Network Optimization Based on Differentiated Positioning. J. Phys. : Conf. Ser. 2457, 012039. https://doi.org/10.1088/1742-6596/2457/1/012039 (2023).
Zhu, C. Research on the Complexity and Collaborative Development of Multi-polar Airport Aviation Networks in China’s Four Major Airport Groups [D] (Chongqing Jiaotong University, 2023).
Hu, X., Zeng, X. & Pan, Y. Analysis of Radiation Domain Competition Equilibrium Model for Regional Multi-Airport System. J. East. China Jiaotong Univ. 37 (3), 66–73 (2020).
Kasarda, J. D. et al. Modern International Airports: A New Aviation Business Model to Enhance Regional Competitiveness. Reg. Economic Rev. 3, 84–97 (2015).
Sun, X., Zheng, C., Chen, X. & Wandelt, S. Multiple airport regions: A review of concepts, insights and challenges. J. Transp. Geogr. 120, 103974 (2024).
Sun, X. et al. Multiple airport regions based on inter-airport temporal distances. Transp. Res. Part. E: Logistics Transp. Rev. 101 (5), 84–98 (2017).
Derudder, B., Devriendt, L. & Witlox, F. A spatial analysis of multiple airport cities. J. Transp. Geogr. 18 (3), 345–353 (2010).
Yang, X. & Xu, R. Route network optimization of regional multi-airport system based on functional positioning. Aviat. Comput. Technol. 50 (4), 1–4 (2020).
Jiang, W. & Li, Y. An entropy weighting-improved TOPSIS method for sector complexity evaluation. J. Transp. Inform. Saf. 41 (6), 142–151 (2023).
Zhang, J. et al. Military transport capacity evaluation of ports using entropy weight and TOPSIS. J. Tsinghua Univ. (Science Technology). 58 (5), 494–499 (2018).
Luo, F. et al. Research on the coordinated development of the Chengdu-Chongqing airport cluster under the construction of the chengdu-chongqing economic circle. Sci. Technol. Ind. 23 (22), 162–168 (2023).
Guo, J. et al. A spatiotemporal - attention - based neural network to evaluate the route risk for unmanned aerial vehicles. Appl Intell 2022:03029. (2022).
Yu, G., Liu, Q. & Zhao, L. Research on fuzzy multi attribute route evaluation decision method. China Transp. Rev. 41 (10), 41–44 (2019).
Feng, Y. & Ge, J. Structure nodes of Xinjiang air transport network using entropy weight and TOPSIS. Logistics Sci. Technol. 42 (6), 106–109 (2019).
Zhang, L. et al. Selection of TOPSIS Method Weights: Comparison of Several Weighting Methods. Stat. Application. 12 (4), 901–909 (2023).
Adler, N. & Golany, B. Evaluation of deregulated airline networks using data envelopment analysis combined with principal component analysis with an application to Western Europe. Eur. J. Oper. Res. 132, 260–273 (2011).
Madani, S. R., Nookabadi, A. S. & Hejazi, S. R. A bi-objective, reliable single allocation p-hub maximal covering location problem: Mathematical formulation and solution approach. J. Air Transp. Manage. 68, 118–136 (2018).
Azizi, N., Chauhan, S., Salhi, S. & Vidyarthi, N. The impact of hub failure in hub-and-spoke networks: mathematical formulations and solution techniques. Comput. Oper. Res. 65, 174–188 (2016).
Deveci, M., Demirel, N. Ç. & Ahmetoğlu, E. Airline new route selection based on interval type-2 fuzzy MCDM: A case study of new route between Turkey-North American region destinations. J. Air Transp. Manage. 59, 83–99 (2017).
Suzuki, S., Nijkamp, P., Rietveld, P. & Pels., E. A distance friction minimization approach in data envelopment analysis: a comparative study on airport efficiency. Eur. J. Oper. Res. 207 (2), 1104–1115 (2010).
Yoo, S., Meng, J. & Lim, S. An analysis of the performance of global major airports using two-stage network DEA model. Korean Soc. Qual. Manag. 45 (1), 65–92 (2017).
Lam, S. W., Low, J. M. & Tang, L. C. Operational efficiencies across Asia Pacific airports. Transp. Res. E-Log. 45 (4), 654–665 (2009).
Lu, Y. Research on the operational efficiency of regional airports (Nanjing University of Aeronautics and Astronautics, 2016).
Liu, H. et al. Evaluation of Airport Operation Efficiency Based on Grey Correlation Degree. Aeronaut. Comput. Technique. 48 (6), 73–76 (2018).
Li, Q. Evaluation of airports operation efficiency (Nanjing University of Aeronautics and Astronautics, 2008).
Fu, Z., Shao, Y. & Xiao, J. Operational efficiency of major airports in China based on dual-oriented DEA model. J. Transp. Syst. Eng. Inf. Technol. 13 (4), 193–199 (2023).
Liu, S., Wan, Y. & Zhang, A. Does high-speed rail development affect airport productivity? Evidence from China and Japan. Transp. Pol. 110 (5), 1–15 (2021).
Jiang, Y. et al. Identification of technology spillover among airport alliance from the perspective of efficiency evaluation: The case of China. Transp. Policy. 80 (8), 49–58 (2019).
Pei, G. The research on the operation efficiency of airports in China based on three-stage DEA method (Civil Aviation University of China, 2017).
Fan, H. & Liu, D. Research on the operational efficiency of China’s airports in competitive circumstances. J. Dalian Maritime Univ. (Social Sci. Edition). 21 (2), 81–87 (2022).
Xu, A., Chen, X. & Zhu, J. Analysis of Airport Efficiency Based on Dynamic Network DEA Mode. Math. Practice Theory. 45 (22), 65–73 (2015).
Zhang, Y. & Hu, H. An Analysis on Operating Efficiency of China Civil Airports Based on Malmquist TFP Index. Syst. Eng. 24 (12), 40–45 (2006).
Deng, Z. Research on the evaluation of route network operation efficiency based on DEA-Tobit model (Civil Aviation Flight University of China, 2023).
Shao, Y. & Sun, C. Performance evaluation of China’s air routes based on network data envelopment analysis approach. J. Air Transp. Manage. 55, 67–75 (2016).
Chiou, Y. C. & Chen, Y. H. Route-based performance evaluation of Taiwanese domestic airlines using data envelopment analysis. Transp. Res. Part. E Logistics Transp. Rev. 42 (2), 116–127 (2011).
Chu, J. F., Wu, J. & Song, M. L. An SBM-DEA model with parallel computing design for environmental efficiency evaluation in the big data context: A transportation system application. Ann. Oper. Res. 270 (1–2), 105–124 (2018).
Lahdelma, R. & Salminen, K. Stochastic multicriteria acceptability analysis using the data envelopment model. Eur. J. Oper. Res. 170, 241–252 (2006).
Wu, Y. M., Chen, Z. X. & Xia, P. P. An extended DEA-based measurement for eco-efficiency from the viewpoint of limited preparation. J. Clean. Prod. 195, 721–733 (2018).
Zhang, J. Air Route Evaluation and Optimization of Beijing-Tianjin-Hebei Regional Multiple Airport System (Nanjing University of Aeronautics and Astronautics, 2019).
Chen, Y., Cook, W. D. & Lim, S. Preface: DEA and its applications in operations and data analytics. Ann. Oper. Res. 278 (1–2), 1–4 (2019b).
Badiezadeh, T., Saen, R. F. & Samavati, T. Assessing sustainability of supply chains by double frontier network DEA: A big data approach. Comput. Oper. Res. 98, 284–290 (2018).
Soltanifar, M., Ghiyasi, M. & Sharafi, H. Inverse DEA-R models for merger analysis with negative data. IMA J. Manag. Math. 34 (3), 491–510 (2023).
Liu, H., Liu, H. & Geng, L. Analysis of Industrial Water Use Efficiency Based on SFA–Tobit Panel Model in China. Sustain 16 (19), 8708 (2024).
Alimhanova, A., Vazhdaev, A., Mitsel, A. & Sidorov, A. Dynamic Model of Enterprise Revenue Management Based on the SFA Model. Math 11 (1), 211 (2023).
Luo, X., Ding, N., Yang, J., Lu, B. & Ma, J. Potential environmental benefits assessment of recycling based on multi - LCA and SFA. J. Clean. Prod. 457, 142370 (2024).
Jiao, H. Research on Route Network of Hub Airport Based on Functional Orientation (Civil Aviation University of China, 2020).
Zhao, L. & Wang, Y. Research on Route Evaluation Method Based on Improved TOPSIS. Sci. Technol. Ind. 22 (8), 344–347 (2022).
Ma, R. X. Research on Resource Allocation Optimization in Multi - airport System (Nanjing University of Aeronautics and Astronautics, 2021).
Ouyang, S. & Shi, Y. A New Improved Entropy Method and Its Application in Power Quality Evaluation. Autom. Electr. Power Syst. 37 (21), 156–159 (2013).
Wei Ming, Z. & Shaopeng, S. B. A modified evaluation method of airport passenger efficiency railway based on DEA and TOBIT model. Sci. Technol. Eng. 23 (9), 3916–3924 (2023).
Qiuxia, L. Y. U. et al. Measurement Method for Transportation Efficiency of Urban Rail Transit Based on Three-Stage DEA and SE-DEA Modelsmodels. Railway Transp. Econ. 47 (02), 172–179 (2025).
Wang Yonggang, L. et al. Operation Efficiency Measurement of Urban Rail Transit System with Three-Stage DEA-Tobit Model. J. Chongqing Jiaotong Univ. (Natural Sci. Edition). 42 (12), 92–98 (2023).
Du Linan, Z. J. Efficiency evaluation of main ports along Yangtze River trunk line with three-stage DEA model. J. Shanghai Maritime Univ. 41 (3), 89–96 (2020).
Coelli, T. J., Rao, D. S. P., O’Donnell, C. J. & Battese, G. E. An introduction to efficiency and productivity analysis (Springer, 2005).
Cong, W., Jiang, D. & Zhong, F. W. Homogenization evaluation and analysis of global airport clusters (Civil Aviation Resource Network, 2023).
Funding
This research is supported by MOE (Ministry of Education in China) Youth Fund Project of Humanities and Social Sciences (Grant No. 21YJCZH075); Tianjin Natural Science Foundation Joint Fund General Project (Grant No. 25JCLMJC00530); Special Fund for Basic Scientific Research of Central Universities, Civil Aviation University of China Special Project(Grant No. 3122024055).
Author information
Authors and Affiliations
Contributions
Yafei Li and Yuxi Liu wrote the main manuscript text and Yuxi Liu prepared figures. All authors reviewed the manuscript.
Corresponding author
Ethics declarations
Competing interests
The authors declare no competing interests.
Additional information
Publisher’s Note
Springer Nature remains neutral with regard to jurisdictional claims in published maps and institutional affiliations.
Appendix
Appendix
1. Weight calculation of evaluation indicators
The specific calculation steps are as follows:
(1) Determine the Set of Evaluation Indicators
Clearly identify the set of indicators related to the research problem, ensuring that these indicators accurately reflect the advantages and disadvantages of the research plan at various evaluation levels. In this study, the main focus is to determine indicators that can effectively reflect the alignment of routes with airport positioning and the operational level of the routes.
(2) Data Standardization
where \({x}_{ij}\)和\({x}_{ij}^{{\prime}}\) are the values of the j indicator for i the route before and after standardization, respectively. n represents the number of routes, and m represents the number of indicators.
(3) Proportion of Each Indicator
where \({p}_{ij}\) is the proportion of the j indicator for the i route among all routes.
(4) Indicator Entropy Value
where \({E}_{j}\) is the information entropy value of the j indicator.
(5) Improved Entropy Weight Method to Optimize Indicator Weights
where \({\omega}_{j1}\) is the weight of the j indicator calculated using the traditional entropy weight method. \(\stackrel{-}{E}\) is the average of all entropy values not equal to 1; \({\omega}_{j2}\) is the corrected entropy value; and \({\omega}_{j}\) is the final weight obtained using the improved entropy weight method.
2. Mathematical formula
The regression model of the second stage of the Three-Stage DEA model is as follows:
where \({S}_{kj}\) is the slack variable of the k route on the j input; \({z}_{k}\) is the set of environmental variables for the k route, \({z}_{k}=[{z}_{k1},{z}_{k2}\cdots{z}_{kp}]\), with p being the number of environmental variables. \({v}_{kj}\) represents the random disturbance term, which follows a normal distribution \(v\sim N(0,{\sigma}_{v}^{2})\). \({u}_{kj}\) represents the managerial inefficiency term, which follows a truncated normal distribution \(u\sim{N}^{+}(0,{\sigma}_{u}^{2})\).
Based on the results of the SFA model analysis, the original input values are adjusted according to the following formula:
\({X}_{kj},{X}_{kj}^{A}\) represent the input values before and after adjustment, respectively. \(maxf\left({z}_{k},\widehat{{\beta}_{j}}\right)-f\left({z}_{k},\widehat{{\beta}_{j}}\right)\) represents the adjustment for environmental factors, and \(\text{max}\left({v}_{kj}\right)-{v}_{kj}\) represents the adjustment for random errors.
3. Table
Rights and permissions
Open Access This article is licensed under a Creative Commons Attribution-NonCommercial-NoDerivatives 4.0 International License, which permits any non-commercial use, sharing, distribution and reproduction in any medium or format, as long as you give appropriate credit to the original author(s) and the source, provide a link to the Creative Commons licence, and indicate if you modified the licensed material. You do not have permission under this licence to share adapted material derived from this article or parts of it. The images or other third party material in this article are included in the article’s Creative Commons licence, unless indicated otherwise in a credit line to the material. If material is not included in the article’s Creative Commons licence and your intended use is not permitted by statutory regulation or exceeds the permitted use, you will need to obtain permission directly from the copyright holder. To view a copy of this licence, visit http://creativecommons.org/licenses/by-nc-nd/4.0/.
About this article

Cite this article
Li, Y., Liu, Y. Route evaluation strategy of the Beijing-Tianjin multi-airport system based on the two-dimensional evaluation framework. Sci Rep 16, 14463 (2026). https://doi.org/10.1038/s41598-026-43096-5
Received:
Accepted:
Published:
Version of record:
DOI: https://doi.org/10.1038/s41598-026-43096-5
