
Fig. 1: Friction coefficients for different surfaces.
From: Unexpected large impact of small charges on surface frictions with similar wetting properties
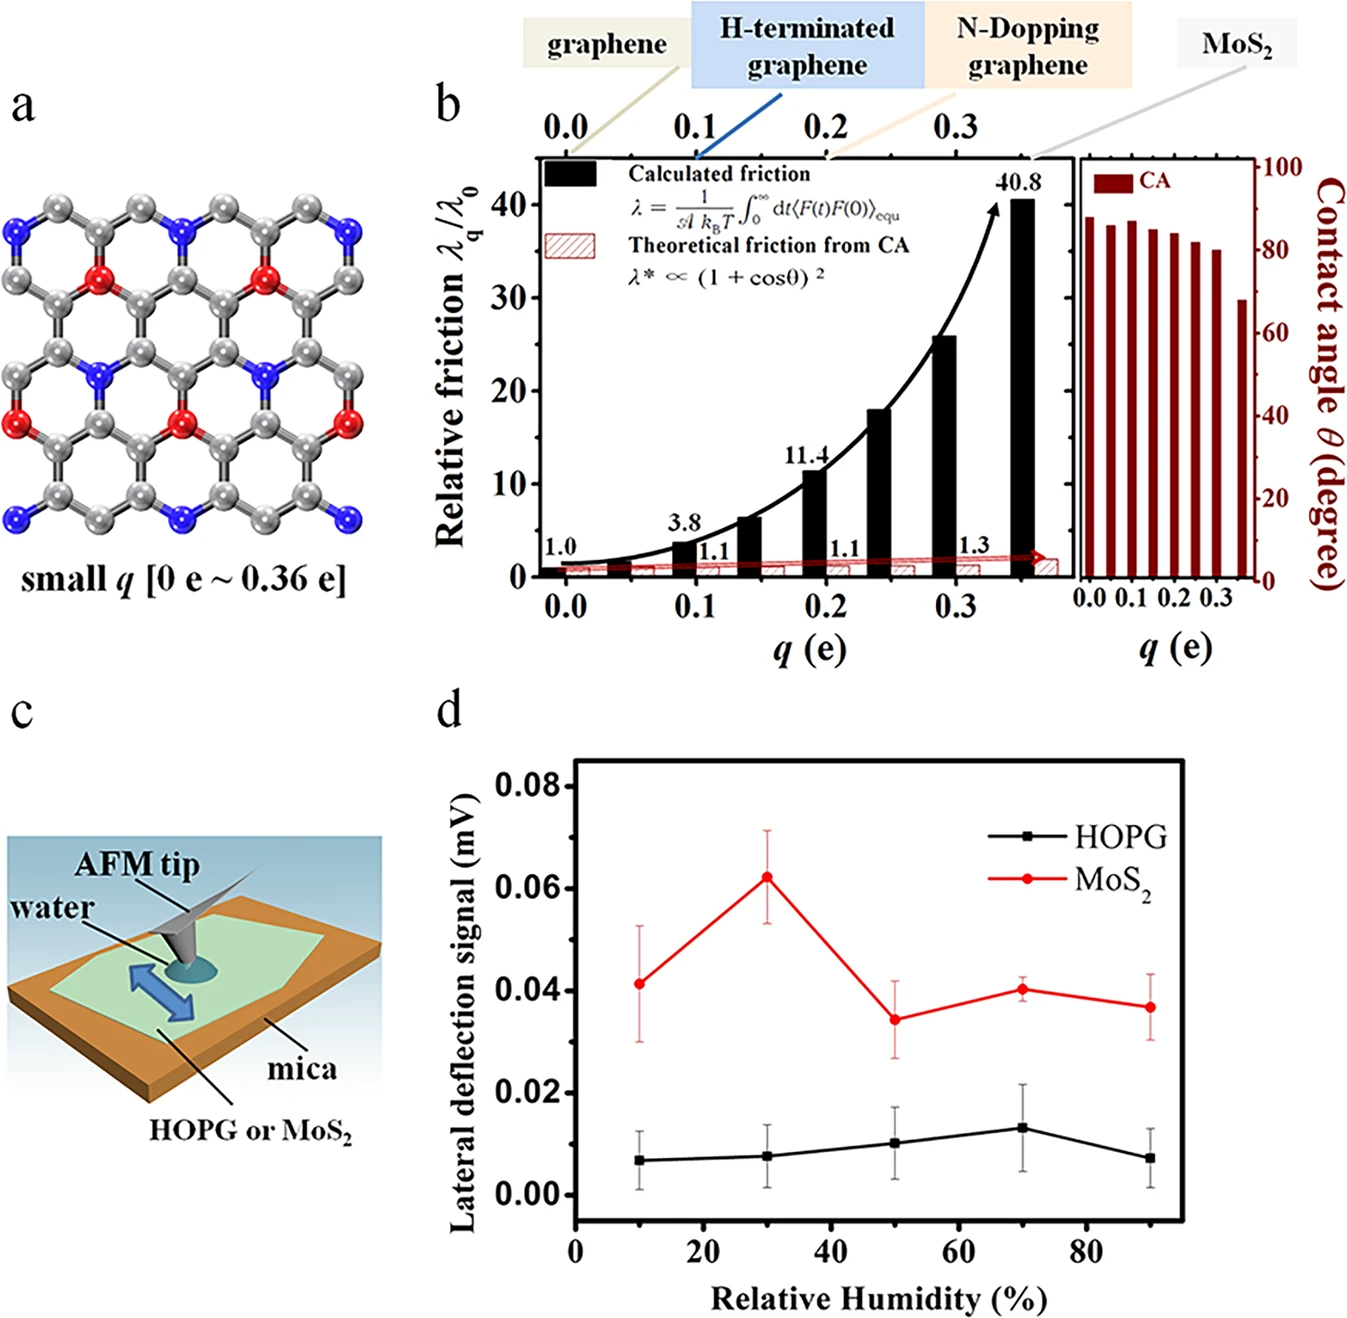
A hexagonal solid surface, the highly oriented pyrolytic graphite (HOPG) and MoS2 solid surfaces are shown. a Model hexagonal solid surface with small charge ranging from 0 e to 0.36 e. The red and blue spheres represent positive and negative charges, respectively, and the gray spheres represent neutral atoms. b Estimated relative friction coefficient λq/λ0 (q ≤ 0.36 e) of liquid water on the solid surface calculated with the Green–Kubo relationship (black solid columns), and relative friction calculated from the contact angle using the theory proposed by Huang et al. in ref. 35 (red textured columns), together with the contact angles in respect of the charge q values from 0.00 e to 0.36 e. When q increases from 0.00 e to 0.36 e, the Green–Kubo relative friction coefficient changes by a factor of 41 while the coefficient calculated from the contact angle changes by 50%. This panel also shows the typical materials with the atomic charge range from 0.00 e to 0.36 e, including graphene, hydrogen-terminated graphene, N-doped graphene, and MoS2. c Schematic for the measuring friction with an AFM tip. The arrow shows the moving direction of the AFM tip, which is perpendicular to the cantilever. A water droplet condenses from the humid environment between the hydrophilic AFM tip and the HOPG or MoS2. d Lateral deflection signal of the AFM cantilever when rubbing on HOPG or MoS2, respectively, varying with the relative environmental humidity. Error bars are the standard deviations of the lateral deflection signals with the “discrete frequency” larger than 200. The friction force is proportional to the lateral deflection signal”.
