
Fig. 1: Comparison of single residue stability curves with the global RAD_0.1 best curve.
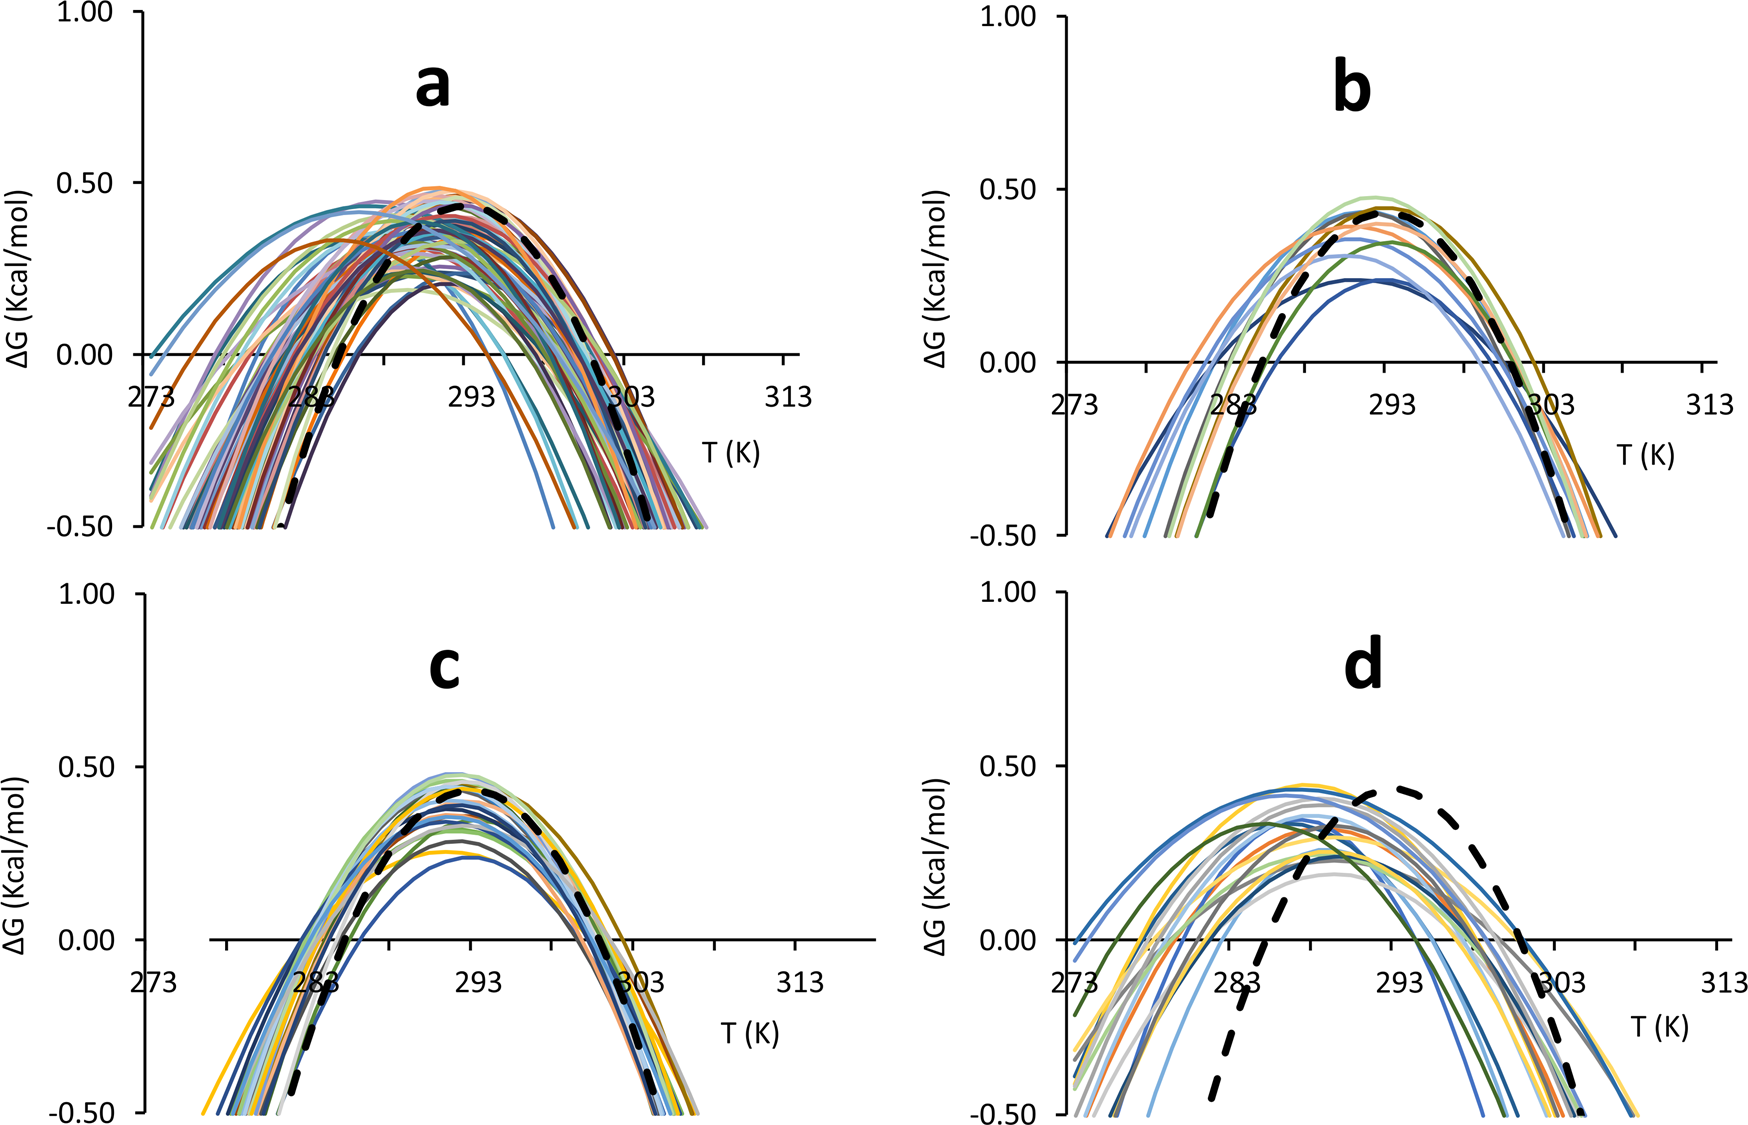
Individual curves are indicated with different colours, the global RAD_0.1 curve is indicated by a dashed black line. a Stability curves of all observable isolated residues. b Stability curves of residues with a RAD <0.1. c Stability curves of single residues for which the difference in the unfolding temperatures with respect to values of the reference curve (ΔTm and ΔTc) is on average below 1.5 °C d Stability curves of single residues for which the difference in the unfolding temperatures with respect to values of the average curve (ΔTm and ΔTc) is on average above 3 K. The colour coding is defined in Supplementary Table S1. Note that for simplicity, colour coding was automatically set by the excel software and is not the same in the different panels.
