
Fig. 2: Relative environmental footprint from GHG emissions of diet groups in comparison to high meat-eaters (>100 g d−1).
From: Vegans, vegetarians, fish-eaters and meat-eaters in the UK show discrepant environmental impacts
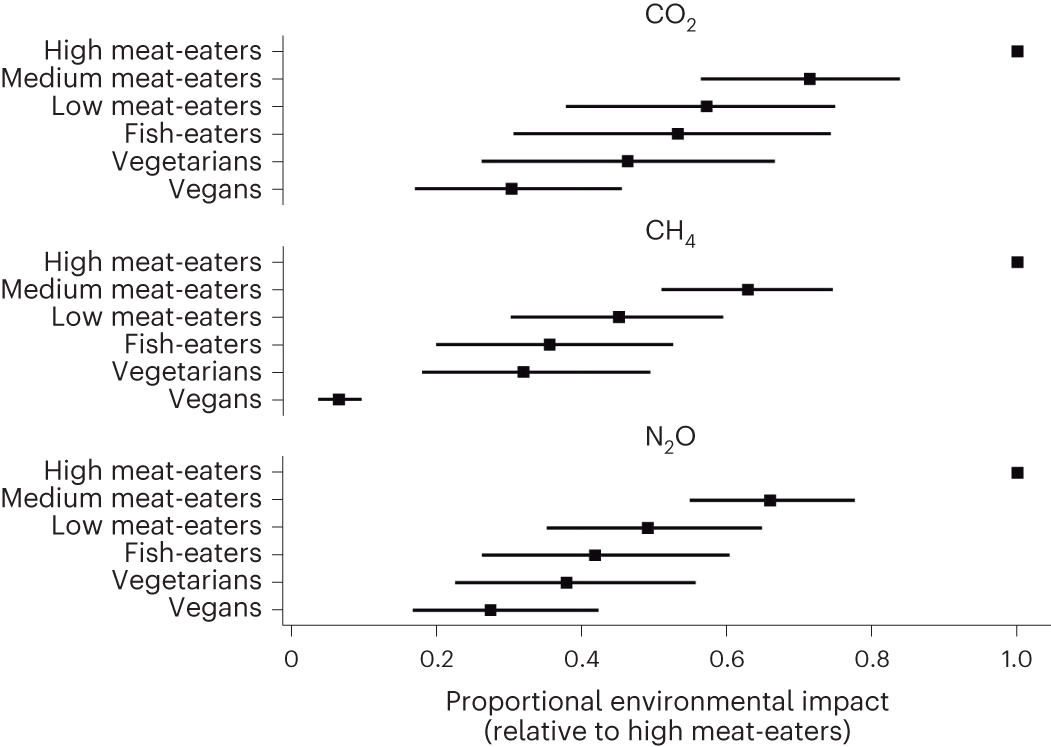
Uncertainty intervals are 2.5th to 97.5th percentiles of a Monte Carlo analysis (n = 1,000).
