
Abstract
Non-wettable surfaces, especially those capable of passively trapping air in rough protrusions, can provide surface resilience to the detrimental effects of wetting-related phenomena. However, the development of such superhydrophobic surfaces with a long-lasting entrapped air layer, called plastron, is hampered by the lack of evaluation criteria and methods that can unambiguously distinguish between stable and metastable Cassie-Baxter wetting regimes. The information to evaluate the stability of the wetting regime is missing from the commonly used contact angle goniometry. Therefore, it is necessary to determine which surface features can be used as a signature to identify thermodynamically stable plastron. Here, we describe a methodology for evaluating the thermodynamic underwater stability of the Cassie-Baxter wetting regime of superhydrophobic surfaces by measuring the surface roughness, solid-liquid area fraction, and Young’s contact angle. The method allowed the prediction of passive plastron stability for over one year of continuous submersion, the impeding of mussel and barnacle adhesion, and inhibition of metal corrosion in seawater. Such submersion-stable superhydrophobicity, in which water is repelled by a stable passive air layer trapped between the solid substrate and the surrounding liquid for extended periods at ambient conditions, opens new avenues for science and technologies that require continuous contact of solids with aqueous media.

Introduction
For thousands of years, humans had the desire to stay dry underwater. This can be accomplished by trapping a thin layer of air between a submerged solid and the surrounding liquid1. Researchers have been striving for decades to imitate the extreme water repellency of lotus leaves2, one of many natural systems that exhibit superior water repellency3. Various man-made surfaces inspired by nature have been designed and studied for their extreme hydrophobicity, which are named superhydrophobic surfaces (SHS)4. The application of such surfaces to solid substrates in contact with water is proving advantageous for many technologies5,6,7.
Despite extensive research, current achievements in the field fall short of meeting industrial requirements for several reasons8,9. The wetting repellency of solids is achieved by combining multiscale hierarchical structuring of their surfaces with low surface energy materials. The required high roughness reduces the mechanical robustness of the surfaces compared to the bulk, which presents a key challenge10. Therefore, for decades, research has emphasized this challenge of improving SHS through several approaches11,12,13,14. Another property, i.e., low surface energy materials, reduces attractive interactions between water and the coated solid surface, allowing the formation of a thin layer of air, called plastron, within rough protrusions. Plastrons were first observed on aquatic insects15,16,17, while Cassie and Baxter were the first to provide a mathematical description of such aerophilic surfaces18. However, the trapped air on underwater SHS lacks passive stability and disappears over time, leading to the Cassie-to-Wenzel transition, i.e., the transition from a non-wetted (Cassie–Baxter, heterogeneous) to a fully wetted (Wenzel, homogeneous) wetting regime, exposing a solid substrate with increased surface area to water19. The latter challenge has received considerably less research attention, as it is widely accepted that plastrons are metastable underwater5,20,21,22. Since it was observed that plastrons on most natural SHS last no longer than a few days23, the characterization of artificially made SHS by submersion is still an uncommon practice.
In general, each superhydrophobic surface can be characterized by measuring two specific apparent contact angles (CAs), which are the macroscopically measurable angles between the droplet and the solid at the three-phase contact line. The apparent CAs can be measured by fitting a model such as Laplace–Young to the droplet edge and the baseline, which is the line connecting the two three-phase contact points in the side view image of a droplet. These two specific apparent angles are the advancing and receding CAs, i.e., the largest and smallest metastable apparent CAs on a given surface. The difference between the advancing and receding CAs is called contact angle hysteresis (CAH), which describes lateral adhesion and mobility of the liquid droplet24. The CAH, or more accurately the difference between the cosines of the advancing and receding CAs, is also related to the roll-off angle (also tilt/sliding angle), which describes the angle at which the droplet begins to move on a tilted surface. When the advancing CA exceeds 150°, the CAH is less than 10°, and/or the sliding angle is below 5°, the surface is generally considered superhydrophobic25. Many studies use an average of static CA and CAH values to report the quality of artificially made SHS26. However, a static CA, which is measured from a droplet after it has landed on the surface, does not contain relevant information about the wetting regime. As stated in ref. 25, the static CA “is a meaningless measurement, since there is a random element involved in the process of drop landing—that is, the contact can be any value within the range of advancing and receding contact angles; therefore, this contact angle is not useful for any analysis.” As a gold standard, the advancing and receding CAs should be carefully measured27, and then the estimation of the most stable CA (MSCA), for example, by averaging the advancing and receding CAs28, and the calculated CAH values should be reported. It should be noted that many theories use Young’s CA, which is not a measurable quantity and can only be estimated with the MSCA on a smooth and chemically homogeneous surface25.
However, there are several difficulties with these measurements. First, it is challenging to measure these values for surfaces with remarkably high CA (e.g., >170°) and incredibly low CAH (e.g., <1°). The latter is difficult due to the tendency of drops to roll off rapidly from these surfaces, and the former is due to the unreliability of the measured CAs resulting from minor changes in the baseline location29. Therefore, alternative techniques have recently been proposed to more accurately characterize ultra-slippery SHS by direct frictional force measurements30,31.
Furthermore, goniometric measurements do not explicitly reveal the plastron characteristics of submerged solid surfaces. This is because multiple wetting regimes may exist on the same surface, that is Cassie–Baxter or Wenzel, some of which are stable, while others are metastable. More specifically, there is no standard method for characterizing the plastron of submerged SHS that makes the comparison between various SHS often impossible. To be useful in underwater applications, SHS should be in the stable Cassie–Baxter wetting regime that allows for a meaningful lifetime of the plastron32,33,34. Although various engineered SHS have been developed over the past few decades, their limited underwater lifetime makes them technologically impractical for further commercialization. To date, the duration of the passive plastron on engineered SHS underwater varies from a few minutes to several weeks20,35,36.
We have recently developed Ti alloy superhydrophobic surfaces (Ti-SHS) with thermodynamically stable plastron33. To further investigate plastron longevity, Ti-SHS were immersed in water and maintained at a constant depth of 1 cm at ambient environment without any active plastron regeneration. Note that such a simple experiment can result in large fluctuations in the water temperature, which in turn translates into a notable increase in submersion depth (see “Methods”). As previously reported, plastron decays rapidly after a well-defined onset time as a function of submergence depth, transitioning from Cassie–Baxter to Wenzel wetting regimes20,37. The metastability limitation of plastron has generally been attributed to the increased diffusion of air into water. Thermodynamic theories have been established to explain the stability of plastron but these have rarely been applied to the developed SHS20,32,38,39, making this statement mostly speculative. This is because a Cassie-to-Wenzel transition may occur due to the metastability of the plastron on the developed SHS resulting from small perturbations of external stimuli such as temperature, hydrostatic pressure, mechanical vibration, and surface contamination40,41, but also due to fluid flow, chemical reactions or the consumption of air by biological processes21,36,42. On the contrary, our Ti-SHS exhibited 40 times longer plastron at 0.5 m depth than previously reported20, showing gradual degradation in certain areas that are on the edge between stable and metastable thermodynamic conditions33. Therefore, it is crucial to develop quantitative approaches to unambiguously determine the plastron stability to predict the long-term performance of engineered SHS in aqueous media.
This research presents a generally applicable approach for the characterization of any engineered SHS to explicitly obtain their wetting regime, as well as the stability of the plastron underwater. This is achieved by measuring (i) the dimensionless Wenzel roughness parameter, (ii) the solid–liquid area fraction, and (iii) Young’s contact angle. These measurements are then applied to the thermodynamic theories proposed by Lafuma and Quéré38, and Marmur32. The proposed approach of quantitative analysis of plastron enabled the prediction of the stability of the developed SHS immersed in aqueous media, including seawater, not only in terms of longevity but also in terms of biofouling and corrosion resistance performances, all of which cannot be obtained by the common contact angle goniometry.
Results and discussion
Figure 1a, b shows digital images of Ti-SHS after the immersion on day 0 and day 365. The experiment was terminated after one year by removing the Ti-SHS from the water (see Supplementary Movie S1). While Ti-SHS are non-reflective in air (Fig. 1c, d), the same substrates exhibit a mirror-like appearance in water due to the phenomenon of total internal reflection at the air–water interface36. For long-term measurements, the air bubble was injected on day 0 to visualize the loss of plastron. These bubbles would disappear, for instance, on metastable SHS, because of the shift from the Cassie–Baxter to the Wenzel wetting regime due to small perturbations from the equilibrium induced by external stimuli40,41, thus allowing easy observation of this transition (Supplementary Movie S2). The harvested Ti-SHS were re-immersed in water showing a mirror-like reflection, indicating the persistence of the plastron and confirming the Cassie–Baxter wetting regime (Fig. 1e, f and Supplementary Movie S1). The apparent static CAs before immersion and after the harvesting of Ti-SHS are shown in Fig. 1g, h, still demonstrating exceptionally low adhesion of water to these surfaces (see Supplementary Movie S3).

a, b Digital images of Ti-SHS on day 0 (a) and day 365 (b) of water immersion. c, d Digital and optical microscopy images of the Ti-SHS samples demonstrate low reflectance in air. e, f Digital and optical microscopy images of the Ti-SHS sample demonstrate mirror-like reflectance after 1 year of immersion underwater. The optical micrograph in (f) shows the existence of plastron on the harvested Ti-SHS even after immersion in water for one year. The smooth, bright-gray areas are attributed to the liquid–air interface, while the darker, randomly distributed spots are pinning points, i.e., the solid–liquid interface. g, h Water contact angle on day 0 (g) and day 365 (h) of continuous immersion underwater.
But what makes Ti-SHS different from other SHS? Typical goniometric measurements could not answer this question. For Ti-SHS, we measured an average apparent CAs of 170.0° ± 8.6° and a tilt angle of 0.7° ± 0.3°. The values obtained through traditional goniometry are consistent with the state-of-the-art SHS previously reported30,31,43,44,45. Thus, alternative approaches are needed to estimate the plastron stability and to compare them with the state-of-the-art SHS.
Here, we propose a method for characterizing SHS, particularly those in the Cassie–Baxter wetting regime for underwater applications. It is crucial to characterize plastron on solid surfaces underwater in terms of surface roughness, solid–liquid area fraction, and Young’s CA:
-
(i)
The dimensionless surface roughness parameter (r) as defined by Wenzel is calculated by dividing the actual surface area by the projected area46. To obtain this, atomic force or optical microscopy measurements could be used at a resolution equal to or higher than the smallest features on the developed rough surface (Fig. 2a).
Fig. 2: The methodology to characterize superhydrophobic surfaces for their plastron stability underwater. 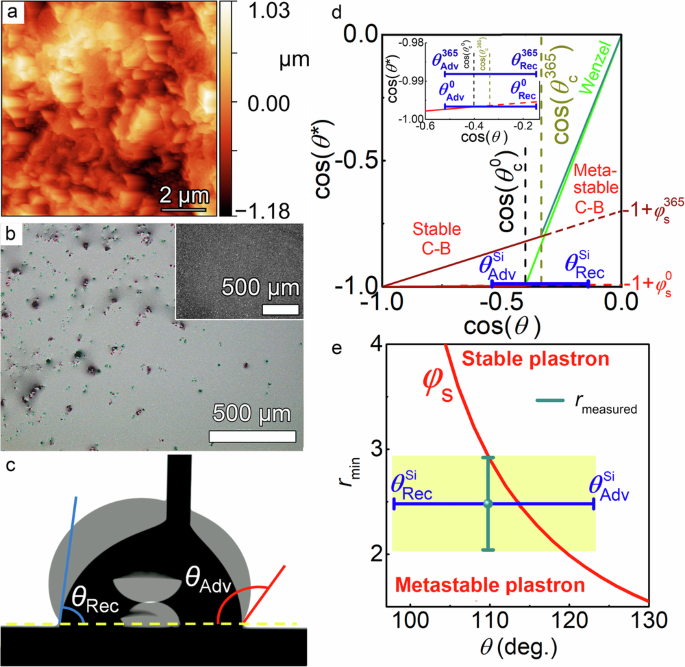
a A typical atomic force microscopy image used to calculate roughness parameter (rmin). b A typical bright-field optical reflectance microscopy image of Ti-SHS underwater used to calculate the solid–liquid area fraction (φs). The inset image represents the same Ti-SHS measured by bright-field optical reflectance microscopy in air. c The advancing and receding CAs measured on the smooth substrate with the same hydrophobic origin were used to estimate the most stable CA. The image is obtained by overlapping images for the advancing and receding CAs. d The Lafuma and Quéré diagram is used to calculate the critical CA to determine the stability of the wetting regime of the developed Ti-SHS on day 0 (black dashed line) and on day 365 (dark yellow dashed line). Here, θ is the CAs measured on a smooth surface coated by the fluorinated surfactant, θ* is the apparent CA measured on Ti-SHS, φs0 and φs365 are the solid–liquid area fraction on day 0 and on day 365. The inset is the increased area of the apparent CA change before and after one year of immersion. e The Marmur diagram is used to calculate whether the developed Ti-SHS has a stable or metastable plastron. The area shaded in yellow represents the stability of the plastron based on the advancing and receding CAs measured on a flat surface coated by the same hydrophobic molecule and roughness parameter of SHS. The most stable, advancing, and receding CAs and dimensionless roughness parameter were measured on N = 3 independent samples, while the data represent the measured average value and the s.d.
-
(ii)
The solid-to-liquid area fraction (φs) represents the portion of the projected surface area, where water is in contact with the solid substrate. This can be measured, for instance, by optical reflectance microscopy, while the SHS are immersed in water (see Figs. 1f and 2b). The smooth, bright-gray areas in such images represent the liquid–air (plastron) interface. The darker points, which are randomly distributed, correspond to the solid–liquid (pinning) points, i.e., where the liquid is actually in contact with the solid substrate. These plastron measurements do not provide the thickness of the plastron, but its existence and lateral distribution on a millimeter length scale and are more sensitive than either macroscopic images obtained with a digital still camera (as discussed in the results below)20,47, or confocal microscopy cross-sectional images obtained on a micrometer length scale20,48. Note that the parameter should be measured at equilibrium, as the plastron shape and surface coverage can potentially change after the immersion in liquid as described in the results below. In theory, such equilibrium can be achieved anywhere from sub-seconds to minutes, and even longer. Thus, it is important to monitor the submerged surface and the plastron to ensure that the latter has reached equilibrium over an appropriate period.
-
(iii)
The Young’s CA value is estimated by the MSCA25. The latter is measured by the goniometer on as smooth as possible surface with the same hydrophobic coating as in developed SHS. However, there is no generally accepted technique for precisely determining the MSCA. Suggested alternatives for measuring the MSCA include either a tilted (rotational) or vibrating (e.g., either mechanical or acoustic) stage, i.e., to overcome the energy barriers between the metastable states to reach the lowest Gibbs energy values, so that the Young’s CA value can be estimated25,49. However, it is often impossible to achieve a sufficiently smooth surface from the same bulk material, such as metals, or chemically homogeneous coating applied to a smooth surface but of a different origin. Nevertheless, the MSCA is located between the advancing and receding CAs, thus the receding CA is a lower bound for the MSCA (Fig. 2c).

By measuring these three parameters, we can apply the thermodynamic theories described by Lafuma and Quéré, and/or Marmur to determine the wetting regime of the developed SHS, either stable or metastable Cassie–Baxter wetting regime, which predicts the longevity of the plastron. Even though both theories are well-established, they have rarely been applied to determine plastron stability underwater on engineered SHS due to the difficulties in obtaining all required parameters.
In the case of Lafuma and Quéré38, the critical contact angle (θc) is calculated according to Eq. (1):
A comparison between the interfacial energies associated with Wenzel and Cassie–Baxter wetting regimes according to Eq. (1) confirms that plastron should be favored only if the Young’s CA (θY), represented by the MSCA (θ), is larger than the critical CA (θc)50,51. By obtaining all three parameters, it is possible to draw a diagram, where the apparent CA (θ*) is shown as a function of the MSCA (Fig. 2d). Here, the stable Cassie–Baxter and Wenzel wetting regimes are represented by a solid line, while the dashed line represents the metastable Cassie–Baxter wetting at a moderate hydrophobicity (90° < θ < θc).
Marmur theoretically analyzed the stability of plastron on SHS underwater32. He formulated thermodynamic equilibrium and stability conditions to minimize the solid–liquid contact area. According to calculations, underwater superhydrophobicity might be feasible producing thermodynamically stable plastron such that the liquid–air surface is at the top of the rough asperities. This thermodynamically stable plastron requires a minimum roughness ratio (rmin), which depends on Young’s CA and the solid–liquid area fraction according to the following equation:
Here, θ is the Young CA (estimated with e.g., the MSCA), r is the dimensionless roughness, and φs is the solid–liquid area fraction. rmin is the minimum required value of the roughness ratio to achieve stable superhydrophobicity at given φs. Figure 2e depicts the typical relationship between r and θ. However, all three parameters must be known to accurately predict whether the developed surface is in a stable plastron regime.
The theories of Lafuma and Quéré, Eq. (1) and Marmur, Eq. (2) allowed us to predict the long-term stability of the SH systems underwater as in the case of Ti-SHS. We measured the roughness parameter of r = 2.48 ± 0.44 formed by randomly distributed protrusions (the average value was obtained using atomic force microscopy, optical profilometry, and laser confocal microscopy)33. Note that it is still challenging to achieve surface roughness with high precision on such hierarchically micro/nano-rough structures. The solid–liquid area fraction of φs = 0.0054 ± 0.0047 was measured by the optical reflectance microscopy on day 0, and the MSCA (θMS = 109.8° ± 3.9°) was estimated by the average of the advancing (θAdv = 122.6° ± 1.4°) and receding (θRec = 97.0° ± 3.6°) CAs measured on the 100-nm-thick SiO2 film deposited on Si wafer and coated by the fluorinated surfactant (FS)33. It is noteworthy that although the MSCA was proposed to be approximated as the mean cosine or arithmetic mean of the advancing and receding CAs28, the global minimum free energy of the system may differ from this value. Thus, the thermodynamic stability criteria were estimated using the entire range between the advancing and receding CAs. Considering the limitation of the MSCA, these values predict the possibility of a stable Cassie–Baxter wetting regime and plastron underwater based on Eq. (1) (Fig. 2d) and Eq. (2) (Fig. 2e).
The harvested Ti-SHS specimens were used to further recalculate the critical CA (θc365) using Eq. (1) with the following parameters: (i) the advancing and receding CAs and, thus, the MSCA (which is an intrinsic property of a hydrophobic coating) remain unchanged, (ii) the dimensionless roughness parameter is constant, (iii) the apparent CA decreases to 171.3° (Fig. 1h), and (iv) the solid–liquid area fraction increases to 0.29 ± 0.10 (see Fig. 1f), resulting in a critical CA of 109.6° (Fig. 2d). According to the calculations, the harvested Ti-SHS maintain a Cassie–Baxter wetting regime even after one year of continuous immersion under water, which explains the high reflectivity of these samples underwater (Fig. 1e).
Given the above considerations, identifying the specific factors that govern the stability of the plastron and the resulting underwater performance of the SHS is a formidable challenge. This is due to the large variety of designs present in both natural and man-made SHS as well as the lack of standardized measurement protocols and equipment. However, it is crucial to anticipate the performance of SHS underwater through simple and widely available methods. This can be achieved by characterizing specific sets of features that are responsible for performance differences of SHS underwater for closely related treatment systems using a reflectance microscopy technique as a first (rough) approximation. To demonstrate the general applicability of the method, two sets of SHS with plastron were prepared: (i) the same hydrophobic molecule but different anodized Ti surface morphologies, designated Ti-SHS1-FS and Ti-SHS2-FS (Supplementary Fig. S1 and Supplementary Table S1), and (ii) the same anodized Ti surface morphology but different hydrophobic coatings, designated Ti-SHS1-FS and Ti-SHS1-Sil (Supplementary Table S2). Plastron stability and surface coverage were then evaluated over time by immersing the SHS in water (Fig. 3). The optical reflectance microscopy measurements provide the change in plastron shape and surface coverage over a millimeter scale range, while plastron instability can be easily obtained within minutes (Fig. 3).

a–i Plastron stability and j corresponding solid–liquid area fraction change as measured using optical reflectance microscopy imaging for Ti-SHS1-Sil (a–c), Ti-SHS2-FS (d–f), Ti-SHS1-FS (g–i). The samples were immersed in water, and the images were captured immediately. Inset images in (a, d, g) represent the apparent CAs measured on the corresponding samples at time 0. k–m Marmur diagrams for the Ti-SHS1-Sil (k), Ti-SHS2-FS (l), and Ti-SHS1-FS (m) samples. The solid–liquid area fraction in (k) is shown for the time zero. Inset in (l) is the 3D reconstruction AFM image of the Ti-SHS2-FS sample. The yellow area in (k–m) covers all configurations of plastron based on the advancing and receding CAs measured on a flat surface and the roughness parameter of the corresponding SHS system. The most stable, advancing, and receding CAs and dimensionless roughness parameter were measured on N = 3 independent samples, while the data represent the measured average value and the s.d. n Mean mussel adhesion strength on Ti-SHS1-Sil, Ti-SHS2-FS, Ti-SHS1-FS, and polyurethane (PU) control samples. The green star indicates that the mussels failed to adhere to the coating surface. The black numbers indicate the number of mussels that adhere to the coating surface. Error bars show s.d.; N = 6. o Mean adult barnacle adhesion to Ti-SHS1-Sil, Ti-SHS2-FS, Ti-SHS1-FS, and PU control samples. The red numbers indicate the barnacle shell and/or base plate broke during the test and remained on the coating surface, indicating a coating failure. The black number indicates that the barnacles adhere to the coating surface. Error bars show s.d.; N = 6.
In the case of Ti-SHS1-Sil, the basic condition is not fulfilled (Fig. 3a–c, j, k). The MSCA measured on the 100-nm-thick SiO2 deposited on the Si wafer and functionalized with the Laureth-4 phosphate (Sil) molecule shows significantly lower values as compared to the fluorinated surfactant (FS), indicating insufficient hydrophobicity of the coating (Figs. 2e and 3k). Despite having a similar roughness parameter as Ti-SHS1-FS, but a substantially lower MSCA, Ti-SHS1-Sil always remain in the metastable plastron region even at the lowest values of solid–liquid area fraction (Fig. 3j). The latter explains the fact that the plastron on the Ti-SHS1-Sil samples degrades continuously with time, eventually reaching homogeneous (Wenzel) wetting after 2 h of immersion (Fig. 3c and Supplementary Movie S4).
In the case of Ti-SHS2-FS (Supplementary Fig. S1b, d), the air bubbles, which formed spontaneously on the surface during the immersion process, disappeared within minutes (Supplementary Fig. S2). The plastron undergoes gradual decay for ~60 min before reaching a state of near stability (Fig. 3d–f, j, l and Supplementary Movie S5). After 2 h, the plastron exhibits an irregular broken pattern surrounded by wet regions (Fig. 3f, dark regions). Such plastron performance is attributed to the partial fulfillment of thermodynamic conditions at the micro/nano-rough protrusions but not at the flat surrounding areas (Fig. 3l, inset image and Supplementary Fig. S1b, d). At the same time, Ti-SHS1-FS exhibit stable plastron for more than 2 h with minimal changes, indicating the fulfillment of thermodynamic stability conditions on the Ti-SHS1-FS surfaces (Fig. 3g–i, j, m and Supplementary Movie S6). The suggested metric can assess plastron stability within a reasonable timeframe, and thus, can be used even before measurements with more complex parameters such as roughness, the MSCA, and plastron thickness.
Biofouling is a natural process of colonization by aquatic micro/macro-organisms on any surface that is in continuous contact with water. The process can accelerate the corrosion of metals, degrade and damage infrastructure, and reduce the efficiency of marine systems, leading to enhanced fuel consumption, water pollution, and greenhouse gas emissions. As biocidal mitigation approaches come more under increasing regulatory restrictions due to their apparent non-specific impact on aquatic life, fouling-release, and fouling-prevention treatments have been explored as non-toxic alternatives52. The role that SHS might play in the field of marine biofouling prevention has been unclear51, particularly due to the short lifespan of plastron underwater37. Only recently we have demonstrated that thermodynamically stable plastrons with an extended lifespan can effectively reduce the adhesion of bacteria and marine organisms33.
Here, the role of plastron stability was further investigated by exposing Ti-SHS1-FS, Ti-SHS2-FS, and Ti-SHS1-Sil to marine model organisms, namely mussels and barnacles. It is known that mussels attach firmly to wet surfaces through secreting mussel foot proteins53, whereas barnacles secrete a multi-protein complex known as biocement that solidifies at the adhesion site and is insoluble in water54. As shown in Fig. 3n, mussel (Geukensia demissa) adhesion readily occurred on non-stable Ti-SHS1-Sil and partially stable Ti-SHS2-FS surfaces but was completely prevented by Ti-SHS1-FS with stable plastron. The latter demonstrates not only that the Ti-SHS1-FS plastron was stable under submersion in a seawater medium containing live mussels throughout the duration of the experiment (3 days), but was also able to resist the deposition of mussel plugs, either by providing a detectable barrier that “confused” the mussel preventing it from depositing the adhesion proteins or by resisting the deposition of the proteins entirely55,56. Importantly, as our data show, the inability of mussels to adhere is not just a function of a single specific material used but requires the combination and synergy between material, surface structuring, and hydrophobic functionalization that results in a stable plastron regime (Fig. 3g–i).
Barnacle (Amphibalanus amphitrite) re-adhesion, which is considered a much stronger predictor of marine biofouling performance, followed a similar trend57. A. amphitrite adhered to all treatments, but the adhesion strength was significantly lower on Ti-SHS1-FS with stable plastron underwater compared to controls, non-stable Ti-SHS1-Sil, and partially stable Ti-SHS2-FS (Fig. 3o). It is noteworthy that there was no detectable fouling-preventive effect of the partially stable SHS treatment (Ti-SHS2-FS) in either the mussel adhesion or barnacle re-adhesion experiments, indicating that only a stable plastron regime can provide a substantial degree of biofouling prevention performance. The biofouling results demonstrate the beneficial role of thermodynamically stable plastron in preventing biofilm development on SHS, indicating that this information is essential for research, development, and further application of SHS underwater.
To further prove the general applicability of the proposed characterization methodology, it was applied to SHS made from aluminum (Al). The micro-nanostructures were fabricated first by (i) chemical etching (E-Al) followed by (ii) electrochemical anodization (EA-Al) (Fig. 4a1-2). These samples were coated with FS, termed E-Al/FS and EA-Al/FS for the etched and etched/anodized specimens, respectively (Fig. 4b). The static CAs were measured and found to be 171.4° ± 7.6° and 169.8° ± 9.0° for E-Al/FS and EA-Al/FS, respectively (Fig. 4c1-2, inset images). Both types of Al-SHS exhibit a Cassie–Baxter wetting regime with comparable advancing and receding CAs resulting in the landed drops rolling off instantly (Supplementary Fig. S3a, b and Supplementary Movie S7). The roughness parameter was measured by atomic force microscopy yielding a value of r = 3.44 ± 0.07 for EA-Al/FS and r = 1.65 ± 0.19 for E-Al/FS (Fig. 4d). As discussed previously, AFM imaging yielded the lowest roughness parameter among the available alternatives33. The plastron shape and coverage were estimated using digital still imaging and bright-field optical reflectance microscopy on the submerged samples. Both E-Al/FS and EA-Al/FS exhibit highly reflective surfaces underwater due to plastrons that cover the entire specimen area (Supplementary Fig. S3c, d). In contrast, the bright-field optical reflectance microscopy images reveal a completely different plastron shape and solid–liquid area fraction. While the plastron on EA-Al/FS was continuous with randomly distributed round pinning points and a solid–liquid area fraction of φs = 0.16 ± 0.08 (Fig. 4c2), the E-Al/FS demonstrated an irregular shape with a solid–liquid area fraction of only φs = 0.75 ± 0.03 (Fig. 4c1). The latter is due to the deficiency of oxide/hydroxide groups resulting in the low FS coverage, which fails to form a thermodynamically stable plastron, i.e., with the liquid–air interface at the top of the asperities (Fig. 4b, Supplementary Figs. S4 and S5, Supplementary Table S3, and Supplementary Section S4). Finally, the MSCA (θSiMS) was previously obtained for Ti-SHS and compared to the advancing (θAlAdv = 121.9° ± 3.4°) and receding (θAlRec = 74.9° ± 5.7°) CAs on the FS-coated polished Al samples. While the advancing CAs on both surfaces are similar, the receding CA on the polished Al is much lower due to the higher surface roughness on Al58. With the measured solid–liquid area fraction and roughness parameter, the critical CA was calculated according to Eq. (1) and was found to be θC = 93.5° for EA-Al/FS. By comparing the MSCA and critical CA, we predict that EA-Al/FS are in a stable Cassie–Baxter wetting regime (Fig. 4e). Using Eq. (2), the stability of plastron underwater was estimated on EA-Al/FS, also predicting stable plastron (Fig. 4f). Our preliminary results indicated that the mechanical characteristics of the E-Al/FS and EA-Al/FS specimens, determined by the nanoindentation technique, reveal values of hardness comparable to those of the bare Al and an elastic modulus within the gigapascal (GPa) range.

a Scanning electron microscopy images of the E-Al/FS (a1) and EA-Al/FS (a2) samples. b Energy-dispersive X-ray spectroscopy (EDS) measurements of the bare, E-Al/FS, and EA-Al/FS samples. c Optical reflectance microscopy image of the E-Al/FS (c1) and EA-Al/FS (c2) samples immersed underwater to assess air plastron shape and surface coverage. Inset images are the apparent water CA measured on the E-Al/FS and EA-Al/FS surfaces. d 3D reconstruction AFM image of EA-Al/FS. e Lafuma and Quéré diagram demonstrates the stability of the Cassie–Baxter wetting regime on the EA-Al/FS samples. f Marmur diagram calculated for bare and EA-Al/FS samples using the solid–liquid area fraction values as shown in (c). g–h Digital images showing the bare Al (g) and EA-Al/FS (h) samples were recorded on day 0 and on day 234 of immersion in artificial seawater. The bottom images were captured at a grazing angle to prove the existence of plastron on the EA-Al/FS samples by their high reflectivity, in contrast to the bare Al samples that were severely corroded. The most stable, advancing and receding CAs and dimensionless roughness parameter were measured on N = 3 independent samples, while the data represent the measured average value and the s.d.
To evaluate our hypothesis of plastron stability, the corrosion resistance of the developed Al-SHS was examined. It is well known that Al is susceptible to corrosion in marine environments due to aggressive chloride ions. We anticipate that the plastron, serving as a dielectric barrier, will improve the corrosion resistance of Al. Electrochemical measurements in an aqueous 3.5 wt.% NaCl electrolyte confirmed the remarkable corrosion protection of EA-Al/FS, while all other surfaces, spanning from superhydrophilic to superhydrophobic, showed only marginal improvements (Supplementary Fig. S6). Yet, such plastron will be useful if SHS exhibit a stable, long-lasting wetting-repellent performance. Therefore, the E-Al/FS, EA-Al/FS, and bare (B-Al, control) samples were immersed in artificial seawater. The bare Al samples corrode within 3 weeks (Fig. 4g and Supplementary Fig. S7), while the E-Al/FS exhibit pronounced corrosion products already after one day of immersion due to the loss of plastron and exposing high surface area substrates to a corrosive medium (Supplementary Fig. S8). At the same time, the EA-Al/FS exhibit corrosion-free performance even after ~8 months (234 days) of continuous immersion in seawater still demonstrating a highly reflective plastron (Fig. 4h and Supplementary Figs. S7 and S8d–f). The EA-Al/FS substrates demonstrate 4 times longer infinite passive air trapping in highly corrosive seawater39. This long-term immersion test provides evidence to support our hypothesis of corrosion protection for SHS due to (i) the stable and continuous plastron that eliminates contact of the highly corrosive media with the Al surface (Fig. 4h, bottom image), and (ii) the FS coating delays the onset of corrosion at the pinning points59. At the same time, the wetting-repellent resistance of SHS with a metastable plastron is short-lived, corroding rapidly due to their high surface area. This is distinct from goniometric measurements, which are unable to predict the corrosion performance of SHS based on the apparent CA as shown in Supplementary Fig. S9.
Conclusions
This research breaks through the “wall of plastron metastability” and proves that stable (passive) air entrapping underwater is feasible. The proposed methodology facilitates the quantification of plastron, thus resulting in the projection of the superhydrophobic coating’s protective capability over months and even years of continuous immersion underwater. However, challenges remain in accurately predicting the stability of plastron in a real-world environment. The solubility of oxygen and nitrogen in water on SHS with stable plastron requires in-depth analysis regarding immersion depth, temperature, and pH, among others. The presence of various ions and molecules in water can negatively affect plastron or react with solids. Accurate methods are urgently needed to measure the MSCA in terms of devices and smooth surfaces with homogeneous hydrophobic chemistry. Also, obtaining surface roughness with high precision remains a challenge with the available techniques. Finally, the ability to rapidly self-heal surface defects, coupled with a mechanically robust approach and a thermodynamically stable plastron, will make superhydrophobic technology valuable for practical applications.
Methods
Materials
Titanium alloy (Ti-6A-l4V, grade 5) sheets of various thicknesses (0.25, 0.4, and 0.8 mm) were purchased from Titanwerk, Germany. Aluminum (99.5%, 1000-grade) was purchased from Advent Research Materials, UK. Phosphate ester of the mixed length of fluorinated alkyl chains surfactant ((CF3-(CF2)5-9-(CH2)2-O)2-POOH, FS-100, abbreviated here as FS) was acquired from Chemguard, USA. Poly(oxy-1,2-ethanediyl), α-dodecyl-ω-hydroxy-, phosphate ((C2H4O)4C12H25O4P, laureth-4 phosphate, Silaphos MDE 12, abbreviated here as Sil) was bought from Schill & Seilacher GmbH, Germany. Sodium hydroxide, hydrogen peroxide, hydrochloric acid, oxalic acid, acetone, and ethanol were purchased from Carl Roth, Germany. Potassium hydroxide and potassium phosphate were purchased from Sigma-Aldrich, USA. All chemicals were analytical-grade reagents and used as received. DI water (18.2 MΩ cm) was used in all experiments (ELGA, Purelab Ultra, UK).
Titanium electrochemical anodization
Ti-SHS1
Ti alloy sheets were cut to the following sizes: 25 × 25 mm. Before anodization, the substrates were cleaned ultrasonically in acetone and ethanol for 10 min to remove contamination. The electrochemical cell consists of a stainless steel (316 grade) counter electrode of comparable size as a Ti alloy sheet, a Ti alloy sheet was used as a working electrode, and a 1.5 M NaOH aqueous solution as electrolyte. In total, 1 vol.% H2O2 was added to the NaOH electrolyte just before anodization. The counter and working electrodes were placed 20 mm away from each other. Anodization was carried out at an applied potential of 15 V for 30 min. Note that when using larger samples, the cell should be kept in a big reservoir of water at room temperature. As-anodized samples were then removed from the electrolyte, rinsed with DI water, and dried under a stream of N2.
Ti-SHS2
Ti alloy sheets were cut to 25 × 25 mm size. Before anodization, the substrates were cleaned ultrasonically in acetone and ethanol for 10 min to remove contamination. The electrochemical cell consists of a stainless steel (316 grade) counter electrode of comparable size as a Ti alloy sheet, a Ti alloy sheet was used as a working electrode, and a 0.11 M KOH/0.02 M K3PO4 aqueous solution as electrolyte. The counter and working electrodes were placed 10 mm away from each other. Anodization was carried out at an applied potential of 30 V for 30 min. Note that when using larger samples, the cell should be kept in a big reservoir of water at room temperature. As-anodized samples were then removed from the electrolyte, rinsed with DI water, and dried under a stream of N2.
Aluminum etching/anodization processes
Aluminum sheets were cut into 20 × 20 × 1 mm samples and used as substrates. The substrates were first ground with SiC grinding paper up to 1200 grit. The substrates were then ultrasonically degreased in acetone and ethanol for 10 min each and dried under a stream of N2. The ground Al samples were pretreated in an aqueous solution of 1 M NaOH for 1 min, followed by a desmutting treatment in an aqueous solution of 1 M HNO3 for 1 min at room temperature under stirring conditions60, then rinsed with DI water and dried under a stream of N2. These Al samples were etched in an aqueous solution of 3 M hydrochloric acid, first at 40 °C for 2 min, followed by a second etching step at 80 °C for 1 min under stirring conditions, rinsed with DI water, and then dried under a stream of N2. The etched Al samples were then electrochemically anodized in an aqueous solution of 0.3 M oxalic acid maintained at 1 °C for 1 min under an applied voltage of 60 V to form a nano-rough Al oxide layer. A two-electrode cell was used with Pt foil as the counter electrode. The distance between the counter electrode and the working electrode was kept at about 10 mm. After anodization, the substrates were rinsed with DI water and then dried under a stream of N2.
Low-surface-energy coating
The surfactant, either phosphate ester with mixed length of fluorinated alkyl chains (FS-100, γ = 15.31 ± 0.33 mN m−1) or Laureth-4 phosphate (Silaphos MDE 12, γ = 23.03 ± 0.08 mN m−1) (10 g) was dissolved in 1 L of 95:5 vol.% ethanol: H2O by ultrasonication and then kept in a closed container under ambient conditions. As-anodized samples were immersed in the appropriate surface modifier solution. A plastic cover to prevent ethanol evaporation was used to seal the surfactant container. A container with the high surface roughness samples was placed in a preheated to +60 °C muffle furnace for 30 min. The low surface-energy metallic substrates were then removed from the surface modifier solution, rinsed with ethanol, and dried under a stream of N2. To obtain the most stable CA, the bare samples were ground with SiC grinding paper (up to 1200 grit), and then polished with up to 1 µm diamond suspension. After polishing, the samples were cleaned in an ultrasonic bath with acetone and ethanol. The polished Ti samples were anodized for 5 s at an applied potential of 15 V in NaOH/H2O2 electrolyte to form a thin dense TiO2 layer followed by the standard FS-modification procedure. The surface tension of either FS-100 or Silaphos MDA 12 was measured by the pendant drop method using a KRÜSS DSA25 contact angle goniometer (KRÜSS, Germany).
Characterization techniques
Wetting characterization
Water contact angle (WCA). The apparent water contact angle measurements, when possible, for SHS were carried out using an Attension Theta contact angle goniometer (Biolin Scientific, Finland). A small drop was deposited on the surface, and its volume was increased to ~10 μL, and the water contact angle was measured. The WCA was calculated using Laplace–Young’s method of sessile drop. An error of ±5° was added to the obtained standard deviation values to include the measurement inaccuracies based on a model, where the droplet baseline is deviated by ±1 pixel level24. For roll-off measurements, the drop volume was 10 μL. The tilting speed was 10° per min, and the image recording was performed at 2.3 fps. All values specified in the text were averaged from at least three independent measurements. Most stable contact angle (MSCA). The most stable WCA measurements were performed using polished (mirror-like) metallic surfaces coated by the FS-modification. Since there is no common methodology to determine the most stable CA, advancing and receding CAs were measured, which are the maximum and minimum apparent CA values, respectively. An apparent CA could then be any value between these two limiting values5. The advancing and receding WCAs were measured using the DSA100 contact angle goniometer (KRÜSS, Germany) as follows: the drop of 40 μL volume was infused on the FS-coated polished samples at a rate of 0.05 μL s−1, the drop of 40 μL was withdrawn on the FS-coated polished samples at a rate of 0.05 μL s−1, and the image recording was performed. The shape of a sessile drop was calculated using the Ellipse method (Tangent-1) by KRÜSS Drop Shape Analysis software. All values specified in the text were averaged from at least three independent measurements. The adhesiveness of water drops to SHS. The adhesiveness of water drops on the developed SHS were measured using the DSA25 contact angle goniometer (KRÜSS, Germany) as follows: the drop of 20 μL volume was infused and withdrawn at a rate of 0.05 μL s−1, and the image recording was performed. The shape of a sessile drop was calculated using the Ellipse method (Tangent-1) by KRÜSS Drop Shape Analysis software. All values specified in the text were averaged from at least three independent measurements.
Long-term immersion of Ti-SHS underwater
Ti-SHS samples were immersed in a polystyrene Petri dish filled with DI water to a depth of 1 cm. The dish was then covered with a non-hermetic polystyrene lid. To visualize the Cassie-to-Wenzel transition, a 1 mL air bubble was injected using a fine pipette. A digital still camera was used to capture images of these bubbles approximately every two months. The Petri dish was kept at ambient conditions in a non-air-conditioned laboratory throughout all four seasons, with the water level monitored and replenished as needed. The temperature in the laboratory was altered from ~+10 °C during the winter period to > +30 °C during the summer period. Note that the stability of gas layers underwater is related to the saturation of dissolved gases in water, which is a function of temperature61. This, in turn, affects the solubility of air in the water that can be translated into immersion depth as follows: ΔP = Air solubility change · Patm/(dwater · g). For instance, the dissolved air saturation in water at 20 °C is ~ 4% greater than at 22 °C, which is equivalent to ~0.40 m. Considering the reduction in temperature from +20 °C to +10 °C, this leads to an equivalent difference of ~3.40 m.
Morphology and physicochemical characterization
For morphological characterization, a field-emission scanning electron microscope (Hitachi FE-SEM S4800) equipped with energy-dispersive X-ray spectroscopy (EDAX Genesis) was used.
Surface roughness measurements
A Park NX20 atomic force microscope (AFM, Park Systems Suwon) was used to calculate the roughness parameter of the samples. Measurements were performed in contact mode using CONTSCR contact cantilevers with low resonant frequency (25 kHz) and low spring constant (0.2 N m−1). All images were acquired at a resolution of 1024 × 1024 pixels, a scan rate of 0.10 Hz, and a scan range of 50 µm2. The AFM images were analyzed using Gwyddion 2.61 software and the dimensionless roughness parameters were calculated from the height values using the triangulation method provided by the software. Statistical analysis of the roughness parameter of SHS was determined from at least three spots.
Solid–liquid area fraction measurements
A polystyrene Petri dish was filled with DI water to a height of ~1 cm. The SHS samples were then immersed underwater forcing them to sink to the bottom. The solid–liquid area fraction was obtained using a Nikon Eclipse LV 150 with the E Plan 5×/0.1 objective (WD 20) microscope equipped with a Nikon DS-Fi1 camera in bright-field reflectance mode.
Long-term corrosion tests
Long-term corrosion resistance measurements were carried out by immersing the bare and Al-SHS substrates in an artificial seawater medium, in a Petri dish within an ambient atmosphere. Supplementary Table S4 provides the composition of artificial seawater. Digital images, from both top view and grazing angles, were taken weekly during the immersion process.
Barnacle re-attachment and adhesion
The Ti-SHS1-FS, Ti-SHS2-FS, Ti-SHS1-Sil, and polyurethane (PU, NDSU prepared polyurethane standard) were used to assess re-attachment and adhesion of barnacles. Five adult barnacles (Amphibalanus amphitrite) of testable size (>5 mm basal diameter) were dislodged from the glass panels coated with Silastic T2 and placed on coated 10 × 20 cm Ti-SHS, and polyurethane (PU) control plates. Immobilization templates were then applied to each panel to anchor barnacles to the coated surfaces and then transferred to an artificial saltwater aquarium tank system. The re-attached barnacles were fed daily with freshly hatched brine shrimp nauplii (Artemia sp.). After 14 days of re-attachment in the aquarium system, the samples were removed, and the re-attached barnacles were removed in shear mounted to a semi-automated push-off device to measure the peak force at release. The area of barnacle base plates was measured using a SigmaScan Pro software package (SigmaScan Pro 5.0, Systat Software, Inc., Richmond, CA). The adhesion strength was calculated by normalizing detachment shear force to basal area. Barnacle adhesion for each coating was reported as the mean value of the total number of barnacles that had a measurable detachment force. Barnacles that had no measurable force for detachment were counted as “not attached” and not included in adhesion calculations.
Marine mussel attachment and adhesion
Freshly collected adults of the ribbed mussel Geukensia demissa (3–5 cm in size) were obtained from Duke University Marine Laboratory in Beaufort, North Carolina, USA, and housed in an ASW aquarium tank system with continuous monitoring and maintenance at pH (8.0–8.2) and salinity (35 ppt). Prior to attachment studies, a 4 cm section of acetal plastic rod (product# 98873A105, McMaster-Carr) was adhered to the shell of each mussel, perpendicular to the ventral edge, using a 3 M acrylic adhesive (product# 7467A135, McMaster-Carr). Custom-designed templates fabricated from PVC sheets were then used to immobilize six mussels onto each coated 10 × 20 cm Ti-SHS and PU control plates, using setscrews to firmly secure the adhered, plastic rods. The samples were placed in the ASW aquarium system, and the mussels were fed daily with live marine phytoplankton (DTs Premium Reef Blend Phytoplankton). After three days of immersion, the mussels were removed from the ASW aquarium tank system, and the total number of mussels exhibiting attachment of byssus threads was recorded for each surface. The rod of each attached mussel was then secured to an individual 5 N load cell of a custom-built, tensile force gauge outfitted with six loads of cells to enable simultaneous measurements of all attached mussels. The total force required to detach the byssus threads for each mussel was recorded (1 mm s−1 pull rate), and the average pull-off force value (in Newtons) for all attached mussels was calculated for each coating surface.
Data availability
All data are available in the main text or Supplementary Information. All relevant data are available from the corresponding authors upon reasonable request.
References
Deng, X., Mammen, L., Butt, H.-J. & Vollmer, D. Candle soot as a template for a transparent robust superamphiphobic coating. Science 335, 67–70 (2012).
Barthlott, W. & Neinhuis, C. Purity of the sacred lotus, or escape from contamination in biological surfaces. Planta 202, 1–8 (1997).
Barthlott, W., Mail, M. & Neinhuis, C. Superhydrophobic hierarchically structured surfaces in biology: evolution, structural principles and biomimetic applications. Philos. Trans. R. Soc. Lond., A 374, 20160191 (2016).
Liu, M., Wang, S. & Jiang, L. Nature-inspired superwettability systems. Nat. Rev. Mater. 2, 17036 (2017).
Chen, F. et al. Robust and durable liquid-repellent surfaces. Chem. Soc. Rev. 51, 8476–8583 (2022).
Dhyani, A. et al. Design and applications of surfaces that control the accretion of matter. Science 373, eaba5010 (2021).
McHale, G., Newton, M. I. & Shirtcliffe, N. J. Immersed superhydrophobic surfaces: gas exchange, slip and drag reduction properties. Soft Matter 6, 714–719 (2010).
Si, Y., Dong, Z. & Jiang, L. Bioinspired designs of superhydrophobic and superhydrophilic materials. ACS Cent. Sci. 4, 1102–1112 (2018).
Li, L. et al. Challenges and strategies for commercialization and widespread practical applications of superhydrophobic surfaces. Sci. Adv. 9, eadj1554 (2023).
Tian, X., Verho, T. & Ras, R. H. A. Moving superhydrophobic surfaces toward real-world applications. Science 352, 142–143 (2016).
Wang, D. et al. Design of robust superhydrophobic surfaces. Nature 582, 55–59 (2020).
Lu, Y. et al. Robust self-cleaning surfaces that function when exposed to either air or oil. Science 347, 1132–1135 (2015).
Peng, C., Chen, Z. & Tiwari, M. K. All-organic superhydrophobic coatings with mechanochemical robustness and liquid impalement resistance. Nat. Mater. 17, 355–360 (2018).
Tesler, A. B. et al. Extremely durable biofouling-resistant metallic surfaces based on electrodeposited nanoporous tungstite films on steel. Nat. Commun. 6, 8649 (2015).
Crisp, D. J. & Thorpe, W. H. The water-protecting properties of insect hairs. Discuss. Faraday Soc. 3, 210–220 (1948).
Thorpe, W. H. & Crisp, D. J. Studies on plastron respiration: I. The biology of aphelocheirus [Hemiptera, Aphelocheiridae (Naucoridae)] and the mechanism of plastron retention. J. Exp. Biol. 24, 227–269 (1947).
Thorpe, W. H. Plastron respiration in aquatic insects. Biol. Rev. 25, 344–390 (1950).
Cassie, A. B. D. & Baxter, S. Wettability of porous surfaces. Trans. Faraday Soc. 40, 546–551 (1944).
Wong, W. S. Y. & Vollmer, D. Effervescence-inspired self-healing plastrons for long-term immersion stability. Adv. Funct. Mater. 32, 2107831 (2022).
Poetes, R., Holtzmann, K., Franze, K. & Steiner, U. Metastable underwater superhydrophobicity. Phys. Rev. Lett. 105, 166104 (2010).
Zhao, Y. et al. Recoverable underwater superhydrophobicity from a fully wetted state via dynamic air spreading. iScience 24, 103427 (2021).
Sigmund, W. M. & Hsu, S.-H. In Encyclopedia of Membranes (eds Enrico, D. & Lidietta, G.) 1–2 (Springer Berlin Heidelberg, 2015).
Balmert, A., Bohn, H. F., Ditsche-Kuru, P. & Barthlott, W. Dry under water: comparative morphology and functional aspects of air-retaining insect surfaces. J. Morphol. 272, 442–451 (2011).
Eral, H., B.,’t Mannetje, D. J. C. M. & Oh, J. M. Contact angle hysteresis: a review of fundamentals and applications. Colloid Polym. Sci. 291, 247–260 (2013).
Marmur, A., Della Volpe, C., Siboni, S., Amirfazli, A. & Drelich, J. W. Contact angles and wettability: towards common and accurate terminology. Surf. Innov. 5, 3–8 (2017).
Zaman Khan, M. et al. Recent advances in superhydrophobic surfaces for practical applications: a review. Eur. Polym. J. 178, 111481 (2022).
Huhtamäki, T., Tian, X., Korhonen, J. T. & Ras, R. H. A. Surface-wetting characterization using contact-angle measurements. Nat. Protoc. 13, 1521–1538 (2018).
Ruiz-Cabello, F. J. M., Rodríguez-Valverde, M. A. & Cabrerizo-Vílchez, M. A. Equilibrium contact angle or the most-stable contact angle? Adv. Colloid Interface Sci. 206, 320–327 (2014).
Liu, K., Vuckovac, M., Latikka, M., Huhtamäki, T. & Ras, R. H. A. Improving surface-wetting characterization. Science 363, 1147–1148 (2019).
Backholm, M. et al. Water droplet friction and rolling dynamics on superhydrophobic surfaces. Commun. Mater. 1, 64 (2020).
Timonen, J. V. I., Latikka, M., Ikkala, O. & Ras, R. H. A. Free-decay and resonant methods for investigating the fundamental limit of superhydrophobicity. Nat. Commun. 4, 2398 (2013).
Marmur, A. Underwater superhydrophobicity: theoretical feasibility. Langmuir 22, 1400–1402 (2006).
Tesler, A. B. et al. Long-lasting aerophilic metallic surfaces underwater. Nat. Mater. 22, 1548–1555 (2023).
Martínez-Gómez, A. et al. Long-term underwater hydrophobicity: exploring topographic and chemical requirements. ACS Omega 2, 8928–8939 (2017).
Ditsche-Kuru, P. et al. Superhydrophobic surfaces of the water bug Notonecta glauca: a model for friction reduction and air retention. Beilstein J. Nanotechnol. 2, 137–144 (2011).
Mehanna, Y. A. et al. The challenges, achievements and applications of submersible superhydrophobic materials. Chem. Soc. Rev. 50, 6569–6612 (2021).
Hwang, G. B. et al. The anti-biofouling properties of superhydrophobic surfaces are short-lived. ACS Nano 12, 6050–6058 (2018).
Lafuma, A. & Quéré, D. Superhydrophobic states. Nat. Mater. 2, 457–460 (2003).
Xu, M., Sun, G. & Kim, C.-J. Infinite lifetime of underwater superhydrophobic states. Phys. Rev. Lett. 113, 136103 (2014).
Drelich, J. & Marmur, A. Physics and applications of superhydrophobic and superhydrophilic surfaces and coatings. Surf. Innov. 2, 211–227 (2014).
Nosonovsky, M. & Bhushan, B. Stochastic model for metastable wetting of roughness-induced superhydrophobic surfaces. Microsyst. Technol. 12, 231–237 (2006).
Hokmabad, B. V. & Ghaemi, S. Effect of flow and particle-plastron collision on the longevity of superhydrophobicity. Sci. Rep. 7, 41448 (2017).
Daniel, D. et al. Origins of extreme liquid repellency on structured, flat, and lubricated hydrophobic surfaces. Phys. Rev. Lett. 120, 244503 (2018).
Hokkanen, M. J., Backholm, M., Vuckovac, M., Zhou, Q. & Ras, R. H. A. Force-based wetting characterization of stochastic superhydrophobic coatings at nanonewton sensitivity. Adv. Mater. 33, 2105130 (2021).
Gao, N. et al. How drops start sliding over solid surfaces. Nat. Phys. 14, 191–196 (2018).
Adarraga, O., Agustín-Sáenz, C., Bustero, I. & Brusciotti, F. Superhydrophobic and oleophobic microtextured aluminum surface with long durability under corrosive environment. Sci. Rep. 13, 1737 (2023).
Wu, X. et al. An underwater stable superhydrophobic surface for robust ultra-long-lasting biofouling resistance. Chem. Eng. J. 462, 142091 (2023).
Xiang, Y. et al. Ultimate stable underwater superhydrophobic state. Phys. Rev. Lett. 119, 134501 (2017).
Marmur, A. Soft contact: measurement and interpretation of contact angles. Soft Matter 2, 12–17 (2006).
McHale, G. Cassie and Wenzel: were they really so wrong? Langmuir 23, 8200–8205 (2007).
Marmur, A. & Kojevnikova, S. Super-hydrophobic surfaces: methodological considerations for physical design. J. Colloid Interface Sci. 568, 148–154 (2020).
Lejars, M., Margaillan, A. & Bressy, C. Fouling release coatings: a nontoxic alternative to biocidal antifouling coatings. Chem. Rev. 112, 4347–4390 (2012).
Lee, H., Scherer, N. F. & Messersmith, P. B. Single-molecule mechanics of mussel adhesion. Proc. Natl. Acad. Sci. USA 103, 12999–13003 (2006).
Kamino, K. Mini-review: barnacle adhesives and adhesion. Biofouling 29, 735–749 (2013).
Amini, S. et al. Preventing mussel adhesion using lubricant-infused materials. Science 357, 668–673 (2017).
Petrone, L. et al. Mussel adhesion is dictated by time-regulated secretion and molecular conformation of mussel adhesive proteins. Nat. Commun. 6, 8737 (2015).
Stafslien, S. J. et al. Comparison of laboratory and field testing performance evaluations of siloxane-polyurethane fouling-release marine coatings. Biofouling 32, 949–968 (2016).
Butt, H.-J. et al. Contact angle hysteresis. Curr. Opin. Colloid Interface Sci. 59, 101574 (2022).
Tesler, A. B., Sannomiya, T., Vaskevich, A., Sabatani, E. & Rubinstein, I. Highly sensitive colorimetric detection of early stage aluminum corrosion in water using plasmonic gold nanoparticle films. Adv. Opt. Mater. 6, 1800599 (2018).
Inoue, T. et al. Fluorine-free slippery liquid-infused porous surfaces prepared using hierarchically porous aluminum. Phys. Status Solidi A 217, 1900836 (2020).
Zhang, Q. et al. Bubble nucleation and growth on microstructured surfaces under microgravity. NPJ Microgravity 10, 13 (2024).
Acknowledgements
A.B.T. thanks the Deutsche Forschungsgemeinschaft (DFG) (award number 540989797) for financial support. A.B.T., W.H.G., and B.F. thank the Deutsche Forschungsgemeinschaft (DFG) (award number 442826449) for financial support. H.A.N., B.K., and R.H.A.R. acknowledge funding from the Academy of Finland Center of Excellence Program (2022 − 2029) in Life-Inspired Hybrid Materials (LIBER, project number 346109). S.S. acknowledges funding from the Office of Naval Research, U.S. Department of Defense Grant N00014-17-1-2153. S.K. and J.A. acknowledge funding from the Office of Naval Research, U.S. Department of Defense grants: N00014-15-1-2323, N00014-17-1-2913, and the Department of Energy (Award DE-SC0005247). I.d.B.S. and S.C. were supported by the European Union’s H2020 research and innovation program under the Marie Sklodowska-Curie grant agreement AIMed ID: 861138. G.S., I.E., and S.C. acknowledge the financial support from the European Union within the research projects 4D + nanoSCOPE ID: 810316, LRI ID: C10, STOP ID: 101057961, from the German Research Foundation (DFG) within the research project UNPLOK ID: 523847126, and from the “Freistaat Bayern” and European Union within the project Analytiktechnikum für Gesundheits- und Umweltforschung AGEUM, StMWi-43-6623-22/1/3. The authors thank Prof. S. Virtanen and Prof. P. Schmuki for providing laboratory space for measurements. W.H.G. and A.B.T. are indebted to Liz Nicholson (MA) for proofreading the manuscript.
Funding
Open Access funding enabled and organized by Projekt DEAL.
Author information
Authors and Affiliations
Contributions
A.B.T. conceived the original idea for the project, developed the etching and anodization method to form highly rough aerophilic Ti and Al substrates with hierarchical structures, and analyzed the formation mechanisms. A.B.T and H.A.N. discussed the theoretical modeling and characterization methodology. A.B.T., L.H.P., and S.K. screened and down-selected different coating compositions and fabrication methods, discovering the most promising designs for further study. A.B.T. performed the plastron and plastron longevity characterizations. A.M. performed XPS characterizations. A.B.T., I.E., I.d.B.S., G.S., and S.C. performed roughness measurements. A.B.T., L.H.P., B.K., H.A.N., and R.H.A.R. performed the wetting characterization and analyzed the experimental data. A.B.T., B.F., and W.H.G. performed the SEM, EDX, and optical microscopy characterizations. S.K., Ja.A., S.S., and Jo.A. developed the Ti-SHS2 anodized process and performed the marine anti-biofouling characterization. A.B.T., H.A.N., S.K., R.H.A.R., and W.H.G. wrote the manuscript. A.B.T., H.A.N., S.K., L.H.P, B.K., A.M., I.E., I.d.B.S., G.S., S.C., S.S., Ja.A., Jo.A., B.F., R.H.A.R., and W.H.G. discussed the results. All authors contributed to the manuscript.
Corresponding authors
Ethics declarations
Competing interests
The authors declare no competing interests.
Peer review
Peer review information
Communications Materials thanks the anonymous reviewers for their contribution to the peer review of this work. Primary Handling Editor: John Plummer.
Additional information
Publisher’s note Springer Nature remains neutral with regard to jurisdictional claims in published maps and institutional affiliations.
Rights and permissions
Open Access This article is licensed under a Creative Commons Attribution 4.0 International License, which permits use, sharing, adaptation, distribution and reproduction in any medium or format, as long as you give appropriate credit to the original author(s) and the source, provide a link to the Creative Commons licence, and indicate if changes were made. The images or other third party material in this article are included in the article’s Creative Commons licence, unless indicated otherwise in a credit line to the material. If material is not included in the article’s Creative Commons licence and your intended use is not permitted by statutory regulation or exceeds the permitted use, you will need to obtain permission directly from the copyright holder. To view a copy of this licence, visit http://creativecommons.org/licenses/by/4.0/.
About this article

Cite this article
Tesler, A.B., Nurmi, H.A., Kolle, S. et al. Predicting plastron thermodynamic stability for underwater superhydrophobicity. Commun Mater 5, 112 (2024). https://doi.org/10.1038/s43246-024-00555-8
Received:
Accepted:
Published:
Version of record:
DOI: https://doi.org/10.1038/s43246-024-00555-8
This article is cited by
-
Saturation and texture geometry effects on plastron longevity on superhydrophobic surfaces
Scientific Reports (2025)
