
Abstract
Aerosols from South Asia directly enhance glacier melt over the Tibetan Plateau. While the transboundary transport of aerosols from South Asia towards the Tibetan Plateau has been extensively investigated from a tropospheric perspective, less focus has been given to the stratospheric dimension. Here we examined the impact of the sudden stratospheric warming in January 2021 on aerosol transport from South Asia towards the Tibetan Plateau via numerical simulation. The results revealed that the aerosol transport from South Asia to the Tibetan Plateau reduced by 30%–40% following the January 2021 sudden stratospheric warming event. The eastward-propagating wave train stimulated by the stratospheric sudden warming induced an anticyclonic anomaly from the Persian Gulf to northern China, south of which easterly anomalies hindered the aerosol transport from South Asia to the Plateau. This study provides valuable insights for predicting air quality over the Tibetan Plateau.
Introduction
The Tibetan Plateau (TP), also known as the “Asian Water Tower”, boasts the most concentrated glacier and snow cover outside of the polar regions, supplying a substantial portion of the water demand for nearly 2 billion people1. However, the TP has experienced significant and rapid climate warming in recent decades2,3,4. As a result of this climate warming, glaciers over the TP have experienced widespread losses and accelerated retreats2,5. In addition to greenhouse gases, absorbing aerosols, such as black carbon (BC), brown carbon, and dust, also play a substantial role6,7,8. As one of the most pristine regions on the earth, carbonaceous aerosols over the TP primarily originate from adjacent regions, such as South Asia and East Asia8,9,10.
In recent years, the cross-border transport of aerosols over the TP has attracted widespread attention from the scientific community8,9,11,12,13,14. However, these studies mainly investigated the cross-border transport of aerosols over the TP from a tropospheric perspective9,10,11,12,13, with little attention paid to the stratospheric dimension. The Arctic has warmed nearly four times faster than the globe since 197915. The strength of the Arctic stratospheric polar vortex tends to be weaker and its position has persistently shifted towards the Eurasian continent in recent decades16,17,18. Numerous studies have noticed that the downward propagation of abnormal signal pulses of the Arctic stratospheric polar vortex has substantial impact on weather, climate, and atmospheric environment in the troposphere19,20,21,22,23,24. Currently, there is still a lack of systematic and comprehensive understanding of the impact of the Arctic stratospheric polar vortex anomaly on the cross-border transport of aerosols over the TP, which deserves urgent investigation.
Major sudden stratospheric warmings (SSWs), defined as substantial disruptions to the polar vortex in the stratosphere, take place on average six times per decade25. A major SSW event occurred in the Arctic stratosphere on 5 January 202126,27,28. This was the first major SSW since 2 January 2019 and the third in the past six winters28,29. The daily-mean zonal mean easterly winds associated with this SSW were not consecutive but occurred in three separate periods28. Even though there are separate reversals of the zonal winds, they are regarded as a single major SSW event, since the vortex requires at least 20 consecutive days of westerly winds following a SSW to recover from the initial disruption30. As the most recent and long-duration SSW event, this study aims to investigate the impact of this SSW on the cross-border transport of aerosols from South Asia towards the TP.
However, observed aerosol data in the TP are inadequate to support comprehensive and quantitative studies on the cross-border transport of aerosols from South Asia towards the TP owing to its high elevation and scarcity of permanent instrumental stations there. Numerical simulation then is the most effective way to explore the impact of the SSW event on the cross-border transport of aerosols from South Asia towards the TP. The Weather Research and Forecasting model coupled with chemistry (WRF-Chem) model was used in this study, since it has been widely utilized to simulate the cross-border transport of aerosols over the TP9,10,12,13.
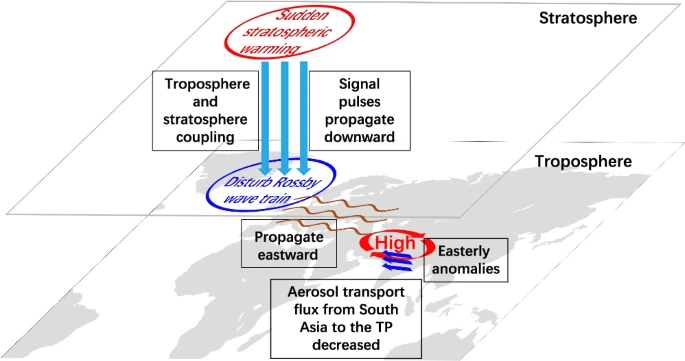
The results showed that the SSW event in January 2021 contributed 30–40% to the reduction in the transport of aerosols from South Asia towards the TP. This was because the Rossby wave train, disturbed by the downward propagation of abnormal signal pulses of the SSW, propagated eastward and formed an anticyclone from the Persian Gulf to northern China. Located to the south of this anomalous anticyclone, easterly anomalies dominated over northwest South Asia and the southern TP, hindering the transport of aerosols from South Asia to the TP.
Results
The SSW event in January 2021
A SSW event occurs when the zonal-mean westerlies at 60° N/10 hPa reverse to easterlies30,31. As shown in Fig. 1a, the easterly anomalies at 10 hPa emerged on 25 December 2020, which persisted for an extended period of 54 days, culminating on 16 February 2021. These easterly anomalies intensified notably from 1 January 2021, achieving their first peak of −40 m/s on 5 January and a subsequent peak of −43 m/s on 15 January 2021. The easterly anomalies propagated downward from 10 hPa to 500 hPa in early to mid-January, further extending to the lower troposphere by late January and early February. Commencing on 1 January 2021, the stratospheric polar cap experienced a sudden warming, with temperature anomalies at 10 hPa initially reaching 10 K and peaking at a remarkable 29 K on 5 January 2021 (Fig. 1a), suggesting that the Arctic stratospheric temperature increased by 29 K within five days. The polar cap warm anomalies persisted for 41 days from 26 December 2020 to 4 February 2021. In contrast to the extensive vertical propagation of circulation anomalies, the warm anomalies only descended to the 200 hPa level by mid-January. The positive geopotential height anomalies within the Arctic stratosphere began on 26 December (Fig. 1b), and the polar cap height attained its first peak on 5 January, with geopotential height anomalies at 10 hPa reaching up to 1132 gpm, followed by a second maximum of 1205 gpm on 15 January. The positive anomalies of geopotential height persisted until 14 February and propagated downward to the surface twice. The synchronized manifestation of both easterly anomalies and positive height anomalies near the surface highlights the evolution and downward propagation of negative Northern Annular Mode pulses during the SSW event. According to the downward propagation characteristics of the stratospheric polar vortex anomaly signals, the SSW event was divided into five stages, the first stage lasting from 29 December 2020 to 19 January 2021; the second stage, from 20 to 30 January 2021; the third stage, from 31 January to 4 February 2021; the fourth stage, from 5 to 15 February 2021; and the fifth stage, from 16 to 25 February 2021 (Fig. 1a, b).

Pressure–temporal evolution of (a) the zonal-mean zonal wind anomalies at 60° N (contour; unit: m/s) and temperature anomalies in the polar cap (area averaged over 60°–90° N) (shading; unit: °C), and (b) geopotential height anomalies in the polar cap (shading and contour; unit: gpm) during the period from 1 December 2020 to 28 February 2021. The gray solid line in a and b represents the division of the different stages of the SSW event. c WRF-Chem model domain, orography (shading; unit: m). Black solid dots are stations used to validate the model performance on meteorology and chemistry. The red solid line represents the cross-border line for analysis in the following. d The thickness of each vertical layer in the simulations (54 layers in total).
Supplementary Fig. 1 presents the distribution of the mean geopotential height at 10 hPa and 500 hPa during the different stages of the SSW event. In the first stage, the center of the stratospheric polar vortex was located in the North Atlantic, with a center height of less than 28, 500 m (Supplementary Fig. 1a). The 500 hPa geopotential height exhibited three climatological troughs and three climatological ridges (Supplementary Fig. 1f). The three troughs were located over the coast of East Asia, eastern North America, and western Europe, respectively. The tropospheric planetary wave activities can propagate upward and affect the stratosphere23,32. During the second stage, as the first stratospheric signal pulse propagated downward to the near surface, the center of the stratospheric polar vortex shifted eastward, accompanied by an increase in its altitude, with a center height of less than 28,760 m, extending its coverage to include the north Eurasian region (Supplementary Fig. 1b). The 500 hPa geopotential height displayed an elongated vortex, with its center over Siberia (Supplementary Fig. 1g). During the third period, when the stratospheric influence waned, the stratospheric polar vortex relocated to the North Atlantic and commenced its recovery, with the center height dipping to about 28,700 m (Supplementary Fig. 1c). Compared to the first stage, the 500 hPa trough over the coast of East Asia during the third stage deepened again (Supplementary Fig. 1h). In the fourth stage, as the second stratospheric signal pulse propagated downward to the near surface, the stratospheric polar vortex regained a robust state, with its center height less than 28,440 m (Supplementary Fig. 1d). The 500 hPa geopotential height reverted to a more zonally symmetric pattern (Supplementary Fig. 1i). During the fifth stage, the stratospheric polar vortex encompassed the Arctic region once again (Supplementary Fig. 1e). At 500 hPa, the westerly winds turned into a more meridional circulation pattern (Supplementary Fig. 1j). Therefore, the January 2021 SSW is a displacement type SSW event, with the stratospheric polar vortex mainly over the North Atlantic (Supplementary Fig. 1).
Impact of the SSW event on aerosol transport from South Asia towards the TP
To accurately evaluate the impact of the SSW event in January 2021 on the aerosol transport from South Asia to the TP, we have thoroughly validated the model’s performance on both meteorology and chemistry over the study area (Supplementary Figs. 2–7) in the Supplementary Note 1. The specific statistics between the observed and simulated 2-m temperature, 2-m relative humidity, 10-m wind speed, aerosol optical depth (AOD), and BC concentrations are shown in Supplementary Table 1 and Supplementary Table 2. Here, BC was used as a proxy to clarify the impact of the SSW event on the cross-border transport flux of aerosols from South Asia towards the TP. The red solid line in Fig. 1c was defined as a cross-border line to quantitatively calculate the cross-border transport flux of aerosols. Fig. 2 displays the longitude-height cross section of BC transport flux along the cross line, averaged during the different stages of the SSW, which was based on the free run without any nudging technique (termed as CONT). Positive values denote the transport directed towards the TP, whereas negative values denote the transport directed away from the TP. It was obvious that, during each stage, the BC transport flux along the cross line was positive (Fig. 2), implying that the BC was predominantly transported towards the TP from South Asia. Moreover, during each stage, the BC transport flux decreased from west to east and larger BC transport flux occurred at deeper mountain valleys (Fig. 2), which was consistent with the results obtained from the previous study13. Additionally, compared to the first three stages, the BC transport flux decreased obviously during the fourth and fifth stages (Fig. 2).

The longitude-height cross section of BC transport flux (shading; unit: µg m−2 s−1) along the cross line (the red solid line in Fig. 1c) averaged during (a) the first, (b) the second, (c) the third, (d) the fourth, and (e) the fifth stages of the SSW event in the CONT experiment.
To elucidate the variation in the overall inflow flux of BC along the cross line (depicted as the red solid line in Fig. 1c) during the different stages of the SSW event, it was necessary to calculate the vertically integrated BC transport flux along the longitudinal cross section. As shown in Fig. 3, the vertically integrated BC transport flux, averaged during each stage, was positive at each grid point along the cross line, suggesting that the BC was overall transported towards the TP from South Asia. The longitudinal distribution of the vertically integrated BC transport flux along the cross line during each stage, demonstrated a clear decrease from west to east, indicating that large-scale westerly flow played a dominant role in the cross-border transport of aerosols from South Asia towards the TP.

The vertically integrated BC transport flux along the cross line (the red solid line in Fig. 1c) averaged during (a) the first, (b) the second, (c) the third, (d) the fourth, and (e) the fifth stages of the SSW event in the CONT experiment. The blue dotted line denotes the integrated BC transport flux along the cross line. The gray dotted line represents the terrain height along the cross line.
Figure 4 illustrates the time series of the daily mean of the total BC transport flux for all grid points along the cross line during the period from 1 December 2020 to 28 February 2021. It was found that the daily mean of the total BC transport flux for all grid points along the cross line from both the CONT simulation and the second Modern-Era Retrospective analysis for Research and Applications (MERRA-2) reanalysis dataset displayed a significant decreasing trend during the study period, with the p-value less than 0.01 (Fig. 4a, b). The correlation coefficient between the simulated and reanalyzed daily mean of the total BC transport flux was 0.89, surpassing the 99% confidence level. Therefore, a significant decrease in BC transport flux from South Asia to the TP was detected during the period from 1 December 2020 to 28 February 2021. Changes in BC transport flux are not only closely linked to BC mass concentrations but also to meteorological conditions33,34,35. In contrast to the obvious decrease in BC transport flux from South Asia to the TP during the fifth stage of the SSW (Figs. 2e and 3e), the vertically integrated BC concentrations over South Asia increased notably during this period, particularly evident in northwest South Asia (Fig. 5e), highlighting the pivotal role that meteorological conditions played in the reduction of BC transport flux from South Asia to the TP. Fig. 5f illustrates the time series of the daily mean zonal and meridional wind components, averaged across all grid points along the cross line, at both 500 hPa and 700 hPa, during the period from 1 December 2020 to 28 February 2021. The daily mean zonal wind at both 500 hPa and 700 hPa over the cross line was consistently westerly from 1 December 2020 to 28 February 2021, displaying a notable decrease in its strength, from 63.2 m/s on 23 January to 2.1 m/s on 19 February 2021. Similarly, the daily mean meridional wind was predominantly negative at these two levels during the period from 11 January to 28 February 2021, signifying the prevalence of a northerly flow. Consequently, the combination of weakened westerlies and prevalent northerlies contributed to the reduction in BC transport from South Asia to the TP. The daily mean zonal and meridional wind components at 500 hPa from the European Centre for Medium Range Weather Forecasts’ fifth generation reanalysis (ERA5) dataset, averaged across all grid points along the cross line, were utilized to assess the model’s performance on simulating wind components at that specific altitude over the cross line. The results showed that the correlation coefficient between the observed and simulated daily mean zonal wind component from 1 December 2020 to 28 February 2021 stood at 0.84, surpassing the 99% confidence level. Similarly, for the same period and at 500 hPa, the correlation coefficient between the observed and simulated daily mean meridional wind component was 0.85, also exceeding the 99% confidence level. Therefore, changes in meteorological conditions were the dominant factor influencing the cross-border transport of BC from South Asia to the TP.

(a) WRF-Chem CONT simulation, (b) MERRA-2 reanalysis, (c) WRF-Chem NSSW simulation, (d) Climatological state analysis excluded SSWs based on MERRA-2 reanalysis, (e) WRF-Chem NCLM simulation, (f) Climatological state analysis included SSWs based on MERRA-2 reanalysis. The black dotted line denotes the time series of the daily mean of the total BC transport flux for all grid points along the cross line. The black dashed line represents the average value and the solid black line denotes the linear trend. Trends are statistically significant (p-value < 0.01) unless otherwise stated.

Spatial distribution of vertically integrated BC mass concentrations (shading; unit: mg m−2) averaged during (a) the first, (b) the second, (c) the third, (d) the fourth, and (e) the fifth stages of the SSW event. (f) The time series of the daily mean zonal (u; unit: m/s) and meridional (v; unit: m/s) wind components, averaged across all grid points along the cross line, at both 500 hPa and 700 hPa, for the period from 1 December 2020 to 28 February 2021.
To ascertain whether the changes in meteorological conditions across the cross line during the period from 1 December 2020 to 28 February 2021 were partially attributable to the downward propagation of signal pulses stemming from the SSW event in January 2021, we performed two nudging simulations utilizing the WRF-Chem model (Fig. 4c, e). In the first nudging run, the stratospheric circulation was nudged towards the observed evolution represented by the ERA5 reanalysis dataset from November 2020 to February 2021 (termed as NSSW, Fig. 4c). In the second nudging run, the stratospheric circulation was nudged towards the climatological state of ERA5 dataset from November to February during 1991 to 2020 (termed as NCLM, Fig. 4e). The tropospheric circulation remained unchanged in the two sets of nudging runs. Then, the difference in meteorological conditions in the troposphere between two nudging simulations can be regarded as the effect from the SSW in January 2021. It was found that the difference in zonal wind component at both 500 hPa and 700 hPa between NSSW and NCLM simulations was mainly negative during the fourth and fifth stages of the SSW (Supplementary Fig. 8), implying the SSW led to a decrease in westerly flow in the troposphere. With respect to the difference in meridional wind component between two nudging simulations, no obvious tendency was found (Supplementary Fig. 8). Similarly, the difference in the vertically integrated BC transport flux between two nudging runs can be considered as the effect of the SSW in January 2021 on the BC transport flux from South Asia to the TP. Similar to the CONT run (Fig. 4a), the daily mean of the total BC transport flux resulting from NSSW simulation also exhibited a significant decreasing trend, with the p-value less than 0.01 (Fig. 4c). Furthermore, the daily mean of the total BC transport flux from this nudging run also significantly correlated with that from the real-time MERRA-2 reanalysis dataset, with a correlation coefficient of up to 0.88, exceeding the 99% confidence level. However, the daily mean of the total BC transport flux from NCLM simulation showed a non-significant decrease trend (Fig. 4e). Therefore, the comparison of the variation tendencies in the daily mean of the total BC transport flux between the two nudging simulations revealed that the SSW event in January 2021 contributed to the reduction in the transport of BC from South Asia to the TP during the period from 1 December 2020 to 28 February 2021. To further support this conclusion, we presented two additional sets of climatological state analysis results, based on MERRA-2 reanalysis, which show the temporal variation in the daily mean of the total BC transport flux from 1 December 2020 to 28 February 2021 over the period 1991–2020 (Fig. 4d, f). One set excluded years with SSWs (Fig. 4d), while the other included years with SSWs (Fig. 4f). Contrary to the significant decreasing trend observed in the real-time MERRA-2 reanalysis dataset from December 1, 2020 to February 28, 2021, both sets of MERRA-2 climatological state analysis results exhibited a non-significant decrease trend in the daily mean of the total BC transport flux (Fig. 4b, f). Thus, we concluded that the SSW event in January 2021 did contribute to the decrease in the cross-border transport of BC from South Asia to the TP.
Figure 6 presents the longitudinal distribution of the vertically integrated BC transport flux along the cross line from two nudging simulations of NSSW and NCLM, averaged during the different stages of the SSW. During the first four stages of the SSW event, there was no obvious difference in the vertically integrated BC transport flux between the two sets of nudging simulations (Fig. 6a–d), since the disturbance to the tropospheric circulation, caused by the downward propagation of the SSW’s signal pulses from the North Atlantic, had not yet reached South Asia and the TP. However, during the fifth stage of the SSW, the vertically integrated BC transport flux from the NSSW simulation was notably lower than that from the NCLM simulation at each grid point along the cross line (Fig. 6e). This was because the abnormal signal pulses of the SSW from the North Atlantic had already propagated downward to the near-surface layer during the fourth stage, likely disturbing the Rossby wave train in the troposphere and propagating eastward, subsequently influencing the BC transport flux from South Asia to the TP. Therefore, our results confirmed that the SSW event in January 2021 substantially contributed to the reduction in the cross-border BC transport from South Asia to the TP. The percentage contribution was 32.0%.

The vertically integrated BC transport flux along the cross line (the red solid line in Fig. 1c) from the nudging simulations of NSSW (blue dotted line) and NCLM (red dotted line). The vertically integrated BC transport flux averaged during (a) the first, (b) the second, (c) the third, (d) the fourth, and (e) the fifth stages of the SSW event. The gray dotted line represents the terrain height along the cross line.
In fact, changes in meteorological conditions over the cross line, caused by the downward propagation of signals associated with the SSW event in January 2021, not only contributed to a reduction in the cross-border transport flux of BC from South Asia to the TP, but also facilitated a decrease in the cross-border transport flux of other aerosols, such as PM10 and PM2.5, from South Asia to the TP (Supplementary Figs. 9 and 10). Specifically, affected by this SSW event, the transport fluxes of PM10 and PM2.5 from South Asia towards the TP decreased by 36.8% and 38.6%, respectively. Consequently, our conclusion can be generalized from BC to aerosols as a whole, suggesting that the SSW event in January 2021 contributed to a diminished cross-border transport of aerosols from South Asia to the TP.
Linkage between the decreased aerosol transport flux and the SSW event
In this section, the underlying physical mechanism connecting the reduced aerosol transport flux from South Asia to the TP with the SSW event in January 2021 was uncovered. Since the SSW’s influence on the aerosol transport from South Asia to the TP primarily occurred in the fifth stage of the SSW, we subsequently analyzed the anomalies in tropospheric circulation at 300 hPa, 500 hPa, and 700 hPa levels over the Eurasian continent based on ERA5 reanalysis dataset, averaged specifically for this stage (Fig. 7a, d, g). Cyclones and anticyclones with negative and positive geopotential height anomalies alternately appeared in the North Atlantic, Western Europe, Ural, and from the Persian Gulf to northern China at 300 hPa, 500 hPa, and 700 hPa levels. Obviously, the circulation anomalies on these different isobaric surfaces over the Eurasian continent were identical, indicating that the anomalies in tropospheric circulation were barotropic during the fifth stage of the SSW. To the south of the anomalous anticyclone, which stretched from the Persian Gulf to northern China, easterly anomalies dominated over northwest South Asia and southern TP, hindering the transport of aerosols from South Asia to the TP.

The reanalyzed tropospheric circulation anomalies over the Eurasian continent at (a) 300 hPa, (d) 500 hPa, and (g) 700 hPa averaged during the fifth stage of the SSW. The simulated tropospheric circulation anomalies over the Eurasian continent at (b) 300 hPa, (e) 500 hPa, and (h) 700 hPa averaged during the fifth stage of the SSW. The simulated tropospheric circulation anomalies over the TP and its surroundings at (c) 300 hPa, (f) 500 hPa, and (i) 700 hPa averaged during the fifth stage of the SSW. The blue lines denote isopleths of geopotential height (H; unit: gpm). Vectors represent wind speed and direction (W; unit: m s−1).
The SSW event in January 2021 is a displacement type SSW event, with the stratospheric polar vortex mainly over the North Atlantic (Supplementary Fig. 1). The abnormal signal pulses of the SSW propagated downward to the near surface twice (Fig. 1a, b). However, it remained unclear whether the anomalies in tropospheric circulation over the Eurasian continent, particularly the anomalous anticyclone from the Persian Gulf to northern China, were partially caused by the downward propagation of abnormal signal pulses of the SSW. To address this query, we conducted two additional sets of nudging simulations solely for meteorology without chemistry over the Eurasian continent. The simulation domain was depicted in Supplementary Fig. 11. In the first nudging run, the stratospheric circulation was nudged towards the observed evolution represented by the ERA5 reanalysis dataset from November 2020 to February 2021 (termed as NC_SSW). In the second nudging run, the stratospheric circulation was nudged towards the climatological state of ERA5 dataset from November to February during 1991 to 2020 (termed as NC_CLM). The tropospheric circulation remained unchanged in the two sets of nudging runs. Thus, the difference in tropospheric circulation between the simulations of NC_SSW and NC_CLM can be considered as the tropospheric circulation anomalies induced by the SSW event in January 2021. The spatial patterns of the tropospheric circulation anomalies at 300 hPa, 500 hPa, and 700 hPa levels over the Eurasian continent, averaged during the fifth stage of the SSW event in January 2021 (Fig. 7b, e, h), resembled those in the ERA5 dataset at the same levels (Fig. 7a, d, g). This suggested that the SSW event in January 2021 contributed to the formation of tropospheric circulation anomalies over the Eurasian continent through the downward propagation of abnormal signal pulses associated with the SSW over the North Atlantic. In other words, the abnormal signal pulses of the SSW event disturbed the Rossby wave train, resulting in its eastward propagation. Particularly, from the Persian Gulf to northern China, anticyclonic circulation anomalies occurred, with easterly anomalies observed in the southern TP and northwest South Asia (Fig. 7b, e, h). The difference in tropospheric circulation between the nudging simulations of NSSW and NCLM, averaged for the fifth stage of the SSW event, also displayed a strong anticyclone at 300 hPa, 500 hPa, and 700 hPa levels over the TP and adjacent regions, with easterly anomalies prevailing in the southern TP and northwest South Asia (Fig. 7c, f, i). Affected by the easterly anomalies induced by the SSW event in January 2021, the aerosol transport flux from South Asia to the TP decreased. Therefore, the SSW event in January 2021 contributed to the formation of the tropospheric circulation anomalies, which in turn contributed to a diminished cross-border transport flux of aerosols from South Asia to the TP. In addition, we presented the Takaya-Nakamura (T-N) wave activity flux and the temperature advection at 300 hPa, 500 hPa and 700 hPa levels over the Eurasian continent, averaged for the fifth stage of the SSW, as shown in Supplementary Fig. 12. During the fifth stage of the SSW, the wave train originating from the North Atlantic propagated eastward in the mid-latitudes at a larger group velocity and eventually exerted substantial impact on circulation over South Asia and TP. Accompanied by the propagation of the Rossby wave, the cold temperature advection was transported to the TP and South Asia at different levels of the troposphere (Supplementary Fig. 12a–c). Results from previous studies showed that SSWs had potential impact on winter surface climate and mid-latitude cold air outbreaks36,37,38. Therefore, the reduction in the cross-border transport flux of aerosols from South Asia to the TP was related to the ongoing SSW pulses. The physical mechanism of the SSW event in January 2021 influencing the cross-border transport of aerosols from South Asia to the TP can be summarized as follows: The abnormal signal pulses of the SSW propagated downward, disturbing the Rossby wave train in the troposphere over the North Atlantic. Subsequently, the disturbed Rossby wave train propagated eastward, generating an anomalous anticyclonic flow extending from the Persian Gulf to northern China. To the south of this anticyclone, easterly anomalies dominated over South Asia and the southern TP, thereby hindering the cross-border transport of aerosols from South Asia to the TP. The schematic diagram of the SSW event in January 2021 influencing the transboundary transport of aerosols from South Asia to the TP was presented in Fig. 8. Taken together, the intense anticyclonic circulation anomaly extending from the Persian Gulf to northern China, triggered by the downward propagation of the abnormal signal pulses from the SSW event, was of utmost significance.

Schematic diagram of the SSW event in January 2021 influencing the transboundary transport of aerosols from South Asia to the TP.
Conclusions
This study investigated the impact of the SSW in January 2021 on the cross-border transport of aerosols from South Asia to the TP via the WRF-Chem simulation. Firstly, BC was selected as a proxy and the cross-border transport flux of BC from South Asia to the TP during the SSW was analyzed. The results indicated that in northwestern South Asia, BC was predominantly transported towards the TP. The longitudinal distribution of the vertically integrated BC transport flux exhibited a decrease from west to east along the Himalayas. Subsequently, the impact of the SSW event in January 2021 on the cross-border transport of BC from South Asia to the TP was investigated. The results showed that the SSW in January 2021 substantially contributed to the decrease in the cross-border transport of BC from South Asia to the TP. It is noteworthy that this conclusion can be extended from BC to other aerosols in general. Namely, the SSW event in January 2021 contributed to the reduction in the cross-border transport of aerosols from South Asia to the TP. Quantitatively, the SSW event in January 2021 contributed 30%–40% to the reduction in the transport of aerosols from South Asia to the TP.
The physical mechanism connecting the cross-border transport flux of aerosols from South Asia to the TP with the SSW event in January 2021 can be summarized as follows: The abnormal signal pulses of the SSW event propagated downwards, disturbing the Rossby wave in the troposphere over the North Atlantic. Consequently, the disturbed Rossby wave train propagated eastward, generating an anomalous anticyclonic circulation extending from the Persian Gulf to northern China. To the south of this anomalous anticyclone, easterly anomalies dominated over northwest South Asia and southern TP, effectively hindering the transport of aerosols from South Asia towards the TP.
We acknowledge that our study has limitations, primarily due to its focus on a single SSW event. To examine whether the findings of this study can be generalized to other SSWs, we composited the time series of the daily mean of the total BC transport flux for all grid points along the cross line (depicted as the red solid line in Fig. 1c), spanning from 20 days before to 30 days after the onset of all displacement-type SSWs that occurred during the period from 2020 to 2021, as shown in Supplementary Fig. 13. A non-significant decreasing trend in BC transport flux from South Asia to the TP was detected, suggesting that the results presented in this study might not be generalized to other SSWs.
Methods
Data
The ERA5 dataset39, which can be accessed at https://cds.climate.copernicus.eu/#!/home, was downloaded at a horizontal resolution of 1° × 1° at 37 pressure levels from 1000 to 1 hPa and a temporal resolution of 6 h (00, 06, 12, and 18 UTC). Multi-level variables, including the u-component of wind, v-component of wind, geopotential, and temperature, and single-level variables, including 2-m temperature, 2-m dewpoint temperature, and 10-m u component of wind and 10-m v component of wind, were used in this study. The long-term mean for each day of the year over the period from 1991 to 2020 was calculated to represent the typical daily climatology. The daily anomalies presented in this study were obtained by subtracting the annual cycle of the typically daily climatology from the original data.
MERRA-2 aerosol reanalysis, accessible at https://gmao.gsfc.nasa.gov/reanalysis/MERRA-2/data_access/, has considerable skill in revealing a multitude of observable aerosol properties40,41. In this study, variables including the BC surface mass concentration (kg m−3), BC column u-wind mass flux (kg m−1 s−1), BC column v-wind mass flux (kg m−1 s−1), and AOD at 550 nm, which has a spatial resolution of 0.5° by 0.625° (latitude by longitude), were used.
In addition, daily averaged AOD data (version 3, level 2) that have been cloud-screened and quality-assured were used42,43, available from the Aerosol Robotic Network website of https://aeronet.gsfc.nasa.gov/. Meanwhile, the combined Dark Target and Deep Blue AOD at 550 nm, with a horizontal resolution of 1° × 1° for both land and ocean, from the Moderate Resolution Imaging Spectroradiometer (MODIS)/Aqua and MODIS/Terra Level-3 Collection 6 products, which are available through the website at https://ladsweb.modaps.eosdis.nasa.gov/, were used.
WRF-Chem model configuration and experimental design
WRF-Chem version 3.9 was used in this study. To validate the model performance on meteorology and chemistry over South Asia and the TP, and to quantitatively calculate the cross-border transport flux of aerosols from South Asia towards the TP, one free-running simulation was conducted, specifically namely CONT. The model domain of this CONT experiment was centered at 33° N, 88.20° E, encompassing the entire TP and its neighboring regions (Fig. 1c). The model domain had 190 grid points in the west-east direction and 130 grid points in the south-north direction, with a horizontal resolution of 30 km. Vertically, it spanned 54 sigma levels from the ground to 20 hPa. The key physical parameterization options used in the simulation were the Noah land surface model44,45, the Monin-Obukhov scheme for surface layer processes46, the double-moment Morrison microphysics scheme47, the Grell-Freitas cumulus scheme48, the Mellor-Yamada-Janjic planetary boundary layer scheme49, and the Rapid Radiative Transfer Model for General circulation models (RRTMG) for both longwave and shortwave radiation50. The chemical parameterization option used in the simulation was the Carbon-Bond Mechanism version Z (CBMZ) gas-phase chemistry mechanism51, which was linked to the aerosol module of the Model for Simulating Aerosol Interactions and Chemistry (MOSAIC)52. It should be noted that the aerosol size was divided into four bins. The specific parameterization options used in the simulation can be found in Supplementary Table 3.
The initial and boundary conditions of meteorological fields used in the simulation were derived from ERA5, which had a temporal interval of 6 h and a horizontal resolution of 1° × 1°. The anthropogenic emission source used in the simulation was the Emission Database for Global Atmospheric Research (EDGAR)-Hemispheric Transport Air Pollution version 3 (HTAPv3) emission inventory (https://edgar.jrc.ec.europa.eu/dataset_htap_v3) for 2018. The biomass burning emissions were calculated using the high-resolution fire emissions data provided by the Fire INventory from National Center for Atmospheric Research (NCAR), version 2.5 (FINNv2.5)53, accessible via the website at https://www.acom.ucar.edu/Data/fire/. The biogenic emissions were calculated online using the Model of Emissions of Gases and Aerosols from Nature (MEGAN)54,55. To improve the chemical initial and boundary conditions, the Whole Atmosphere Community Climate Model (WACCM) forecasts were used56, which can be accessed via the website at https://www.acom.ucar.edu/waccm/download.shtml. The model simulation was conducted from 28 November 2020 to 28 February 2021, and the first three days was used for model spin-up. The results from 1 December 2020 to 28 February 2021 were used for the analysis.
To demonstrate the impact of the SSW event in January 2021 on the transboundary transport flux of aerosols from South Asia towards the TP, we conducted two nudging simulations, namely NSSW and NCLM. In the nudging run of NSSW, the stratospheric circulation was nudged towards the observed evolution represented by the ERA5 reanalysis dataset from November 2020 to February 2021. In the nudging run of NCLM, the stratospheric circulation was nudged towards the climatological state of ERA5 dataset from November to February during 1991 to 2020. The tropospheric circulation remained unchanged in the two sets of nudging runs. The physical and chemical configurations in these two nudging runs were identical to those in the CONT run, with the exception that the spectral nudging technique was applied to temperature, horizontal winds, and geopotential height. Then, the difference in the transport flux of aerosols between these two nudging runs can be considered as the effect of the SSW event in January 2021 on the aerosol transport flux from South Asia towards the TP.
To illustrate the impact of the SSW event in January 2021 on the tropospheric circulation over Eurasian continent, we designed two additional sets of nudging simulations solely for meteorology, with no chemistry included, namely NC_SSW and NC_CLM. In the nudging run of NC_SSW, the stratospheric circulation was nudged towards the observed evolution represented by the ERA5 reanalysis dataset from November 2020 to February 2021. In the nudging run of NC_CLM, the stratospheric circulation was nudged towards the climatological state of ERA5 dataset from November to February during 1991 to 2020. The tropospheric circulation remained unchanged in the two sets of nudging runs. The physical parameterization options in these two nudging runs were identical to those in the CONT run. The spectral nudging technique was applied to temperature, horizontal winds, and geopotential height. It should be noted that the model domain of these two nudging runs was centered at 40° N, 50° E, encompassing the Eurasian continent and its neighboring regions (Supplementary Fig. 11). The model domain had 380 grid points in the west-east direction and 260 grid points in the south-north direction, with a horizontal resolution of 30 km. Vertically, it spanned 54 sigma levels from the ground to 20 hPa.
For the purpose of spectral nudging, we set the nudging coefficient with a value of 4.5 × 10⁻⁴ s−1, which was equivalent to a damping time scale of 1.5 h. Specifically, spectral nudging was initiated at the 200 hPa level with an initial nudging coefficient of 0, gradually rising to the maximum nudging coefficient of 4.5 × 10⁻⁴ s−1 in proximity to the 150 hPa level, and subsequently maintaining that full strength above the 150 hPa level. The wave numbers for spectral nudging were calculated using the equations provided below57:
where \({n}_{x}\) and \({n}_{y}\) denote the wave number in the west-east and south-north directions, respectively; \({D}_{x}\) and \({D}_{y}\) represent the resolution in the west-east and south-north directions, respectively; \({N}_{x}\) and \({N}_{y}\) denote the grid points in the west-east and south-north directions, respectively; and R represents the Rossby radius of 1000 km. In the nudging runs of NSSW and NCLM, \({n}_{x}\) equaled 6.7, while \({n}_{y}\) equaled 4.9. We then nudged the first 7 waves in the west-east direction and the first 5 waves in the south-north direction. However, in the nudging runs of NC_SSW and NC_CLM, \({n}_{x}\) was 12.4, while \({n}_{y}\) was 8.8. We then nudged the first 12 waves in the west-east direction and the first 9 waves in the south-north direction.
Aerosol transport flux
Herein, the aerosol transport flux was determined by projecting the wind field perpendicularly onto the cross line, and then multiplying the projected wind field by the corresponding aerosol mass concentrations33. The vertically integrated aerosol transport flux was determined by integrating the aerosol transport flux in the vertical direction33.
For example, the BC transport flux can be calculated using the formula as follows:
where α represents the angle between the zonal wind component and the cross line, β represents the angle between the meridional wind component and the cross line. \(C\) denotes the BC mass concentrations at the grid along the cross line. The flux was calculated at each model level33.
The vertically integrated BC transport flux can be calculated via integrating the right-hand term of Eq. (3) as follows:
where \(\delta z\) is the thickness of each vertical model level33.
Positive values of \({TF}\) and \({ITF}\) denote the transport directed towards the TP, while negative values denote the transport directed away from the TP33.
T-N wave activity flux
The T-N wave activity flux, an extension of the Plumb wave activity flux, was used to track the pathway of the wave energy58,59. Here, the horizontal T-N wave activity flux (\(W\)) was calculated, which can be expressed as follows60:
where overbars denote the temporal mean and the primes denote the seasonal average anomaly from climatology. \(P\) is the pressure. \(\alpha\) is the radius of Earth. \(\varphi\) is the latitude. The term \(|\bar{U}|\) denotes the wind speed. \(\bar{u}\) and \(\bar{v}\) represent the zonal and meridional wind, respectively. \({\psi }^{{\prime} }=\frac{{\phi }^{{\prime} }}{f}\), where \(f=2\varOmega \sin \varphi\), \(\phi\) and\(\,\varOmega\) represent the geopotential height and Earth rotation rate, respectively. x and y denote the partial derivative of \({\psi }^{{\prime} }\) in zonal and meridional directions, respectively.
Data availability
The ERA5 dataset39 can be accessed at https://cds.climate.copernicus.eu/#!/home. The MERRA-2 aerosol reanalysis is available at https://gmao.gsfc.nasa.gov/reanalysis/MERRA-2/data_access/. The EDGAR-HTAPv3 emission inventory can be accessed at https://edgar.jrc.ec.europa.eu/dataset_htap_v3. MEGAN code and data can be found at https://www.acom.ucar.edu/wrf-chem/download.shtml. FINN data are accessible via the website at https://www.acom.ucar.edu/Data/fire/. WACCM forecasts are available at https://www.acom.ucar.edu/waccm/download.shtml. The observed daily mean AOD data are available from the Aerosol Robotic Network website of https://aeronet.gsfc.nasa.gov/. The MODIS/Aqua and MODIS/Terra Level-3 Collection 6 products are available through the website at https://ladsweb.modaps.eosdis.nasa.gov/. The original simulation data used in this study are stored in a high-performance computing centre of Sun Yat-Sen University due to large data storage and can be made available from the corresponding author upon request. Source data for figures in our manuscript are available at http://shichang-kang.sklcs.ac.cn/Data/Data&Code.rar.
Code availability
The WRF-Chem code can be downloaded from the official website: https://www2.acom.ucar.edu/wrf-chem. Data were analyzed with publicly available software: NCAR Command Language (NCL). Major NCL scripts were deposited in http://shichang-kang.sklcs.ac.cn/Data/Data&Code.rar. Other scripts are available upon request. Haipeng Yu (yuhp@lzb.ac.cn).
References
Yao, T. et al. The imbalance of the Asian water tower. Nat. Rev. Earth Env. https://doi.org/10.1038/s43017-022-00299-4 (2022).
Kang, S. et al. Review of climate and cryospheric change in the Tibetan Plateau. Environ. Res. Lett. 5, 015101 (2010).
You, Q., Min, J. & Kang, S. Rapid warming in the Tibetan Plateau from observations and CMIP5 models in recent decades. Int. J. Climatol. 36, 2660–2670 (2016).
You, Q. et al. Warming amplification over the Arctic Pole and Third Pole: Trends, mechanisms and consequences. Earth Sci. Rev. 217, 103625 (2021).
Yao, T., Pu, J., Lu, A., Wang, Y. & Yu, W. Recent Glacial Retreat and Its Impact on Hydrological Processes on the Tibetan Plateau, China, and Surrounding Regions. Arct. Antarct. Alp. Res. 39, 642–650 (2007).
Xu, B. et al. Black soot and the survival of Tibetan glaciers. Proc. Natl Acad. Sci. USA 106, 22114 (2009).
Zhang, Y., Gao, T., Kang, S., Shangguan, D. & Luo, X. Albedo reduction as an important driver for glacier melting in Tibetan Plateau and its surrounding areas. Earth Sci. Rev. 220, 103735 (2021).
Kang, S. et al. Linking atmospheric pollution to cryospheric change in the Third Pole region: current progress and future prospects. Natl Sci. Rev. 6, 796–809 (2019).
Yang, J., Kang, S., Ji, Z. & Chen, D. Modeling the origin of anthropogenic black carbon and its climatic effect over the Tibetan Plateau and surrounding regions. J. Geophys. Res. Atmos. 123, 671–692 (2018).
Rai, M. et al. Tracing Atmospheric Anthropogenic Black Carbon and Its Potential Radiative Response Over Pan-Third Pole Region: A Synoptic-Scale Analysis Using WRF-Chem. J. Geophys. Res. Atmos. 127, e2021JD035772 (2022).
Kang, S. et al. The transboundary transport of air pollutants and their environmental impacts on Tibetan Plateau. Chin. Sci. Bull. 64, 2876–2884 (2019).
Hu, Y. et al. Transport of black carbon from Central and West Asia to the Tibetan Plateau: Seasonality and climate effect. Atmos. Res. 267, 105987 (2022).
Hu, Y. et al. Aerosol–meteorology feedback diminishes the transboundary transport of black carbon into the Tibetan Plateau. Atmos. Chem. Phys. 24, 85–107 (2024).
Yang, J., Ji, Z., Kang, S. & Tripathee, L. Contribution of South Asian biomass burning to black carbon over the Tibetan Plateau and its climatic impact. Environ. Pollut. 270, 116195 (2021).
Rantanen, M. et al. The Arctic has warmed nearly four times faster than the globe since 1979. Commun. Earth Environ. 3, 168 (2022).
Zhang, J., Tian, W., Chipperfield, M. P., Xie, F. & Huang, J. Persistent shift of the Arctic polar vortex towards the Eurasian continent in recent decades. Nat. Clim. Change 6, 1094–1099 (2016).
Zhang, P., Wu, Y. & Smith, K. L. Prolonged effect of the stratospheric pathway in linking Barents–Kara Sea sea ice variability to the midlatitude circulation in a simplified model. Clim. Dyn. 50, 527–539 (2018).
Kim, B.-M. et al. Weakening of the stratospheric polar vortex by Arctic sea-ice loss. Nat. Commun. 5, 4646 (2014).
Schoeberl, M. R. & Hartmann, D. L. The Dynamics of the Stratospheric Polar Vortex and Its Relation to Springtime Ozone Depletions. Science 251, 46–52 (1991).
Manney, G. L. et al. Aura Microwave Limb Sounder observations of dynamics and transport during the record‐breaking 2009 Arctic stratospheric major warming. Geophys. Res. Lett. 36, https://doi.org/10.1029/2009gl038586 (2009).
Zhang, R. et al. The Corresponding Tropospheric Environments during Downward-Extending and Nondownward-Extending Events of Stratospheric Northern Annular Mode Anomalies. J. Clim. 32, 1857–1873 (2019).
Huang, J. & Tian, W. Eurasian Cold Air Outbreaks under Different Arctic Stratospheric Polar Vortex Strengths. J. Atmos. Sci. 76, 1245–1264 (2019).
Domeisen, D. I. V. & Butler, A. H. Stratospheric drivers of extreme events at the Earth’s surface. Commun. Earth Environ. 1, 59 (2020).
Williams, R. S., Hegglin, M. I., Jöckel, P., Garny, H. & Shine, K. P. Air quality and radiative impacts of downward-propagating sudden stratospheric warmings (SSWs). Atmos. Chem. Phys. 24, 1389–1413 (2024).
Butler, A. H., Sjoberg, J. P., Seidel, D. J. & Rosenlof, K. H. A sudden stratospheric warming compendium. Earth Syst. Sci. Data 9, 63–76 (2017).
Lu, Q. et al. The sudden stratospheric warming in January 2021. Environ. Res. Lett. 16, 084029 (2021).
Rao, J. et al. The January 2021 Sudden Stratospheric Warming and Its Prediction in Subseasonal to Seasonal Models. J. Geophys. Res. Atmos. 126, e2021JD035057 (2021).
Lee, S. H. The January 2021 sudden stratospheric warming. Weather 76, 135–136 (2021).
Lee, S. H. & Butler, A. H. The 2018–2019 Arctic stratospheric polar vortex. Weather 75, 52–57 (2020).
Charlton, A. J. & Polvani, L. M. A new look at stratospheric sudden warmings. Part I: Climatology and modeling benchmarks. J. Clim. 20, 449–469 (2007).
Butler, A. H. et al. Defining Sudden Stratospheric Warmings. Bull. Am. Meteorol. Soc. 96, 1913–1928 (2015).
Baldwin, M. P. & Dunkerton, T. J. Stratospheric harbingers of anomalous weather regimes. Science 294, 581–584 (2001).
Zhang, M. et al. Impact of topography on black carbon transport to the southern Tibetan Plateau during the pre-monsoon season and its climatic implication. Atmos. Chem. Phys. 20, 5923–5943 (2020).
Cai, W., Li, K., Liao, H., Wang, H. & Wu, L. Weather conditions conducive to Beijing severe haze more frequent under climate change. Nat. Clim. Change 7, 257–262 (2017).
Chen, H. & Wang, H. Haze Days in North China and the associated atmospheric circulations based on daily visibility data from 1960 to 2012. J. Geophys. Res. Atmos. 120, 5895–5909 (2015).
Huang, J., Hitchcock, P., Maycock, A. C., McKenna, C. M. & Tian, W. Northern hemisphere cold air outbreaks are more likely to be severe during weak polar vortex conditions. Commun. Earth Environ. 2, 147 (2021).
Yu, Y., Cai, M., Shi, C. & Ren, R. On the Linkage among Strong Stratospheric Mass Circulation, Stratospheric Sudden Warming, and Cold Weather Events. Mon. Weather Rev. 146, 2717–2739 (2018).
Huang, J., Hitchcock, P., Tian, W. & Sillin, J. Stratospheric Influence on the Development of the 2018 Late Winter European Cold Air Outbreak. J. Geophys. Res. Atmos. 127, e2021JD035877 (2022).
Hersbach, H. et al. The ERA5 global reanalysis. Q. J. R. Meteorol. Soc. 146, 1999–2049 (2020).
Gelaro, R. et al. The Modern-Era Retrospective Analysis for Research and Applications, Version 2 (MERRA-2). J. Clim. 30, 5419–5454 (2017).
Randles, C. A. et al. The MERRA-2 Aerosol Reanalysis, 1980 Onward. Part I: System Description and Data Assimilation Evaluation. J. Clim. 30, 6823–6850 (2017).
Smirnov, A., Holben, B. N., Eck, T. F., Dubovik, O. & Slutsker, I. Cloud-Screening and Quality Control Algorithms for the AERONET Database. Remote Sens. Environ. 73, 337–349 (2000).
Giles, D. M. et al. Advancements in the Aerosol Robotic Network (AERONET) Version 3 database – automated near-real-time quality control algorithm with improved cloud screening for Sun photometer aerosol optical depth (AOD) measurements. Atmos. Meas. Tech. 12, 169–209 (2019).
Ek, M. B. et al. Implementation of Noah land surface model advances in the National Centers for Environmental Prediction operational mesoscale Eta model. J. Geophys. Res. Atmos. 108, https://doi.org/10.1029/2002JD003296 (2003).
Chen, Y., Yang, K., Zhou, D., Qin, J. & Guo, X. Improving the Noah Land Surface Model in Arid Regions with an Appropriate Parameterization of the Thermal Roughness Length. J. Hydrometeorol. 11, 995–1006 (2010).
Srivastava, P. & Sharan, M. An Analytical Formulation of the Monin–Obukhov Stability Parameter in the Atmospheric Surface Layer Under Unstable Conditions. Bound. Layer. Meteorol. 165, 371–384 (2017).
Morrison, H., Thompson, G. & Tatarskii, V. Impact of Cloud Microphysics on the Development of Trailing Stratiform Precipitation in a Simulated Squall Line: Comparison of One- and Two-Moment Schemes. Mon. Weather Rev. 137, 991–1007 (2009).
Grell, G. A. & Freitas, S. R. A scale and aerosol aware stochastic convective parameterization for weather and air quality modeling. Atmos. Chem. Phys. 14, 5233–5250 (2014).
Janjić, Z. I. The Step-Mountain Eta Coordinate Model: Further Developments of the Convection, Viscous Sublayer, and Turbulence Closure Schemes. Mon. Weather Rev. 122, 927–945 (1994).
Iacono, M. J. et al. Radiative forcing by long-lived greenhouse gases: Calculations with the AER radiative transfer models. J. Geophys. Res. Atmos. 113, https://doi.org/10.1029/2008JD009944 (2008).
Zaveri, R. A. & Peters, L. K. A new lumped structure photochemical mechanism for large-scale applications. J. Geophys. Res.: Atmos. 104, 30387–30415 (1999).
Zaveri, R. A., Easter, R. C., Fast, J. D. & Peters, L. K. Model for Simulating Aerosol Interactions and Chemistry (MOSAIC). J. Geophys. Res. Atmos. 113, D13204 (2008).
Wiedinmyer, C. et al. The Fire Inventory from NCAR version 2.5: an updated global fire emissions model for climate and chemistry applications. Geosci. Model Dev. 16, 3873–3891 (2023).
Guenther, A. et al. Estimates of global terrestrial isoprene emissions using MEGAN (Model of Emissions of Gases and Aerosols from Nature). Atmos. Chem. Phys. 6, 3181–3210 (2006).
Guenther, A. B. et al. The Model of Emissions of Gases and Aerosols from Nature version 2.1 (MEGAN2.1): an extended and updated framework for modeling biogenic emissions. Geosci. Model Dev. 5, 1471–1492 (2012).
ACOM/NCAR/UCAR (Research Data Archive at the National Center for Atmospheric Research, Computational and Information Systems Laboratory, 2020).
Gómez, B. & Miguez-Macho, G. The impact of wave number selection and spin-up time in spectral nudging. Q. J. R. Meteorol. Soc. 143, 1772–1786 (2017).
Plumb, R. A. On the Three-Dimensional Propagation of Stationary Waves. J. Atmos. Sci. 42, 217–229 (1985).
Takaya, K. & Nakamura, H. A Formulation of a Phase-Independent Wave-Activity Flux for Stationary and Migratory Quasigeostrophic Eddies on a Zonally Varying Basic Flow. J. Atmos. Sci. 58, 608–627 (2001).
Cheng, S. et al. Impact of Summer North Atlantic Sea Surface Temperature Tripole on Precipitation over Mid–High-Latitude Eurasia. J. Clim. 37, 5037–5053 (2024).
Acknowledgements
This work was financially supported by the National Natural Science Foundation of China (Grant No. 42122034, 42075043, 42205123), the Youth Innovation Promotion Association (Grant No. 2021427) and West Light Foundation (Grant No. xbzg-zdsys-202215) of the Chinese Academy of Sciences, Key Talent Projects in Gansu Province, Central Guidance Fund for Local Science and Technology Development Projects in Gansu Province (Grant No. 24ZYQA031) and the Science and Technology Program of Gansu Province (Grant No. 23ZDFA017).
Author information
Authors and Affiliations
Contributions
Yuling Hu designed the numerical experiments, created all figures, and authored the article. Haipeng Yu contributed to the scientific discussion on the manuscript. Shichang Kang designed the research. Mian Xu assisted in validating the WRF-Chem model. Siyu Chen provided comments on the manuscript. Junhua Yang conducted the analysis. Xintong Chen contributed to the interpretation of the results. Jixiang Li offered assistance with the visualization.
Corresponding author
Ethics declarations
Competing interests
The authors declare no competing interests.
Peer review
Peer review information
Communications Earth & Environment thanks and the other, anonymous, reviewer(s) for their contribution to the peer review of this work. Primary Handling Editors: Kerstin Schepanski, Heike Langenberg. [A peer review file is available.]
Additional information
Publisher’s note Springer Nature remains neutral with regard to jurisdictional claims in published maps and institutional affiliations.
Supplementary information
Rights and permissions
Open Access This article is licensed under a Creative Commons Attribution-NonCommercial-NoDerivatives 4.0 International License, which permits any non-commercial use, sharing, distribution and reproduction in any medium or format, as long as you give appropriate credit to the original author(s) and the source, provide a link to the Creative Commons licence, and indicate if you modified the licensed material. You do not have permission under this licence to share adapted material derived from this article or parts of it. The images or other third party material in this article are included in the article’s Creative Commons licence, unless indicated otherwise in a credit line to the material. If material is not included in the article’s Creative Commons licence and your intended use is not permitted by statutory regulation or exceeds the permitted use, you will need to obtain permission directly from the copyright holder. To view a copy of this licence, visit http://creativecommons.org/licenses/by-nc-nd/4.0/.
About this article

Cite this article
Hu, Y., Yu, H., Kang, S. et al. Reduced aerosol transport from South Asia to the Tibetan Plateau following the January 2021 sudden stratospheric warming event. Commun Earth Environ 5, 706 (2024). https://doi.org/10.1038/s43247-024-01889-4
Received:
Accepted:
Published:
Version of record:
DOI: https://doi.org/10.1038/s43247-024-01889-4
