
Fig. 3: Model performance in embedding extraction.
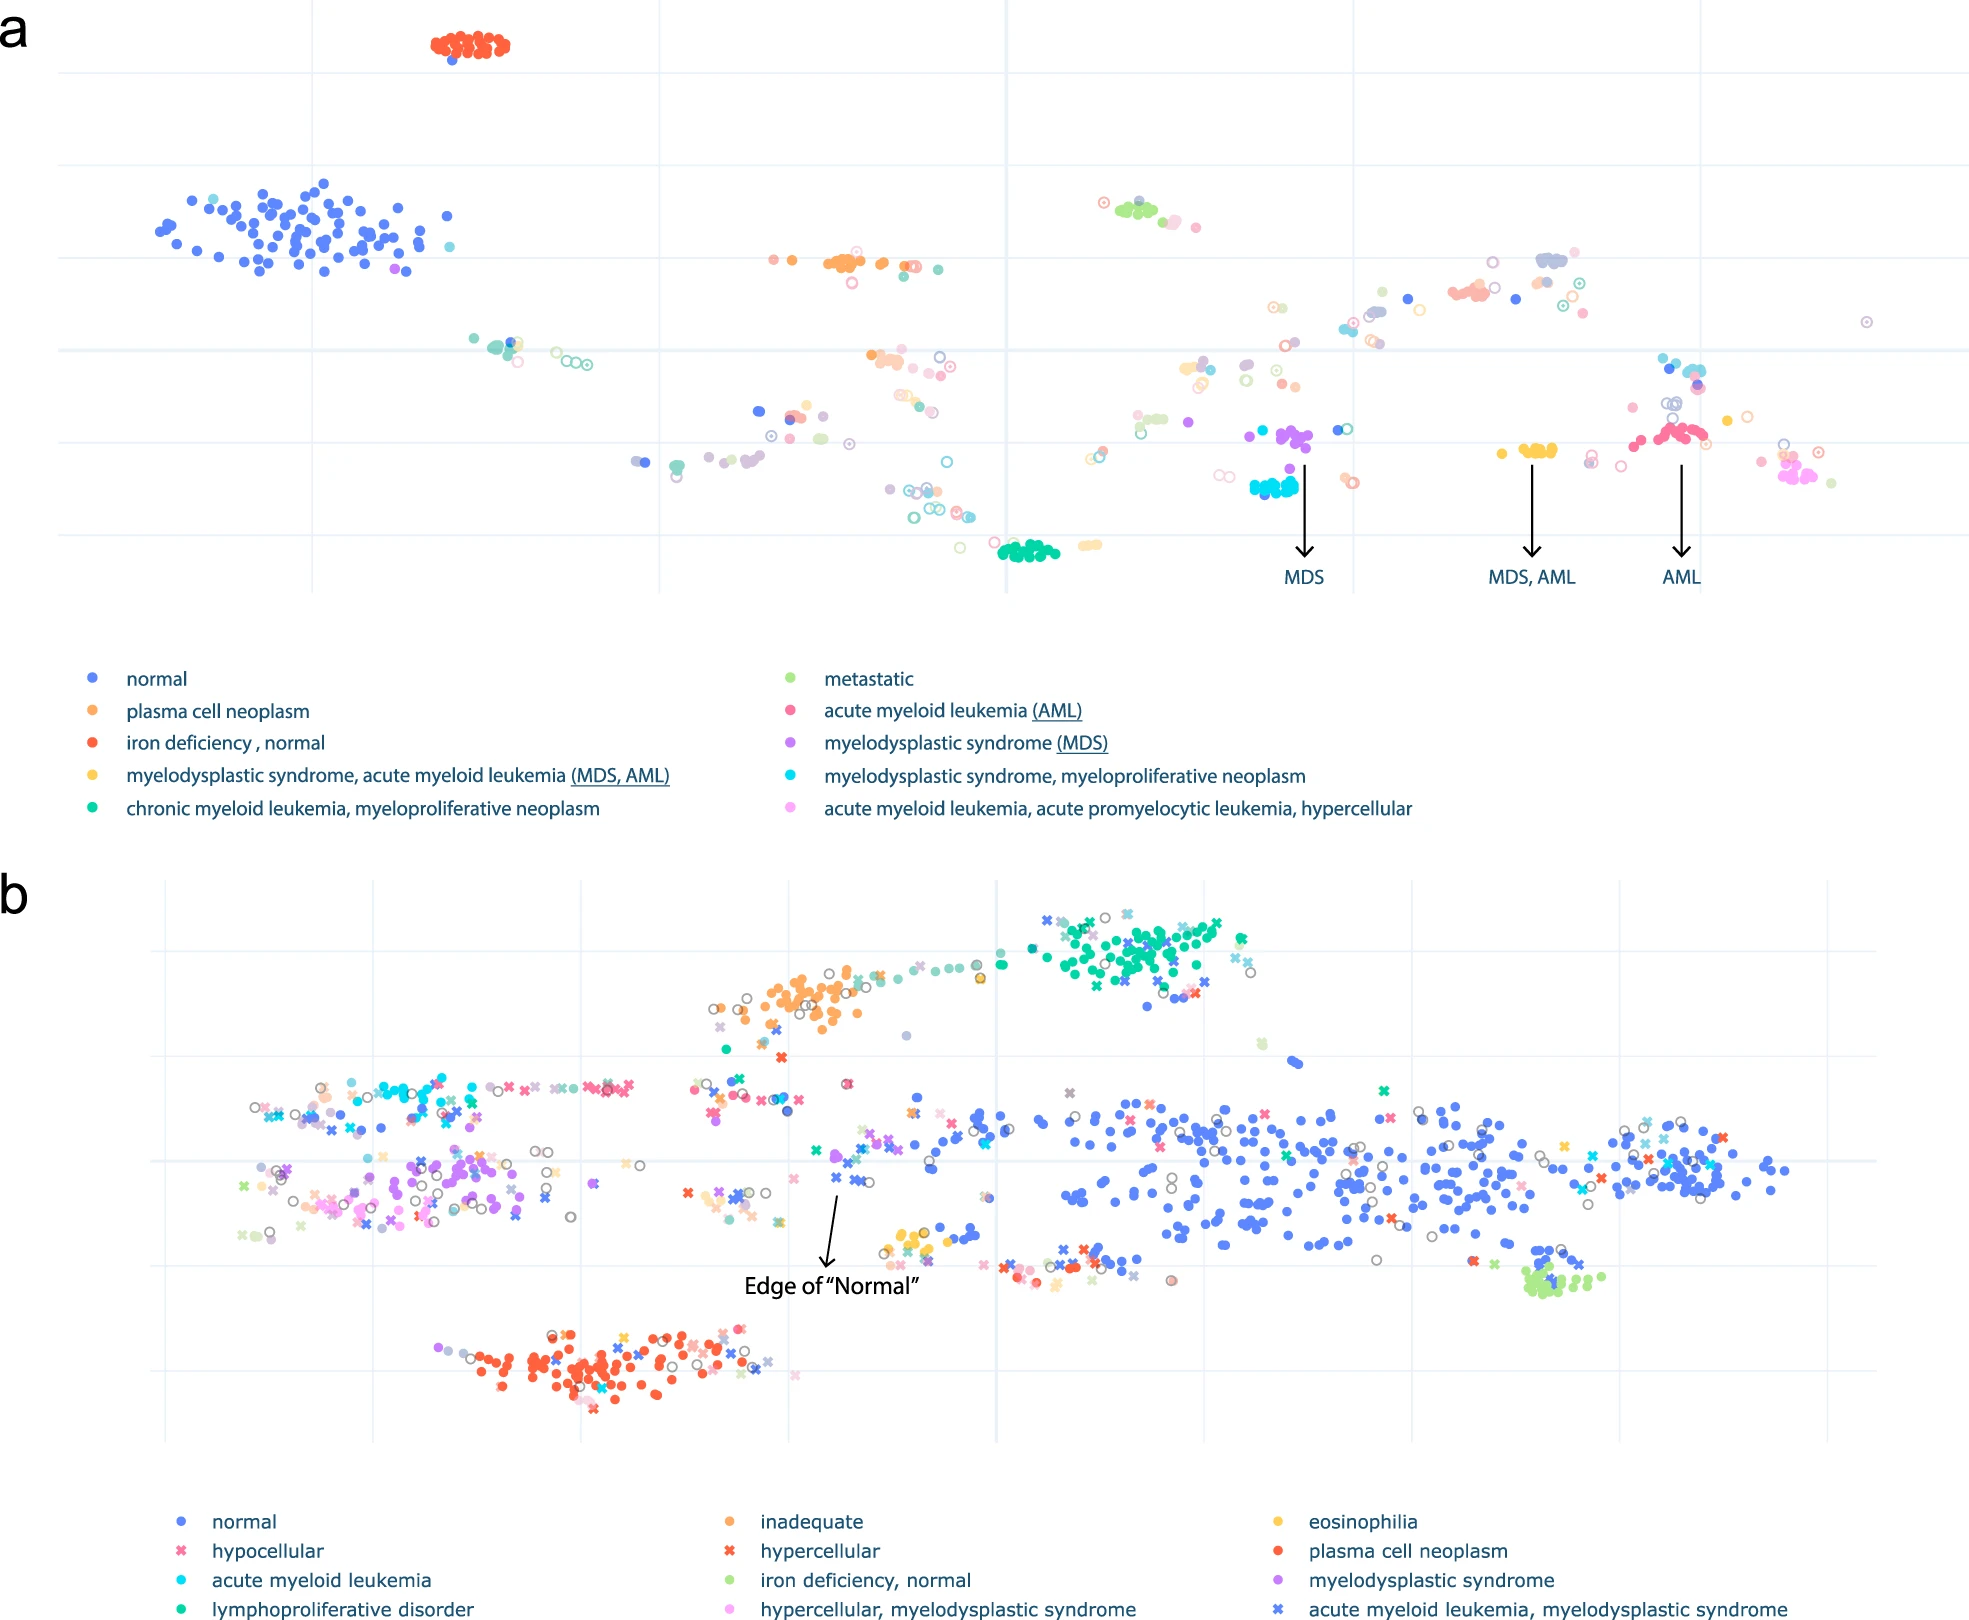
a 2D projection of synopsis embeddings from the 500 cases in the development set is shown. Embeddings are colored according to the combination of semantic labels. Only semantic labels with more than 12 cases are shown in the legend. The cases with the same combination of labels tend to cluster together, which suggests that the embeddings are diagnostically meaningful. Interestingly, groups with overlapping labels cluster in close proximity. For example, the “acute myeloid leukemia, myelodysplastic syndrome” group lies between the “myelodysplastic syndrome” group and the “acute myeloid leukemia” group. This suggests the model learned subtle patterns from the dataset and can map synopses to low-dimensional vectors according to diagnostic semantics. b 2D projection of synopsis embeddings from the 1000 cases in the evaluation set is shown. Embeddings are colored according to the combination of semantic labels. Dots represent the cases whose predictions match pathologists’ assessments. Crosses represent the cases whose predictions do not match their assessments. Only combinations with more than 12 cases are shown in the legend, and the symbol is a circle if at least 50% of cases in the group show matching between model prediction and hematopathologist review. A match means the predicted labels are the same as pathologists' expert judgment. Open-circles are the cases that were not reviewed by pathologists. [Readers can also interact with the graphs on https://storage.googleapis.com/pathopatho/label_tsne.html and https://storage.googleapis.com/pathopatho/unlabel_tsne.html, respectively]
