
Fig. 2: Applying the region of interest (ROI) detection model.
From: Automated bone marrow cytology using deep learning to generate a histogram of cell types
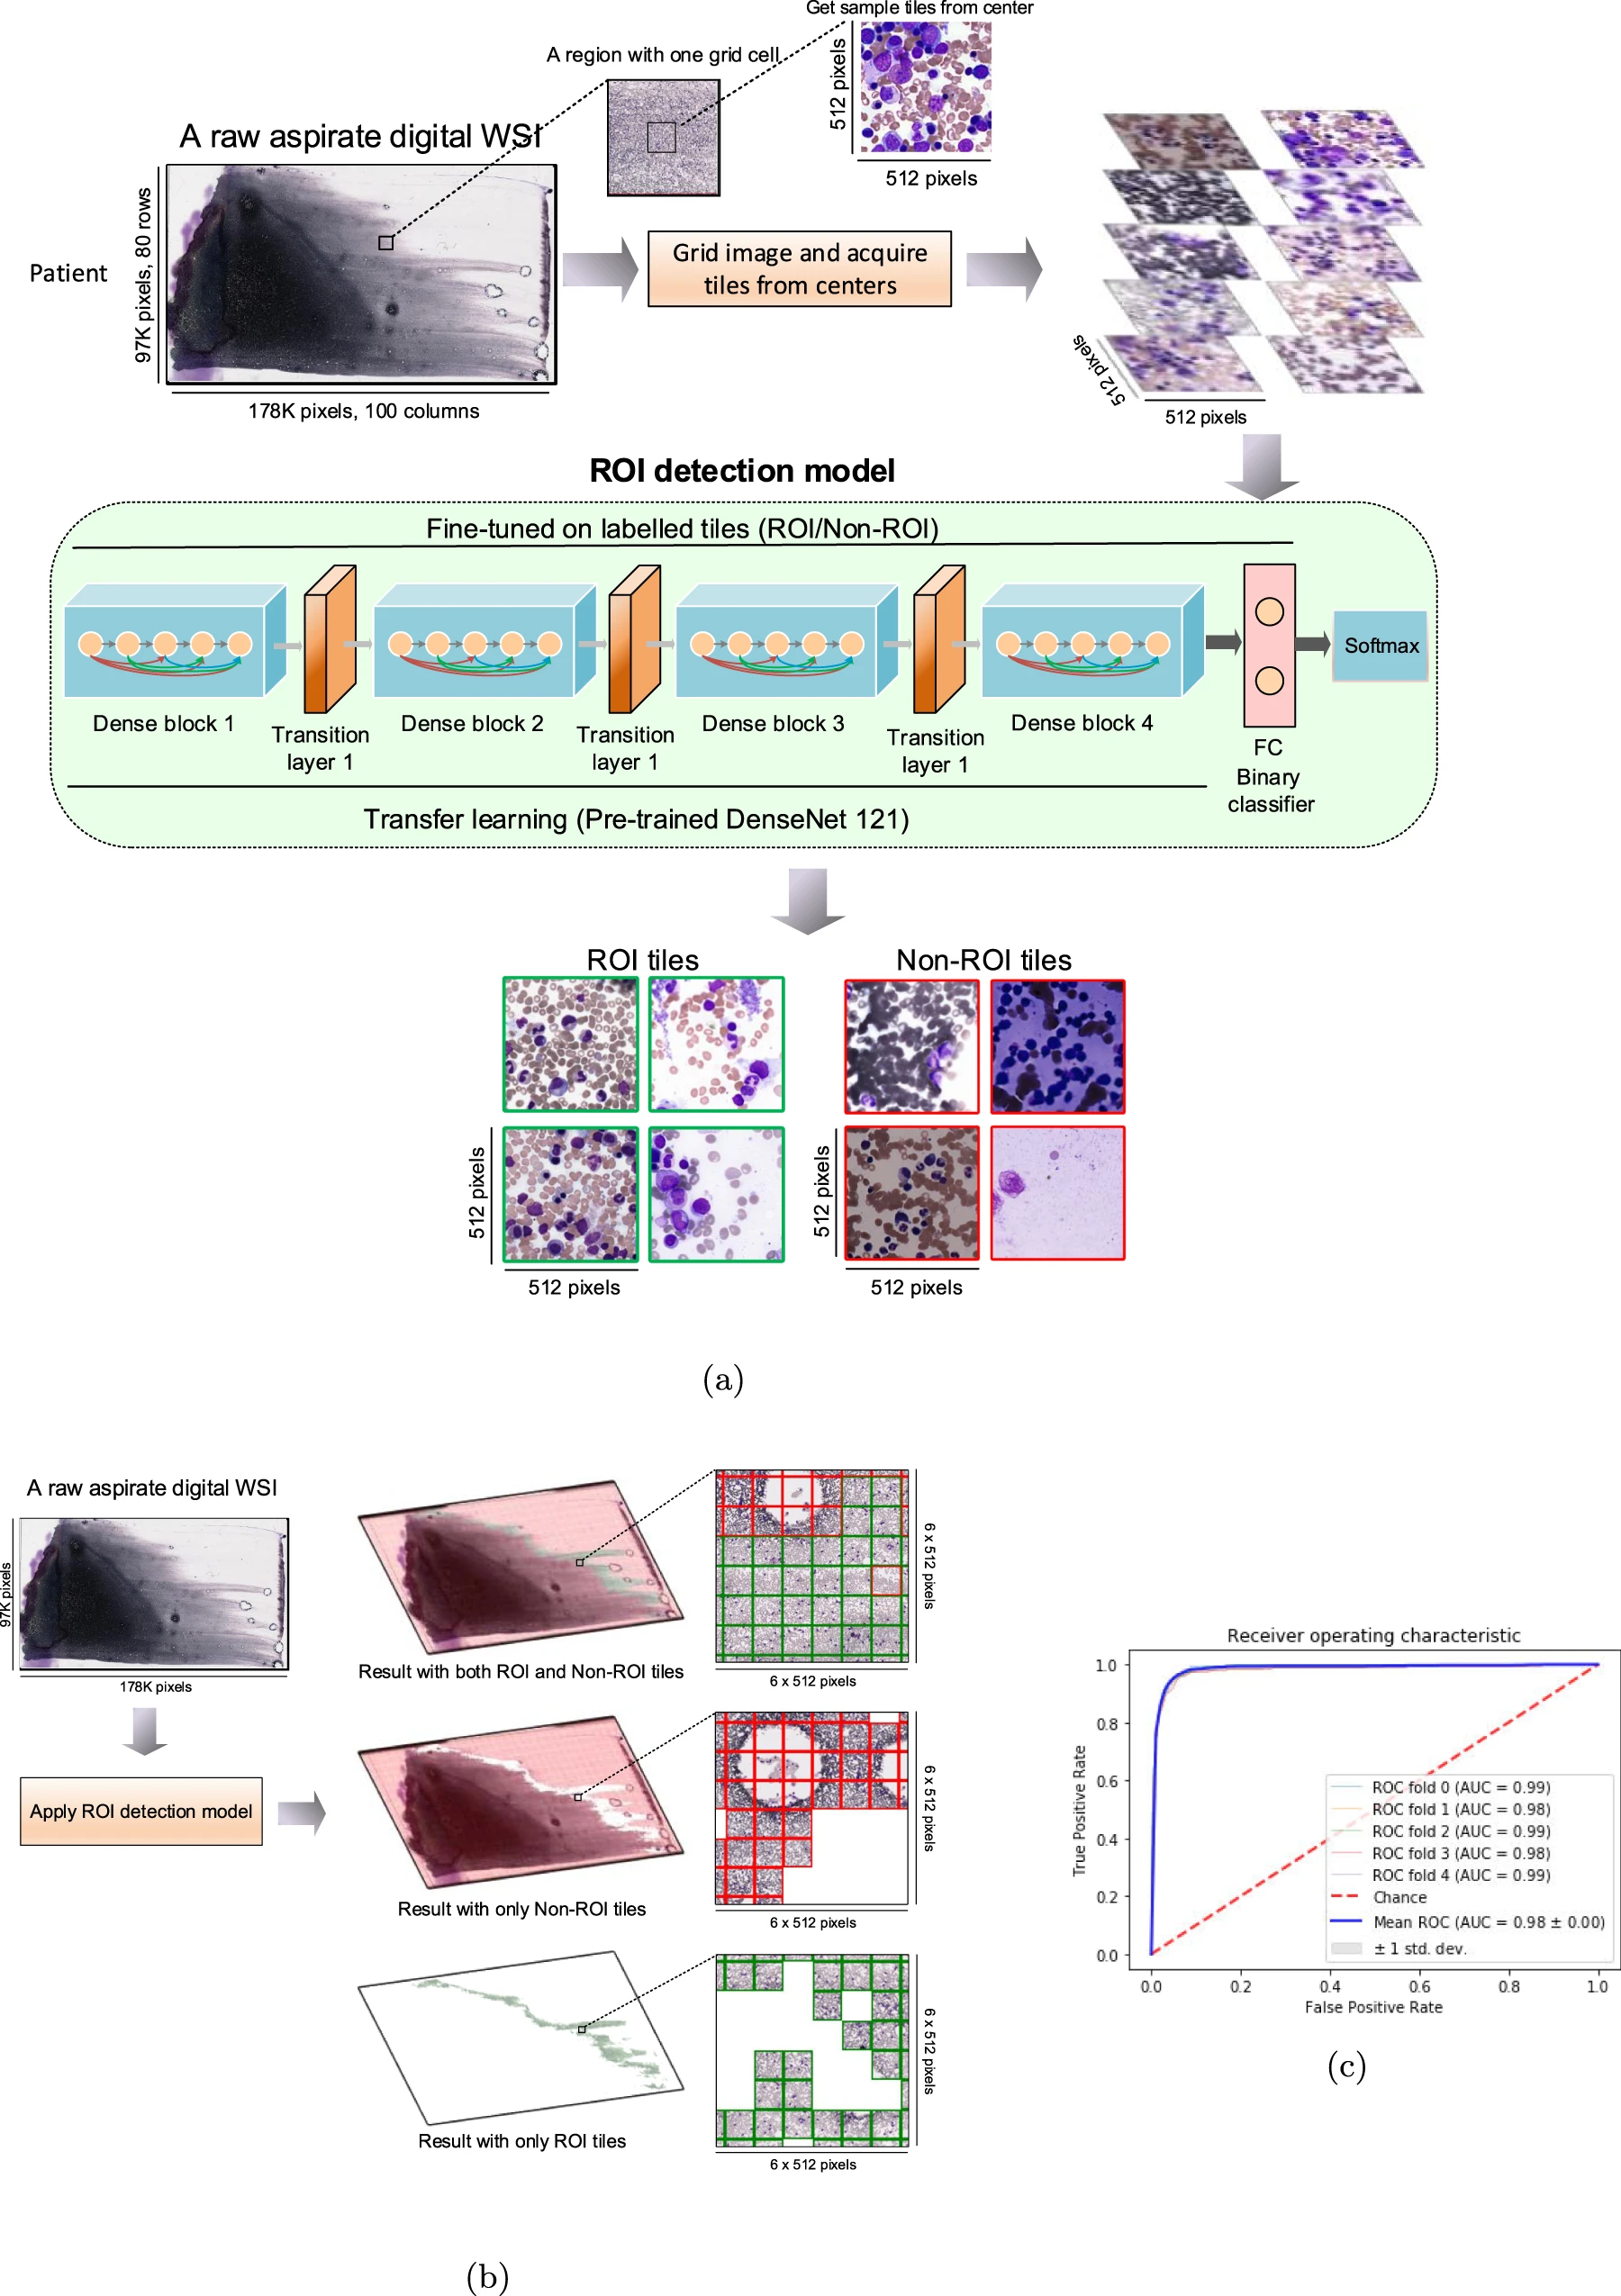
a Example of a raw aspirate whole-slide image (WSI), the tile grid to ensure all tiles have been sampled from the WSI evenly, the Region of Interest (ROI) detection model, and output examples of applying the model to separate appropriate tiles from inappropriate tiles. b Example of applying the ROI detection model to display the entire ROI and Non-ROI inside an aspirate WSI. c Mean Receiver Operating Characteristics (ROC) curve of the ROI detection model. All the results are aggregated over all 5-folds.
