
Abstract
Over time, cells in the brain and in the body accumulate damage, which contributes to the ageing process1. In the human brain, the prefrontal cortex undergoes age-related changes that can affect cognitive functioning later in life2. Here, using single-nucleus RNA sequencing (snRNA-seq), single-cell whole-genome sequencing (scWGS) and spatial transcriptomics, we identify gene-expression and genomic changes in the human prefrontal cortex across lifespan, from infancy to centenarian. snRNA-seq identified infant-specific cell clusters enriched for the expression of neurodevelopmental genes, as well as an age-associated common downregulation of cell-essential homeostatic genes that function in ribosomes, transport and metabolism across cell types. Conversely, the expression of neuron-specific genes generally remains stable throughout life. These findings were validated with spatial transcriptomics. scWGS identified two age-associated mutational signatures that correlate with gene transcription and gene repression, respectively, and revealed gene length- and expression-level-dependent rates of somatic mutation in neurons that correlate with the transcriptomic landscape of the aged human brain. Our results provide insight into crucial aspects of human brain development and ageing, and shed light on transcriptomic and genomic dynamics.
Main
Bulk RNA-sequencing studies of ageing have revealed disruptions to essential cellular processes such as transcription, translation and growth-factor signalling3, with processes involved in mitochondrial function, neuronal activity and DNA damage being dysregulated in the ageing brain2,4. Cell-type-specific changes during ageing are obscured in bulk analyses and are poorly understood. This represents a major knowledge gap in the human brain, in which molecularly distinct cell types perform specific functions throughout life. The advent of single-cell genomics has allowed high-resolution analysis of both DNA and RNA. scWGS and other techniques have shown that somatic mutations accumulate in human neurons during ageing and in age-related diseases, raising the possibility that such variants contribute to transcriptional dysregulation and the concomitant increased susceptibility to dysfunction and disease that accompanies advanced age5,6,7,8,9,10. Single-cell RNA sequencing and snRNA-seq have refined the understanding of brain cell states11,12,13,14, and have been used to identify age-related and disease-related changes in several organs15, including the human brain16,17. Despite this progress, our understanding of the transcriptional and genomic changes associated with healthy ageing—which might lay the groundwork for certain brain diseases—remains incomplete.
Here, to begin to capture the dynamics of human brain ageing in a cell-type-specific manner, we generated droplet-based snRNA-seq and scWGS libraries of fresh-frozen human prefrontal cortex (PFC) (Fig. 1a) from 19 neurotypical donors ranging in age from infant to centenarian (Table 1 and Supplementary Table 1). As orthogonal validation of our snRNA-seq results, we performed multiplexed error-robust fluorescent in situ hybridization (MERFISH), a quantitative spatial-transcriptomic technique with single-molecule resolution, on a subset of donors. In the snRNA-seq experiments, 367,317 nuclei remained after quality control and artefact filtering18, with a mean of 19,332 per donor (Supplementary Fig. 1), and dimensionality reduction and hierarchical clustering yielded 31 clusters (Fig. 1b). We annotated these clusters using a previously published human PFC dataset19 as a reference (Fig. 1c and Supplementary Table 2), and identified clusters of excitatory neurons from various cortical layers, four subtypes of inhibitory neurons (IN-PV, IN-SST, IN-SV2C and IN-VIP), microglia, oligodendrocytes, oligodendrocyte precursor cells (OPCs), astrocytes and endothelial cells. The expression of canonical marker genes for each cell type was cluster-specific (Supplementary Fig. 2). Within these broad classes, we identified subclasses of cells that, despite their similarity, populated distinct clusters (Fig. 1b). On average, excitatory neurons expressed more than twice as many genes as did glial and endothelial cells (Fig. 1d).
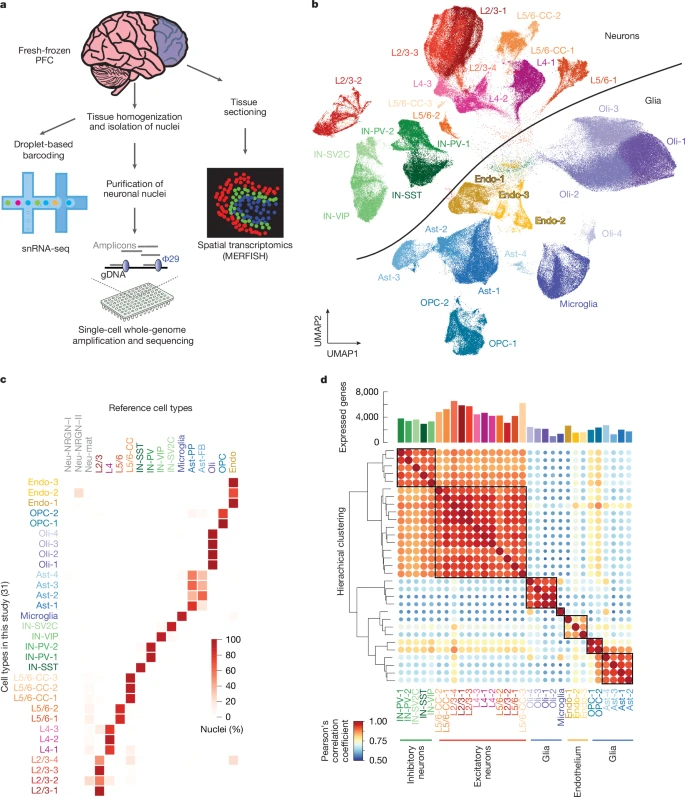
a, Overall study design. Human PFC was analysed by three single-cell genomic techniques in parallel. b, Dimensional reduction and clustering of all snRNA-seq nuclei after filtration yielded several clusters for each cell type (Ast, astrocyte; CC, cortico-cortico; Endo, endothelial; L, layer; Oli, oligodendrocyte; UMAP, uniform manifold approximation and projection). c, Percentage of nuclei in each cluster of our data that correspond to the annotated reference cluster. d, Gene-expression profiles for each subcluster within a cell type correspond most closely to the cells of the same lineage based on Pearson’s correlation coefficient. The bar plot above the heat map shows the number of genes expressed in each cluster.
Brain cell-type proportions during life
We detected no difference in the overall ratios of neurons to glia or excitatory neurons to inhibitory neurons. In addition, we did not observe the loss of any neuron subtype during non-pathological ageing, nor did we see evidence of the expansion of reactive microglia in the elderly (aged >65 years) brain (Extended Data Fig. 1 and Supplementary Table 3). However, we did identify subclusters of neurons and astrocytes that were composed exclusively or nearly exclusively of nuclei from infant donors (Fig. 2a). As a whole, the infant-specific neuron cluster resembled L2/3 neurons, but closer examination identified groups of cells in this cluster expressing markers of L4 or L5/6 neurons (Extended Data Fig. 2), and revealed that genes involved in development and neuron migration (Fig. 2b), such as SLIT3 and ROBO1, were also expressed in this group (Supplementary Tables 4 and 5). An analysis of MERFISH data generated using the Ultra platform from a subset of four donors (a 0.4-year-old male individual, a 15-year-old female individual, a 28-year-old male individual and a 57-year-old male individual) showed that infant neurons mostly exhibited correct laminar positioning, with CUX2+ L2/3 neurons, RORB+ L4 neurons and HS3ST4+ L5/6 neurons20 showing similar distributions across donors (Fig. 2c,d and Extended Data Fig. 3). HS3ST4 also seems to mark white-matter neurons in all donors, similar to TLE4, a canonical L5/6 marker21. These data suggest that cluster L2/3-2 represents immature excitatory neurons that populate the various layers of the infant neocortex. Infant-specific astrocytes expressed neurodevelopmental genes that mark immature astrocytes; for example, HES5, ID4, MFGE8 and DCC (refs. 22,23,24) (Fig. 2b, Supplementary Tables 4 and 5). Our reanalysis of a published snRNA-seq dataset of human PFC examining fetal development through adulthood25 confirmed the patterns of down- and upregulated genes that we observed in infant neurons and astrocytes (Extended Data Fig. 4 and Supplementary Fig. 3).
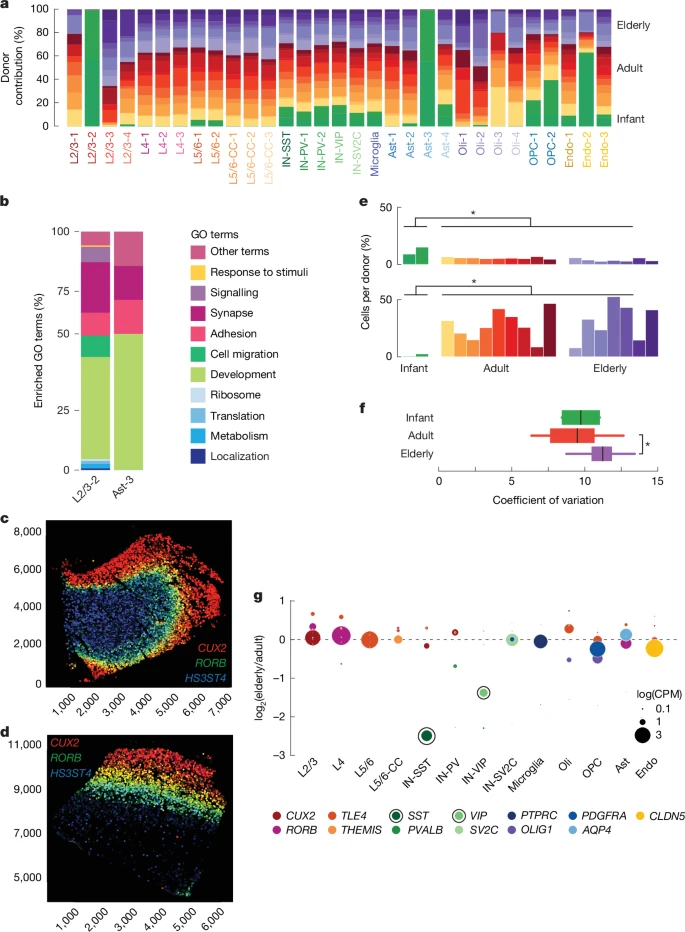
a, Clusters plotted by donor contribution as a percentage of total cells in the cluster. L2/3-2 and Ast-3 are composed nearly completely of nuclei from infant donors. b, GO terms derived from differentially expressed genes upregulated in infant-specific clusters plotted as general categories (see Supplementary Table 5 for a full list of terms and category designations). Development-related terms (shades of green) are most common. c,d, MERFISH section from a 0.4-year-old male donor (c) and a 15-year-old female donor (d), showing correct laminar positioning. Circles correspond to excitatory neurons and are coloured according to marker-gene expression (red, CUX2 (L2/3); green, RORB (L4); blue, HS3ST4 (L5/6); yellow, CUX2 and RORB co-expression; teal, RORB and HS3ST4 co-expression). x- and y-axis values reflect pixel positions e, Contribution of OPCs (top) and oligodendrocytes (bottom) to the total nuclei identified in each donor (*P < 0.05). f, Transcriptional variability in IN-SST neurons. Variability significantly increases in neurons from elderly donors. Box plots depict median and first and third quartiles. Whiskers show 1.5 times the interquartile range (IQR) beyond the first and third quartiles (P = 4.30 × 10⁻², two-sided Wilcoxon rank-sum test; elderly n = 7, adult n = 9). g, Log2(elderly/adult) fold change plotted for each marker gene. Dot size corresponds to expression in each cell type. Dots circled in black have statistically significant fold changes, meeting our criteria for differential expression.
The abundance of OPCs decreased during ageing (P = 1.31 × 10⁻², Wilcoxon rank-sum test), being highest in infant donors and decreasing over lifespan (Fig. 2e), whereas mature oligodendrocytes increased during ageing in the brain (P = 1.31 × 10⁻², Wilcoxon rank-sum test comparing infant with adult and elderly). These data suggest that the pool of OPCs differentiates into mature oligodendrocytes during life with incomplete replacement; thus, the capacity to generate new oligodendrocytes might diminish in elderly people.
Increased cell-to-cell transcriptional variability during ageing has been identified in non-brain tissues26,27,28, and is thought to be a consequence of ageing-related disruptions to the genome, epigenome and transcriptome. In our data, we detected only one cell type—IN-SST neurons—with a significant increase in the coefficient of variation in the transcriptome in elderly brains (Fig. 2f; P = 4.30 × 10⁻², Wilcoxon rank-sum test). We observed similar trends when analysing our cohort in three age groups (15–39, 40–69 and 70 and over; Supplementary Fig. 4). Furthermore, the expression of SST and VIP, which are markers of two distinct classes of inhibitory neurons, decreased significantly with age (fold changes of −2.63 and −1.46; corrected P values < 2.2 × 10⁻¹⁶) in elderly IN-SST and IN-VIP cells, respectively (Fig. 2g). The loss of these functionally important marker genes, combined with increased transcriptional variability, suggests that inhibitory neurons are changing in fundamental ways during ageing. A previous report described a decrease in IN-SST and IN-VIP inhibitory neurons during ageing in the human brain16. Although we did not detect this phenomenon (Extended Data Fig. 1c,d), our data are consistent with the notion that inhibitory signalling is compromised in the elderly brain.
Housekeeping genes decrease in ageing
Differential expression analysis by cell type, comparing the 7 elderly cases with the 10 adult cases, yielded 2,803 genes that changed significantly with age (log2(elderly/adult) > 0.5, corrected P < 0.05) (Fig. 3a and Supplementary Table 6). We obtained similar results when our cohort was binned into three groups, or when using an alternate linear model method (Extended Data Fig. 5 and Supplementary Table 7). Reanalysis of published data from control donors spanning 38–93 years of age29, and from a cohort of elderly donors30, confirmed our results (Extended Data Fig. 5). In every cell type, more genes were downregulated during ageing than upregulated (Wilcoxon signed-rank test, P = 2.44 × 10⁻⁴), and most downregulated genes were identified in neurons. L2/3 excitatory neurons had the most up- and downregulated genes (201 and 1,273 respectively) of all cell types. A total of 124 genes that were downregulated in ageing were commonly downregulated across multiple cell types (Fig. 3b and Supplementary Table 8), reflecting an increase relative to random chance (P < 0.001, random permutation test). For example, the heat-shock protein HSPA8, the cytoskeletal protein TUBA1A and eight other genes were significantly downregulated in all 13 brain-cell types during ageing. Other commonly downregulated genes across cell types included other cytoskeletal genes such as TUBB3 (down in 12/13 cell types), TUBA4A (10/13) and TUBB (9/13); the calmodulin genes CALM2 and CALM3 (9/13 and 12/13, respectively); and the vesicle protein VAMP2 (13/13). By contrast, only two transcripts—the antisense transcript of UBA6, a ubiquitin-modifying enzyme, and TMTC1, an endoplasmic-reticulum protein involved in calcium homeostasis—were commonly upregulated in multiple types of neuron and glia.
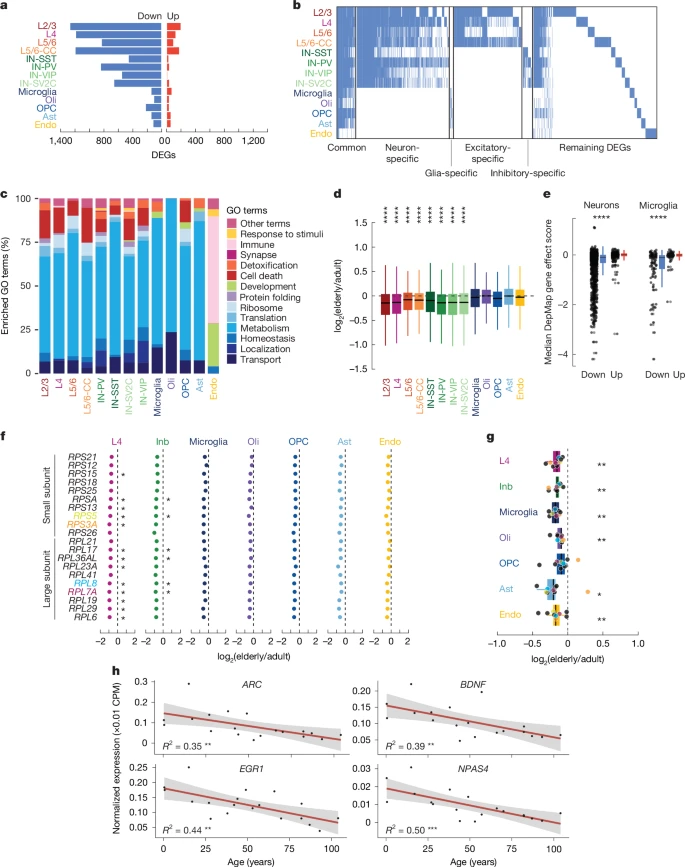
a, Number of downregulated (blue) and upregulated (red) genes for each cell type in elderly donors. DEGs, differentially expressed genes. b, Heat map of significantly downregulated differentially expressed genes in elderly donors. Genes not differentially expressed are in white. The leftmost genes are defined as common across cell types (down in one or more excitatory, one or more inhibitory and two or more non-neuronal cell types). c, GO terms of genes downregulated in ageing plotted as general categories (see Supplementary Table 8 for full GO results). Housekeeping functions (shades of blue) are commonly downregulated. d, Housekeeping genes are significantly downregulated in elderly relative to adult brains in all neuron types. Boxes show median, first and third quartiles. Whiskers show 1.5 × IQR beyond the first and third quartiles (****P < 0.0001 and fold change < −0.05, two-sided Wilcoxon rank-sum test; elderly n = 7, adult n = 9). e, Mean gene effect score for all of the downregulated (blue) and upregulated (red) genes (in elderly versus adult donors) in the DepMap database. The downregulated genes for both neurons (left) and microglia (right) are more essential than the upregulated genes (two-sided t-test; neurons down n = 1,954, neurons up n = 455, microglia down n = 149, microglia up n = 75; neurons ****P = 7.33 × 10⁻⁷, microglia ****P = 9.09 × 10⁻⁷). Boxes and whiskers as in d. Points beyond whiskers are outliers. f,g, Fold change in elderly versus adult ribosomal-protein genes from both the small and the large subunit by snRNA-seq (two-sided t-test; elderly n = 7, adult n = 9) (f) and MERFISH (two-sided Wilcoxon rank-sum test; elderly n = 3, adult n = 3) (g). Inb, inhibitory. Genes shown in both f and g are colour-coded. Boxes and whiskers as in e. h, Expression of immediate early genes in excitatory neurons decreases with age. Grey shading, 95% confidence intervals. All data points shown (*P < 0.05, **P < 0.01, ***P < 0.001).
A common feature seen across cell types in the ageing brain was the widespread downregulation of ‘housekeeping’ genes. Indeed, gene ontology (GO) analysis of downregulated genes yielded common terms across all cell types except endothelial cells (Fig. 3c and Supplementary Table 9). This result was robust to evenly down-sampling lists of differentially expressed genes across cell types (Supplementary Table 10). In non-endothelial cells, terms related to housekeeping functions such as translation, metabolism, homeostasis, ribosomes, intracellular localization and intracellular transport were significantly enriched in the downregulated genes. To assess the expression changes of genes with common cellular functions further and in an unbiased manner, we defined a set of housekeeping genes in our dataset as those genes that were stably expressed in all brain cell types (average log(counts per million (CPM)) > 0.1 in each cell type and with differences of less than 0.1 between cell types), including endothelial cells and microglia that derive from a distinct embryological origin from that of neurons and other glia (Supplementary Table 11), and measured their changes in expression during ageing (Supplementary Fig. 5a). By the same logic, we defined neuron-specific genes as those detected in all neuron subtypes but absent in non-neuronal cells (Supplementary Table 11). Expression of these housekeeping genes decreased in elderly relative to adult neurons across subtypes (Fig. 3d). By contrast, neuron-specific genes did not decrease in neurons during ageing (Supplementary Fig. 5b). Thus, neurons lose the expression of genes related to general cell function, but maintain cell identity in the ageing brain.
The DepMap database scores gene essentiality on the basis of survival rates after knockout in hundreds of cancer cell lines. Using DepMap, we found that genes that were downregulated with age in neurons and microglia were more often essential for cell survival than were genes that were upregulated (neurons: P = 7.33 × 10⁻⁷; microglia: P = 9.09 × 10⁻⁷, two-sided t-test) (Fig. 3e and Supplementary Table 11), suggesting that genes that are downregulated in ageing reduce brain-cell viability.
RPS3A, RPL26 and RPL15 (all encoding ribosomal proteins) were significantly downregulated during ageing in 11 out of 13 cell types (Supplementary Table 8), and 14 other ribosomal-protein genes were commonly downregulated. This prompted us to examine the expression level of all ribosomal genes. We observed a near-universal trend of a decrease in the expression of genes encoding the small and large ribosomal subunits during ageing—much more than would be expected by chance (P values < 3.76 × 10⁻⁶; Fisher’s exact test) (Fig. 3f and Supplementary Fig. 6). To validate this finding, we performed MERFISH experiments on three elderly brains (82 years (male), 82 years (female) and 87 years (male)) and three adult brains (28 years (male), 42 years (female) and 49 years (female)). Our results showed that across cell types, the expression of nine ribosomal proteins decreased in elderly brains, with significant decreases in all but OPCs (Fig. 3g, Extended Data Fig. 6 and Supplementary Table 11). Nuclear-encoded proteins of the mitochondrial electron transport chain, except for complex II genes, also showed coordinated downregulation by both snRNA-seq and MERFISH (Extended Data Fig. 6d,e and Supplementary Fig. 7). Analysis of our snRNA-seq cohort in three age groups instead of two indicates that both ribosomal and mitochondrial genes decrease significantly after the age of 40 years, with donors aged 40–69 years showing similar expression of these genes to that of donors aged 70–104 years (Extended Data Fig. 7). These data suggest that neurons become less metabolically active during life. Along these lines, the expression of immediate early genes, which are activated rapidly during neuronal stimulation31, decreases during brain ageing (Fig. 3h).
Mutation patterns reflect transcription
Somatic mutations accumulate in cells during life for many cell types throughout the human body9,32,33,34,35, including in post-mitotic neurons of the human brain6,8,9. Neuronal rates of somatic mutation correlate with transcription as measured by bulk RNA-seq in the brain5,6,7,9, suggesting that somatic mutations can affect important brain gene-regulatory programs. Mutational signature analysis has implicated the activity of several DNA-repair genes in generating somatic mutations in neurons5,7,10. Thus, both the upstream causes and downstream effects of single-cell somatic mutations can be studied using single-cell gene expression.
To link changes in the neuronal transcriptome to changes in the somatic mutation burden of individual neurons, we performed scWGS using primary template-directed amplification (PTA)7,36 on neurons from the same brain region and donors analysed by snRNA-seq (Supplementary Table 12). We used the SCAN2 algorithm6 to identify somatic single-nucleotide variants (sSNVs) in scWGS data from each sample (Supplementary Table 13). In agreement with previous reports6,7,9, our analysis suggested that sSNVs accumulate at a rate of 15.1 per neuron per year (R2 = 0.87, P = 2.20 × 10⁻¹⁶) (Extended Data Fig. 8a). The overall pattern of mutations resembles a known signature called SBS5 (cosine similarity 0.96), first identified by the Catalogue Of Somatic Mutations In Cancer (COSMIC) consortium, which accumulates during life across many tissues37 (Extended Data Fig. 8b,c).
We compared the changes in neuronal gene expression with the age-related patterns of somatic mutation in neurons to investigate the relationships between the genome and the transcriptome in ageing. We found that the overall, SBS5-like spectrum of neuron sSNVs was composed of two distinct signatures, which we name A1 and A2 (Fig. 4a, Supplementary Fig. 8 and Extended Data Fig. 8c). Signature A1 resembled SBS5 (cosine similarity 0.88), and correlated strongly with the age of the donor (R2 = 0.88, P = 3.30 × 10−50) (Fig. 4b), accounting for 12.1 of the 15.1 mutations per year. The burden of signature A1 also correlated strongly with neuronal gene-expression levels (Fig. 4c and Supplementary Fig. 8; chi-squared test), demonstrating that transcription in neurons sensitizes some loci to specific types of somatic mutation. In line with this, significant transcriptional strand bias in sSNVs, which is thought to result from asymmetrical damage and repair rates on template and non-template strands at transcribed loci38, was observed in medium to highly expressed genes but not in genes expressed at low levels (Fig. 4d; asterisks denote significant deviations from 50:50). Furthermore, signature A1 was enriched in active chromatin states in the human brain at active transcription start sites (TSSs), enhancers, bivalent TSSs and weakly repressed polycomb sites, but depleted at quiescent and weakly transcribed loci (Fig. 4g and Supplementary Table 14; chi-squared test).
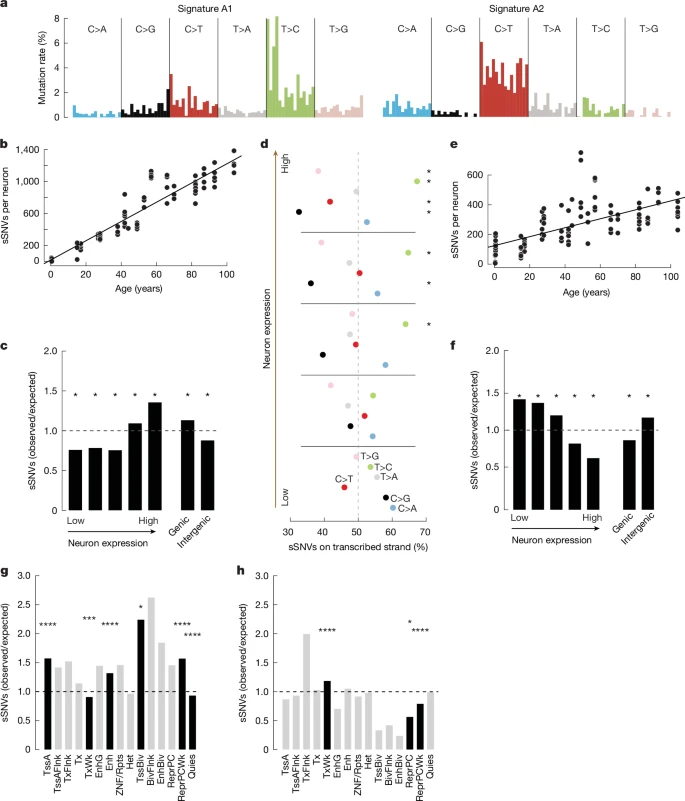
a, De novo mutational signature analysis of sSNVs in human neurons revealed two signatures: A1 dominated by T>C mutations and A2 dominated by C>T mutations. Trinucleotide contexts are the same as shown in Extended Data Fig. 6c. b, Number of signature A1 sSNVs in each neuron plotted by age. Signature A1 strongly correlates with age (R2 = 0.88, P = 3.30 × 10−50) with an extrapolated mutation rate of 12.1 SNVs per year. c, sSNV enrichment of signature A1 in coding regions plotted by neuron expression quantile (left) and genic versus intergenic regions (right). Signature A1 is enriched in the highest-expressed genes and genic regions (chi-squared test). d, Percentage of total sSNVs derived from the transcribed strand broken down by expression quantile. T>C and C>T strand bias increases with expression (chi-squared test; *multiple-testing-corrected false discovery rate (FDR) < 0.05; **multiple-testing-corrected FDR < 0.01). e, Number of signature A2 sSNVs in each neuron plotted by age. Signature A2 correlates with age (R2 = 0.42, P = 6.60 × 10⁻¹⁴) with an extrapolated mutation rate of 3 SNVs per year. f, sSNV enrichment of signature A2 in coding regions plotted by neuron expression quantile (left) and genic versus intergenic regions (right). Signature A2 is depleted in the highest-expressed genes and enriched in the lowest-expressed genes as well as intergenic regions (*P < 0.05, chi-squared test). g,h, Mutation enrichment in human brain chromatin states for signature A1 (g) and signature A2 (h) (chi-squared test; *P < 0.05, ***P < 0.001, ****P < 0.0001). TssA, active TSS; TssAFlnk, flanking active TSS; TxFlnk, transcription at gene 5′ and 3′; Tx, strong transcription; TxWk, weak transcription; EnhG, genic enhancers; Enh, enhancers; ZNF/Rpts, ZNF genes and repeats; Het, heterochromatin; TssBiv, bivalent or poised TSS; BivFlnk, flanking bivalent TSS or enhancer; EnhBiv, bivalent enhancer; ReprPC, repressed polycomb; ReprPCWk, weak repressed polycomb; Quies, quiescent or low expression.
Signature A2 accounted for fewer age-related mutations per year (3; R2 = 0.42, P = 6.60 × 10⁻¹⁴), and most sSNVs in infant neurons were derived from signature A2 (Fig. 4b,e and Supplementary Table 13). Signature A2 showed high similarity to developmental mosaic mutations identified in three separate studies that used orthogonal methods to scWGS39,40,41 (cosine similarity 0.77, 0.81 and 0.83; Extended Data Fig. 9a). The sSNVs identified in our infant donors were also similar to those confirmed developmental mosaics (cosine similarity 0.82, 0.85 and 0.88, Extended Data Fig. 9a). Signature A2 clustered with COSMIC signature SBS30 (cosine similarity 0.82) (Extended Data Fig. 8c). Signature A2 mutation rates anticorrelate with neuron gene-expression levels and are enriched in intergenic regions (Fig. 4f), in agreement with trends observed for SBS30 (COSMIC database). In accordance with its enrichment in genes expressed at low levels, signature A2 is enriched in the human brain in chromatin states found at sites of weak transcription, and is depleted at repressed and weakly repressed polycomb sites (Fig. 4h and Supplementary Table 14; chi-squared test).
Nevertheless, signature A2 differs from SBS30 in some key ways. SBS30 comprises C>T variants almost exclusively, and these variants are depleted at CpG dinucleotides (Extended Data Fig. 9c). By contrast, signature A2 contains substitutions in addition to C>T, such as C>A, which we previously linked to increased oxidative DNA damage during ageing, and T>C, which increases with age7,8. Similarly to confirmed developmental clonal mosaic mutations identified in other studies using non-scWGS methods39,40,41, signature A2 shows contributions of SBS1 and SBS5 in addition to SBS30 (Extended Data Fig. 9b). Signature A2 shows higher CpG>TpG variants than does SBS30, suggesting that deamination of methylated cytosines has a role in the genesis of signature A2, as it does in confirmed mosaics (Extended Data Fig. 9c). A high burden of C>T at CpG dinucleotides distinguishes biological from technical mutational signatures in single-cell genomics7,42.
The differences observed between signatures A1 and A2 with respect to their rate of accumulation per year, their differential correlation with neuron gene expression, their distinct relative burden in genic versus non-genic regions and their differential correlation with brain chromatin states support the notion that these signatures represent biologically distinct components of the overall, SBS5-like mutation spectrum observed in single human neurons. Signature A1 is the predominant source of age-related SNVs in neurons and correlates with neuron gene expression, confirming that transcription directly determines the neuronal sSNV rate. Signature A2 seems to be more active in development and early life, but signature A2 mutations continue to accumulate during ageing, at transcriptionally inactive loci.
Gene length, transcription and mutation in ageing
Somatic mutations arise from DNA damage that occurs through a variety of mechanisms. Long genes are downregulated in ageing across many organs—an effect that is attributed to their naturally increased likelihood of acquiring transcription-blocking DNA damage owing to random chance43,44,45. We find that sSNV rates correlate with neuronal gene expression6,7 (Fig. 4c), suggesting that transcription and DNA damage are linked. How gene length and expression level relate to transcriptional changes in ageing, and whether differences in somatic mutation patterns based on gene size or transcription correlate age-associated changes, are unknown.
To investigate the effects of gene length and expression level on transcriptional changes in ageing, we performed a multiple linear regression analysis. We found that high basal expression predicts decreased expression in aged donors (Fig. 5a, Supplementary Fig. 9a and Supplementary Table 15). We confirmed this relationship using bulk brain expression data from the GTEx consortium. However, a more robust effect was observed for gene size. There was a positive correlation between gene length and expression in elderly neurons compared with adult neurons. In other words, longer genes are more likely to maintain or increase their expression during ageing, and, unlike in other organs, downregulated genes in neurons are more likely to be short. A significant but lower magnitude effect was also observed for exon length and expression, suggesting that this effect was driven mostly by gene length, not transcript length. This length effect was stronger in excitatory and inhibitory neurons (R = 0.59 and 0.57, respectively) than in glia (average R = 0.35), and downregulated genes in neurons were shorter than those in glia (Fig. 5b), highlighting a cell-type-specific effect. Although in opposition to the relationship observed in many tissues, our data agree with data from the mouse frontal cortex45 and bulk-sorted retinal ganglion cells, in which long gene expression is preserved during ageing45.
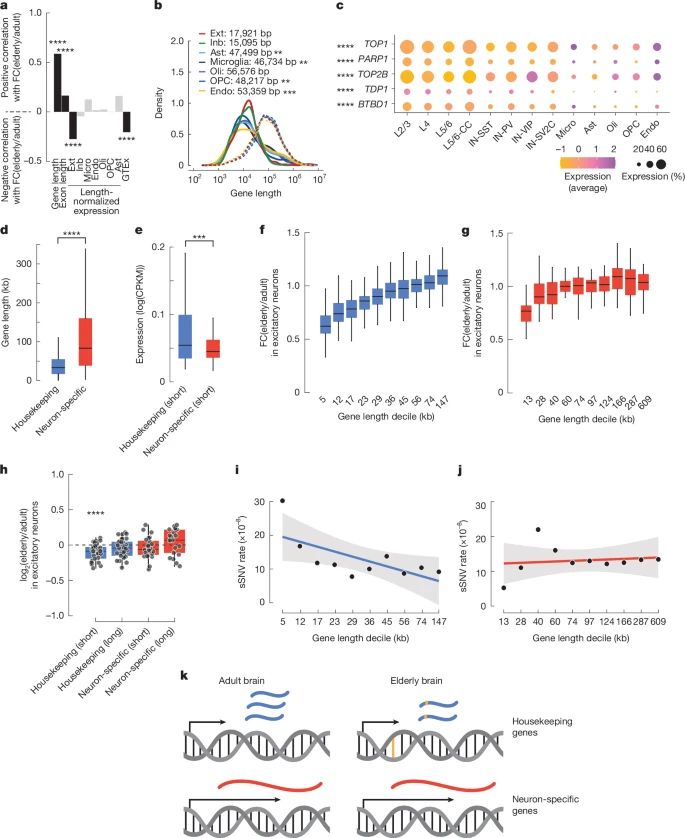
a, Mixed-effects linear model identifying determinants of downregulation in excitatory neurons (model performance R2 = 0.54). Gene and exon length positively correlated with ageing-related fold change (FC) in expression. Length-normalized expression in excitatory neurons and frontal cortex expression (GTEx database) negatively correlated with ageing-related fold change. Significance of linear model correlations was determined by two-sided t-test. b, Density plots of the length of downregulated genes (solid lines) and all expressed genes (dashed lines) for each cell type. Mean lengths for downregulated genes are shown; asterisks denote significant differences from the mean neuronal downregulated length (two-sided t-test). c, Expression of topoisomerase complex genes across cell types. Asterisks denote significant differences in the percentage of cells expressing between neurons and non-neurons (two-sided Wilcoxon rank-sum test). d, Housekeeping genes (n = 1,802) are significantly shorter than neuron-specific genes (n = 288) (P = 2.2 × 10⁻¹⁶, two-sided t-test). e, Short (decile 1) housekeeping (n = 180) and neuron-specific (n = 28) genes showed differential expression in adult excitatory neurons (P = 6.5 × 10⁻⁴, two-sided t-test). CPKM, counts per kilobase per million. f,g, Fold change (elderly/adult) of housekeeping genes (f) and neuron-specific genes (g) by length decile in excitatory neurons (housekeeping R2 = 0.50, P = 1.35 × 10−281; neuron-specific R2 = 0.20, P = 1.24 × 10⁻³; elderly n = 7, adult n = 9). h, Fold change in the expression of the indicated gene sets in excitatory neurons, from MERFISH data (P = 3.4 × 10⁻⁵, two-sided Wilcoxon rank-sum test; elderly n = 3, adult n = 3). i,j, The sSNV rate per base pair negatively correlates with gene length in housekeeping genes (R2 = 0.44, P = 3.52 × 10⁻², Pearson’s correlation) (i), but not in neuron-specific genes (R2 = 0.02) (j). Simple linear model trend line with grey 95% confidence intervals shown. k, The relationship between gene length (black arrow), mRNA expression (blue and red), and mutations (yellow) identified in this work. *P < 0.05, **P < 0.01, ***P < 0.001, ****P < 0.0001. All box plots depict median and first and third quartiles. Whiskers show 1.5 × IQR beyond the first and third quartiles.
A larger percentage of neurons than non-neurons expresses the topoisomerases TOP1 and TOP2B, and the topoisomerase interactors PARP1, TDP1 and BTBD1(P = 8.17 × 10⁻⁵; Wilcoxon rank-sum test) (Fig. 5c). Neurons rely on topoisomerase activity to mitigate the torsional stress generated when unwinding neuronal genes during transcription46, which tend to be longer than broadly expressed housekeeping genes47 (Fig. 5d), suggesting that high topoisomerase expression protects long genes in neurons.
Our multiple linear regression model results are in general agreement with the results from GO analysis that suggested that housekeeping genes are downregulated in ageing (Fig. 3c), because housekeeping genes are generally short (Fig. 5d) and highly expressed48,49,50 (Fig. 5e and Supplementary Fig. 9b,c).
Our combined single-cell genomic and transcriptomic dataset allowed us to probe the relationship between gene size, genome damage and age-related expression changes in depth at the single-neuron level. Because gene length and gene function are related in the brain (neuronal genes tend to be long), we separately analysed the relationship between gene length and expression change during excitatory neuron ageing in neuron-specific genes and housekeeping genes. Housekeeping genes showed a positive correlation between gene length and expression change in ageing (R2 = 0.50, P = 1.35 × 10−281) (Fig. 5f and Supplementary Fig. 10), such that the shortest genes were the most downregulated, whereas the longest showed no change or slightly increased in aged cells. This pattern resembled the downregulation of short genes observed in the overall transcriptome (Fig. 5b). However, across neuron-specific genes, there was a significantly weaker relationship (Fisher’s r-to-z transformation, P = 2.08 × 10⁻¹¹) between gene length and expression change in aged brains (R2 = 0.20, P = 1.24 × 10⁻³) (Fig. 5g and Supplementary Fig. 11). These conclusions were validated by analyses of previously published datasets and by analysis of our data using different groupings or using a linear model method (Extended Data Fig. 10). MERFISH analysis of 33 short housekeeping genes, 33 long housekeeping genes, 24 short neuron-specific genes and 21 long neuron-specific genes confirmed the downregulation of short housekeeping genes in samples from elderly donors relative to samples from adult donors (P = 3.4 × 10⁻⁵, Wilcoxon rank-sum test), and did not identify any significant changes in long housekeeping genes or neuron-specific genes of either size (Fig. 5h).
Within gene classes, the sSNV rate mirrored changes in expression during ageing; in housekeeping genes, the sSNV rate decreased as gene length increased (R2 = 0.44, P = 3.52 × 10⁻²) (Fig. 5i and Supplementary Table 16), whereas in neuron-specific genes there was no significant relationship between gene length and SNV rate (R2 = 0.02, P = 0.706) (Fig. 5j and Supplementary Table 16). These data suggest that there are distinct patterns of DNA damage and repair in housekeeping and neuron-specific genes (Fig. 5k). Thus, gene length, gene function and genome damage combinatorially affect the transcriptome of the ageing brain.
Discussion
Here we used snRNA-seq, scWGS and spatial transcriptomics to study genomic and transcriptomic changes in the brain during life. We conclude that short, highly expressed housekeeping genes show high rates of sSNV accumulation during life that correlate with reduced expression. Several lines of evidence lead us to this conclusion. First, housekeeping functions were the most commonly enriched GO terms for downregulated genes, dominating the neurons in particular, whereas neuron-specific genes remained flat during ageing in general, with no significant changes in expression. Second, housekeeping genes were short and highly expressed, in agreement with previous literature. Third, sSNV rates in neurons correlated with neuron gene-expression levels. Indeed, the shortest housekeeping genes, which showed high levels of expression, showed the highest sSNV rates. Finally, a multiple linear regression model showed that high expression correlated with the likelihood of transcriptional downregulation in ageing, and that long gene length correlated with the maintenance or an increase of transcript levels in ageing. The relationship between gene length and the ageing transcriptome has been a point of curiosity in the field, but thus far, this association has varied across tissues43,44,45. Our analysis suggests that in neurons, long genes related to cell identity are preserved in ageing, whereas short housekeeping genes accumulate somatic mutations and decrease in abundance during life.
Several mechanisms could explain this relationship. First, mutations might directly generate premature stop codons or change patterns of RNA splicing, inducing nonsense-mediated decay of mutant transcripts. Second, aberrant DNA-repair processes involved in generating somatic mutations cause local epigenetic dysregulation51, affecting transcript levels. Third, differential repair of housekeeping and neuron-specific genes could have a role in differential sSNV burdens. Recently, single-stranded DNA lesions were shown to endure for long periods of time—up to years—in human cells, in the absence of active DNA repair52. sSNV rates might be high in short, highly expressed genes because they show preferential transcription-coupled DNA repair53,54,55, meaning that DNA damage that occurs during transcription56 might be efficiently made into permanent, double-stranded mutations owing to repair errors. Neurons might differ from cells in other organs because of their post-mitotic nature, or owing to the high expression of topoisomerase genes, which protect long genes.
Our work also defined other changes in the human brain during healthy life. In the infant brain, we identified populations of immature neurons and astrocytes, and an increased ratio of oligodendrocyte precursors to mature oligodendrocytes, in support of the notion that brain-cell development continues after birth. In agreement with previous work, scWGS showed that sSNVs with an overall spectrum resembling COSMIC SBS5 increased in ageing neurons. De novo signature analysis revealed two signatures, A1 and A2, dominated by T>C and C>T transitions, respectively, that clustered with known somatic mutational signatures in cancer, SBS5 and SBS30, respectively. The aetiology of SBS5 is unknown, but it has been reported to behave in a clock-like manner in brain and other tissues8,9,32,37. Signature A2 somewhat resembles SBS30 and contains C>A and T>C variants—mutation types that are linked with oxidative DNA damage and ageing, respectively. SBS30 has been linked with57 decreased activity of the base excision repair protein NTHL1, and our previous work linked neuron C>A variants to the base excision repair protein OGG1. Our snRNA-seq data revealed that both NTHL1and OGG1 were expressed in neurons, and that this expression was dynamic during ageing, but further studies are needed to link these changes to signature A2. We note that, despite the high similarity between signature A2 and SBS30, A2 in neurons is distinguished from this tumour signature by higher levels of C>T at CpG dinucleotides. Signature A1 was enriched in coding regions, highly expressed genes and known open chromatin sites, whereas A2 showed the opposite pattern, being enriched in non-coding regions, highest in repressed genes and enriched in loci bearing repressive chromatin marks.
As the application of scWGS technologies expands to include other cell types in the brain, it will become possible to further elucidate the relationship between somatic mutations and gene expression during ageing. This will increase researchers’ understanding of the genomic and transcriptomic landscape in the ageing brain.
Methods
Tissue procurement
All tissue was provided by the National Institutes of Health (NIH) NeuroBioBank and Banner Sun Health Research Institute Brain and Body Donation Program, which obtained written authorization and informed consent for all donors. Tissue collection and distribution for research purposes were done in accordance with protocols approved by the NIH NeuroBioBank (IRB protocol number: HM-HP-00042077) or the Human Brain and Spinal Fluid Resource Center (managed by the Sepulveda Research Corporation; IRB protocol number: PCC: 2015-060672, VA project number: 0002) and by the Banner Sun Health Research Institute Brain and Body Donation Program (WCG IRB protocol number 20120821). Tissue was collected from post-mortem, de-identified donors and thus this work is not considered by our Institutional Review Board to be research using human subjects. Cases were selected on the basis of RNA quality, age at time of death and absence of a history of neurological disease or evidence of neuropathology in the tissue. Brodmann area 9 or adjacent Brodmann area 46 of PFC was provided for each donor and used for both snRNA-seq and scWGS. To obtain the donor reference genomes, bulk DNA samples were collected from donor-matched tissues, which included heart, liver, muscle, cerebellum or cortex. Bulk DNA whole-genome sequencing (WGS) data for donors 1278, 4638, 1465, 4643, 5657 and 5817 (0.4-year-old male, 15-year-old female, 17-year-old male, 42-year-old female, 82-year-old male and 0.6-year-old male individuals, respectively) were obtained from previous studies8,58, along with bulk DNA WGS data for donor 5572 (70-year-old female individual)7.
Isolation of nuclei from fresh-frozen tissue samples
The nuclei isolation protocol was adapted from two previous publications59,60. All procedures were performed on ice or at 4 °C. Fresh-frozen samples were processed using a 7-ml glass Dounce homogenizer with approximately 20 mg tissue in 5 ml of filter-sterilized tissue lysis buffer (0.32 M sucrose, 5 mM CaCl2, 3 mM MgAc2, 0.1 mM EDTA, 10 mM Tris-HCl (pH 8), 0.1% Triton X-100 and 1 mM fresh DTT). The homogenized solution was loaded on top of a filter-sterilized sucrose cushion (1.8 M sucrose, 3 mM MgAc2, 10 mM Tris-HCl (pH 8) and 1 mM DTT) and spun in an ultracentrifuge in an SW28 rotor (13,300 rpm, 2 h, 4 °C) to separate nuclei.
For nuclei isolated for snRNA-seq, after spinning, the supernatant was removed and nuclei were resuspended (1% BSA in PBS plus 25 μl 40 U μl−1 RNAse inhibitor), then filtered through a 40-µm cell strainer. After filtration, nuclei were counted using trypan blue and an automated haemocytometer (Countess II; Invitrogen) and diluted to a concentration of 1,000 cells per µl.
For nuclei isolated for scWGS, the supernatant was removed and nuclear pellets were resuspended in ice-cold resuspension buffer (8.5 ml 1× PBS with 3 mM MgCl2 + 1 ml 1× PBS with 3 mM MgCl2 and 1% BSA + 500 µl sucrose cushion), filtered with a 40-µm cell strainer and then stained with an anti-NeuN antibody (directly conjugated to Alexa Fluor 488; Millipore MAB377X, clone A60; 1:1,250) and an anti-rabbit IgG Alexa Fluor 647 antibody as a negative control for 30 min. Using a BD Biosciences FACSAria Fusion machine and BD FACSDiva Software, forward scatter A (FSC-A) was first used to isolate large non-replicating cells. NeuN staining produced a bimodal signal distribution, distinguishing NeuN+ and NeuN− nuclei (Supplementary Fig. 13). Large neuronal nuclei, representing excitatory pyramidal neurons, were further identified by collecting the nuclei with the highest NeuN signal among the NeuN+ neuronal fraction, and gating for the population with the highest FSC-A signal and excluding Alexa-Fluor-647-high events7. This non-replicating high-FSC-A and high-NeuN population was confirmed to be an excitatory neuron population, comprising 2–5% of the total population of nuclei in each sample7.
Droplet-based snRNA-seq
Droplet-based libraries were generated using the Next GEM Single Cell 3′ v.3 or v.3.1 reagent kits (10x Genomics) and the Chromium Controller according to the manufacturer’s instructions. The resulting libraries were indexed with the KAPA Unique Dual-Indexed Adapter Kit (Roche KK8726) and sequenced on an Illumina NovaSeq 6000 with 150 paired-end reads by Genuity Science. Samples were prepared in batches of up to six donors at a time that always included male and female donors as well as mixed ages (Supplementary Table 3). To prevent age or gender bias in our batches, some samples have multiple biological replicates, prepared on different dates. A single replicate each from three distinct donors clustered abnormally during downstream analysis and was therefore excluded from analysis. After filtering, the only clusters exhibiting batch bias are those that are infant-specific and biologically driven (Supplementary Fig. 1). Because those cells were present only in infant donors, the only batches contributing to those clusters are those that included an infant.
In addition to data generated for this manuscript, we also included data that were previously published7: case 1465, a 17-year-old male individual. Single nuclei from the PFC were isolated by fluorescence-activated nuclear sorting using three gates (large NeuN+ nuclei, NeuN+ nuclei and DAPI+ nuclei) to generate three populations (large neurons, neurons and all nuclei). For each population, 16,000 nuclei were sorted into one well of a 96-well plate, which were then used to perform snRNA-seq using the Next GEM Single Cell 3′ GEM kit v.3.1 and the Chromium Controller (10x Genomics). The three resulting libraries were indexed using the 10x Genomics Dual Index Plate and sequenced on an Illumina NovaSeq S4. For our downstream differential expression analysis, all three populations were grouped together. Donor 1465 was excluded from analyses of cell-type proportion because the tissue had been subjected to fluorescence-activated cell sorting, which skewed the cell-type ratios.
scWGS of neurons using PTA
Single neuronal nuclei, prepared as described above, were whole-genome-amplified by PTA6,36 using the ResolveDNA Whole Genome Amplification kit (BioSkryb Genomics). First, nuclei were sorted into cold 96-well plates pre-loaded with 3 µl cold cell buffer (BioSkryb) one per well. Nuclei were lysed as per the kit protocol by the addition of 3 µl MS mix, followed by a brief spin-down, then 1 min of agitation at room temperature at 1,400 rpm on a plate mixer, then 10 min on ice. Next, 3 μl SN1 buffer was added to each well and the plate was again spun down and agitated at 1,400 rpm for 1 min. Next, 3 µl SDX buffer was added, and the plate was again spun and agitated at 1,400 rpm for 1 min. Then, the plate was incubated at room temperature for 10 min. Next, reaction mix and enzyme were added to each well, for a total reaction volume of 20 µl per well. PTA was performed for 10 h at 30 °C, followed by enzyme inactivation at 65 °C for 3 min. Amplified DNA was cleaned up using an in-house carboxyl magnetic bead clean-up solution (0.024 M PEG-8000, 1 M NaCl, 1 mM EDTA, 10 mM Tris-HCl pH 8, 0.055% Tween 20 and 1.5 ml Cytiva Sera-Mag SpeedBeads Carboxyl Magnetic Beads, hydrophobic per 50 ml). DNA yield was determined using the QuantiFluor dsDNA System (Promega). Samples were subjected to quality control by multiplex PCR for four genomic loci on different chromosomes as previously described8. Amplified genomes showing positive amplification for all four multiplex PCR loci were prepared for Illumina sequencing.
Libraries were prepared following a modified KAPA HyperPlus Library Preparation protocol described in the ResolveDNA EA Whole Genome Amplification protocol. In brief, the fragmentation step was skipped and end-repair and A-tailing were performed for 500 ng amplified DNA input. Adapter ligation was then performed using the SeqCap Adapter Kit (Roche, 07141548001). Ligated DNA was cleaned up using in-house beads and amplified through an on-bead PCR amplification step. Amplified libraries were selected for a size of 300–600 bp using double-size selection. Libraries were subjected to in-house quality control using a 5300 Fragment Analyzer Bioanalyzer for DNA fragment size distribution (Agilent Technologies). Successfully prepped samples were sent to Genuity Science for DNA sequencing, who further tested for quality using TapeStation (Agilent Technologies) before processing. Single-cell PTA-amplified genome libraries were sequenced on the Illumina NovaSeq 6000 platform (150 bp × 2) at minimum 20× coverage (Supplementary Table 12). scWGS of some neurons was performed at Harvard for previous publications6,7 (Supplementary Table 12).
Bulk DNA isolation
Genomic DNA was isolated using the QIAGEN DNA Mini kit (QIAGEN 51304) according to the manufacturer’s protocol for tissues. Approximately 25 mg of fresh-frozen tissue was minced on ice into small still-frozen pieces. Tissue was transferred to a dry-ice chilled sterile 1.5 ml microcentrifuge tubes with 180 μl of buffer ATL. Then, 20 ul of proteinase K (20 mg ml−1) was added before 4 h of agitation at 56 °C on a thermomixer (1,400 rpm). DNA isolation proceeded as written in the protocol with the inclusion of the optional RNase A treatment step. A small sample was sent for fragment analysing and gDNA quality assessment.
Bulk DNA library preparation and sequencing
Bulk DNA was isolated as described above and libraries were prepared following the KAPA HyperPlus library preparation protocol. The KAPA fragmentation step was included in the bulk processed gDNA samples. Bulk gDNA sample libraries were sent to Genuity Science and sequenced on the Illumina NovaSeq 6000 platform (150 bp × 2) at minimum 30× coverage and used as a reference genome against the case-match single-cell genomes. Bulk DNA for cases 1278, 4638, 4643, 5657 and 5817 was previously isolated and sequenced8 on an Illumina HiSeq X Ten platform by Macrogen Genomics or the New York Genome Center.
Analyses of snRNA-seq data
The snRNA-seq reads were aligned to the human genome and assigned to genes (GENCODE v.32) by Cell Ranger (v.6.0.2) with parameters --expect-cells=10000 --include-introns=true (ref. 61). The barcode and UMI solved counts were further processed with Seurat62 (v.4.3.0). The following filtering criteria were applied to each sample and cell: more than 100 cells in the sample; reads from mitochondrially encoded genes less than 5%; and more than 500 expressed genes in the cell. As discussed above, we further filtered samples ‘5817 200102’, ‘5288 200128’ and ‘5887 PFC 210601’ owing to their batch-driven, not cell-type-driven, clustering, removing them from downstream analysis. To minimize false discovery and focus on universal changes in ageing, mitochondrially encoded genes and genes in sex chromosomes were removed in the downstream analysis. The filtered data were log-normalized with a factor of 10,000. The top 8,000 variable features were selected for principal component analysis (PCA), clustering and uniform manifold approximation and projection (UMAP) analysis. The top 30 principal components and 0.5 resolution were used for k-nearest neighbours (KNN)-graph based clustering, yielding 39 clusters.
Each of the cells in this study was anchored to the cells from Velmeshev et al.19 using the RPCA method with the top 30 principal components19,62,63. For each of our 39 clusters, the percentages of cell types according to Velmeshev et al. were calculated, and the dominant cell types were used for each cluster. Those clusters with ambiguous cell types according to Velmeshev et al. were considered as artefacts and removed from the downstream analysis. We further defined marker genes for each cluster using the Seurat FindAllMarkers function by comparing each cluster with the remaining clusters, requiring expression in at least 25% of the cluster and a log2-transformed fold change greater than 0.25. For analyses in which excitatory neuron layer or inhibitory neuron subtype are not specified, layer- and subtype-specific clusters were combined and analysed as a group. Specifically, all neurons from the L2/3, L4, L5/6 and L5/6-CC clusters were combined into a non-layer-specific group of excitatory neurons, and neurons from the IN-SST, IN-SV2C, IN-PV and IN-VIP clusters were combined into a non-subtype-specific group of inhibitory neurons. Finally, we validated our cell-type assignment using the following marker genes (also shown in Supplementary Fig. 2): CUX2 for L2/3 neurons; RORB for L4 neurons; THEMIS for L5/6-CC neurons; TLE4 for L5/6 neurons; VIP, PVALB, SST and SV2C for inhibitory neuron subtypes; OLIG1 for oligodendrocytes; AQP4 for astrocytes; PDGFRA for OPCs; PTPRC for microglia; and CLDN5 for endothelia.
We identified changes in expression during ageing using the Seurat FindAllMarkers function. In brief, a Wilcoxon rank-sum test followed by multiple test adjustment was applied to determine significantly differentially expressed genes (q < 0.05) between adult and elderly donors for each cell type. We further filtered genes expressed in less than 25% of elderly cells and adult cells, or with a log2-transformed fold change less than 0.5. The same process was used to identify genes differentially expressed between infant cells and adult cells.
Continuous method to validate changes in expression during ageing
We used linear regression with sex as a covariate as an alternative method to determine continuous changes in expression during ageing. Average log-normalized expression levels and the age (in years) of each donor were used to build the linear model for each cell type. Genes with a slope less than −0.001 or greater than 0.001, a P value less than 0.05 and expressed in at least 25% of adult or elderly cells were considered as continuously changed genes during ageing. Both methods showed strong agreement on genes that go down during ageing across cell types, especially in excitatory neurons (Extended Data Fig. 5b and Supplementary Table 7). The linear model generally identified more genes that go up during ageing than the Wilcoxon test model, owing to the relatively strict log2-transformed fold-change cut-off of 0.5.
Analysis of transcriptome change during ageing using three groups
We investigated the transcriptome changes during ageing in a more continuous way, by dividing our non-infant donors into three groups: young adult (5 donors; under 40 years old); adult (6 donors; 40–69 years old); and elderly (6 donors; 70 years old or over). As shown in Extended Data Figs. 5a, 7a,e and 10a,b, the results generally matched our conclusions using the two-group comparison (elderly versus adult).
Transcriptional variability during ageing
Transcription variability is calculated by the coefficient of variation (CV). Specifically, for each gene in a specific cell type and a specific donor, the normalized expression levels (CPM) of all cells are used to calculate the CV, defined by the ratio of standard variation to the mean. The average CV of all genes is defined as the CV for a specific cell type within a particular donor. Comparing elderly and adult donors using a Wilcoxon rank-sum test showed a significant increase in transcriptional variability for IN-SST neurons but not for any other cell type.
Infant-specific analysis
To identify infant-specific changes in gene expression, we performed differential expression testing using the Seurat FindAllMarkers function as described above, comparing the infant-specific clusters (L2/3-2 and Ast-3) with the other non-infant-specific clusters of the respective cell type. The infant-specific upregulated genes, those with higher expression in the infant-specific cluster relative to the other clusters, were used for GO analysis (described below).
To determine changes in cell-type proportion, we used a Wilcoxon rank-sum test comparing the proportion of each cell type in infants to the remaining samples (adult and elderly). Donor 1465 (a 17-year-old male individual) was excluded from this analysis owing to the differences in nuclei preparation before snRNA-seq discussed above.
GO analysis
GO analysis of biological processes was performed on the differentially expressed genes for each cell type, both up and downregulated, using the R package gprofiler2 (v.0.2.3) with the correction method set to ‘fdr’ and source set to ‘GO:BP’ from the GO database. For each cell type, we used the active genes as the background gene set (indicated in the Supplementary Tables as control genes). Active genes were defined as those expressed in more than 25% of the cells to be consistent with the definition of a differentially expressed gene. Determination of the GO term categories shown in Figs. 2b and 3c was done manually (see Supplementary Tables 5 and 9 for mappings). To confirm the distinct GO enrichment profile in endothelial cells, we repeated the analysis after down-sampling. For each non-endothelial cell type, we chose the top 121 downregulated genes in elderly donors with the lowest FDR (121 matches the number of downregulated genes in the endothelial cells). There were fewer than 121 downregulated genes in oligodendrocytes, and thus down-sampling was not performed for this cell type. The GO down-sampling results are reported in Supplementary Table 10.
Random permutation test for shared downregulated genes in cell types from elderly donors
To test whether there are significantly more genes downregulated in at least one excitatory neuron, at least one inhibitory neuron and at least two glial cell types than expected, we performed a random permutation test. We randomly picked the same number of expressed genes to designate as downregulated for each cell type, using a minimum expression cut-off of 25% of the adult cells and 20% of the elderly cells, and recorded the number of shared genes as the expected value. A total of 1,000 permutations were performed, and all of the tests yielded fewer shared genes than observed in our data, generating a P value of less than 0.001.
Identification of sSNVs in neurons
To identify sSNVs, we used both scWGS and corresponding bulk WGS data. scWGS and bulk WGS data were first processed accordingly to the GATK (v.4.1.8.1) best practices64. In brief, reads were aligned to the human genome using bwa-mem (v.0.7.12) with default parameters. PCR duplicates were then filtered using Picard, and the remaining reads were recalibrated with GATK BaseRecalibrator and ApplyBQSR. Genotypes were then identified with GATK HaplotypeCaller and GenotypeGVCFs. Finally, sSNVs were identified by comparing the scWGS data with corresponding WGS data from bulk tissues using SCAN2 with the following parameters: --snv-min-sc-dp 5 --snv-min-bulk-dp 106. Common SNPs from dbSNP (v.20180418) and phasing information from the 1000 Genomes Project (v.3) were used as a reference panel while running the SCAN2 pipeline. We estimated the FDR for SCAN2 as 8.6% in a previous publication6.
Signature analysis of sSNVs
We performed signature analysis for sSNVs using the R package MutationalPatterns (v.3.16.0)65. We first calculated the spectrum of sSNVs in the 96-trinucleotide contexts for each neuron from all donors. A non-negative matrix factorization (NMF) was applied to the spectrum of sSNVs and the signatures were identified. After applying various numbers of signatures in the practice, ranging from one to eight, we found that two signatures yielded the best performance with regard to stability and reconstruction errors (Supplementary Fig. 12). The signatures (A1 and A2) were then compared with the COSMIC v.3 signatures, and cosine similarities between signatures were calculated. To confirm the reproducibility of our signature analysis, a second method, SignatureAnalyzer, was used with default parameters. SignatureAnalyzer identified similar signatures to those identified by MutationalPatterns.
Enrichment and strand bias of sSNVs in genic features and chromatin states
To calculate the enrichment of sSNVs in genes and intergenic regions, we first simulated random controls with the same mutation spectrum as sSNVs restricted to suitable regions (that is, with enough depth) in our scWGS and bulk WGS dataset. The numbers of sSNVs and random controls at genes and intergenic regions were then calculated. NMF, using the R package MutationalPatterns, was further applied to sSNVs and random controls at genes and intergenic regions to trace the contribution of signatures A1 and A2. Genes were divided into five groups according to their transcriptional activity (CPM) in neurons and glia cells from our snRNA-seq data. The same enrichment analysis was also done over the 15 chromatin states in the human dorsolateral PFC from Roadmap66. To test for strand bias in sSNVs, we used the UCSC table browser to identify all RefGene transcripts associated with single-neuron sSNVs. Only sSNVs that had known transcripts all going in the same direction were considered. Transcriptional directions for sSNVs that overlapped a transcript were tallied, and the numbers collapsed to report only one complement of each base pair (T>A, T>C, T>G, C>A, C>T and C>G).
DepMap analyses of the effects of upregulated and downregulated genes on cell viability
The requirement of each gene in overall cell viability was determined using the Cancer Dependency Map (DepMap; version Public 22Q4), which provides the cell viability effect of each gene knockout across 1,078 cancer cell lines of varying origin67. Specifically, cell viability is determined by performing whole-genome pooled CRISPR screening across each cell line, and on the basis of the fold change in the abundance of cells containing Cas9 and guides against each specific gene. For example, if cells transduced with Cas9 and guides against a particular gene were depleted after the screen, this would indicate an essential gene. The overall effect of gene knockout for a given cell line is quantified using a cell population dynamics model called Chronos68, which incorporates the efficacy of each guide and copy number correction (CRISPR toxicity unrelated to gene function can occur when high copy numbers are subjected to CRISPR-mediated strand breaks) to provide an overall ‘gene effect score’ that indicates the probability that a given cell line is dependent on the gene for survival69. Notably, a value of −1.0 corresponds to the median gene effect score of all common essential genes, whereas a cell line is considered dependent if the gene effect score is ≤ −0.5. Positive values would indicate increased cell viability or proliferation after loss of the gene.
Among the upregulated and downregulated ‘hits’ from the snRNA-seq, those encoding long non-coding RNAs, non-coding RNAs or pseudogenes are not covered in the DepMap essentiality analyses and thus were not analysed for effects on gene viability. Likewise, several coding genes (CECR, NEFL, FTH1, COX4I1, SH3RF3, BMP2K, SHISA8, MYRFL and RPS3A) did not have CRISPR screen data yet available, and were not analysed.
Defining housekeeping and neuron-specific genes
We first calculated the average logged CPMs for each gene in excitatory neurons, inhibitory neurons, microglia and endothelia. Then we defined housekeeping genes as genes with a difference of less than 0.1 between the four cell types that also had an average logged CPM greater than 0.1 in each cell type. The genes that fit these criteria also have an average logged CPM greater than 0.1 in oligodendrocytes, OPCs and astrocytes. The neuron-specific genes were defined as those genes with average logged CPMs higher than 0.2 in both neuron groups and lower than 0.1 in microglia and endothelia.
Determining what drives transcriptome change during ageing
To determine which feature is likely to drive expression change during ageing, we constructed a multiple linear regression model to estimate the contribution of genetic and transcriptomic features to the expression change during ageing. To avoid the effect of non-expressed genes, we only assessed genes whose average logged CPM is at least 0.1 in excitatory neurons, inhibitory neurons, microglia, endothelia, oligodendrocytes, OPCs and astrocytes. Gene length, exon length, expression in each cell type and expression specificity for each cell type and neurons were used to build the regression model to predict the fold change of gene expression between elderly and adult. Expression specificity was calculated by the normalized expression in each cell type divided by the average normalized expression in the remaining cell types. Expression specificity for neurons was calculated by comparing the average expression in neurons and the average expression in glia cells. We also included broad cell specificity in the model, defined by the sum of the difference between maximum expressed cell type and other cell types, divided by (number of cell types used – 1). As the number of reads captured for each gene could be biased towards gene or exon length, we also included gene and exon length-corrected normalized expression levels in each cell types as input features. Bulk sequencing is also a quantitative way to measure absolute expression levels. Thus, we included the expression levels (TPM; transcripts per million mapped reads) in human frontal cortex from the GTEx portal70. The squared correlation coefficient between the model prediction and observed fold change of expression, an indicator of model performance, ranged from 0.23 in microglia to 0.54 in excitatory neurons. Among all features assessed, gene length yielded the highest correlation coefficient, suggesting that it has a key role in determining expression change during ageing in neurons and glia cells.
Validation of snRNA-seq results using published data
No other single published study on human PFC spans the same age range as ours, so we looked to two different datasets for validation of our results. Herring et al.25 includes PFC from 22 gestational weeks to 40 years old. To validate our infant-specific clusters, we obtained raw snRNA-seq reads from the Herring paper (publicly available at GSE168408) and processed them using Cell Ranger (v.7.0.1) with the following parameters: “--include-introns true --nosecondary”. We filtered and clustered the data in the same way as we did with our own (described above), using Velmeshev et al. as our reference for cell-type identification, confirming the presence of infant-specific astrocytes and excitatory neurons in a larger sample size. We compared the expression of the infant-specific differentially expressed genes from our own data (methods described above) with Herring data for infants (prenatal samples to 2 years) and adults (15–40 years), validating our findings of infant-specific clusters and their respective gene-expression profiles.
To validate the changes we described in the elderly brain, we used control PFC (BA46) data from Ling et al.29, which includes donors aged 22–97 years. We downloaded their publicly available raw counts matrix for each cell type from NeMo (https://assets.nemoarchive.org/dat-bmx7s1t) and normalized the expression levels using the same strategy: to total number of reads for each cell with a factor of 10,000. We then compared the expression of genes of interest from our data in elderly and adult brains in the Ling data. Specifically, we assessed whether common genes are downregulated in elderly cells, and whether the decrease of expression during ageing is associated with gene length.
We also used the control PFC data from Mathys et al.30 to validate our findings. We downloaded their publicly available raw counts matrix for each cell type from the Alzheimer’s disease and ageing brain atlas data repository (https://compbio.mit.edu/ad_aging_brain) and normalized to the number of UMI reads per cell per 10,000 UMI reads. This dataset comprises 189 individuals, and includes only elderly donors (over 70 years old). We then compared the expression of downregulated genes, common genes and short and long genes in our adult donors, our elderly donors and the elderly donors from Mathys et al. The results were consistent with our own dataset: common genes and short genes showed decreased expression in neuron and glia cells from elderly donors. We also compared the expression levels of genes in donors aged 70–79 years and 80 years and over from Mathys et al., and did not find a significant change.
MERFISH: sample preparation and imaging
Spatial transcriptomics was performed in two batches using two versions of the MERFISH platform. Data from each batch were analysed separately and not integrated into a single analysis. For batch 1, three adult donors and three elderly donors were selected for spatial transcriptomics on the basis of RNA integrity number, tissue availability and sex. Vizgen’s protocol for the sample preparation was followed with the following modifications. Brains were sectioned and mounted on Vizgen MERSCOPE slides. After adhering to the coverslip, samples were fixed in prewarmed 4% paraformaldehyde in 1× PBS for 30 min at 47 °C, followed by three washes in 1× PBS for 5 min each at room temperature. Samples were dried for one hour at room temperature. The samples were then incubated overnight in 70% ethanol at 4 °C to permeabilize the tissue. Samples were photobleached for 6 h at room temperature in the Vizgen Photobleacher. Next, the Vizgen sample preparation protocol for FFPE tissues was followed, beginning with anchoring pretreatment (step 3 in Vizgen protocol version 9160012 Rev D). After RNA anchoring, the tissue was embedded in gel embedding solution (containing 0.5% ammonium persulfate, 0.05% TEMED and Vizgen’s gel embedding premix) and incubated for 22 h with tissue clearing solution (Vizgen Clearing Premix and 1:100 proteinase K) at 47 °C. The probe library was applied to the sample and incubated for 48 h at 37 °C. Finally, the samples were washed, incubated with DAPI and polyT solution for 15 min at room temperature and washed with formamide wash buffer for 10 min at room temperature. For the imaging, the MERSCOPE 500 gene imaging kit was activated with 250 μl imaging buffer activator and 100 μl RNAse inhibitor. Fifteen millilitres of mineral oil was added through the activation port, the instrument was primed and the imaging chamber was assembled according to the MERSCOPE user guide. A 10× low-resolution DAPI mosaic of the sample was acquired, and the imaging area was selected for data acquisition.
For MERFISH batch 2, an infant and three adult donors were selected on the basis of RNA integrity number, tissue availability and sex. All tissue processing steps were performed as described above, but imaging was performed on a MERSCOPE Ultra instrument. Owing to uncertainty in the back compatibility between instruments, these four samples were treated as their own set of data and never compared with the six-sample cohort processed on the older instrument.
MERFISH: post-imaging data processing and analysis
For batch 1, after the MERSCOPE run, the data were decoded using Vizgen’s analysis pipeline integrated within the MERSCOPE system. The Vizgen post-processing tool (VPT, Vizgen) was used to improve cell segmentation with a combination of pre-filtering with a Gaussian filter and the CellPose algorithm. For batch 2, the four samples imaged on the MERSCOPE Ultra were not subjected to additional processing using the VPT, because cell segmentation using CellPose was performed by the MERSCOPE Ultra instrument.
After cell segmentation, only cells with volumes greater than 200 μm3 were retained for downstream analysis. The cell × gene count matrix was then analysed with the Seurat R package (v.5.1.0) for cell-type assignment. Two datasets (one focusing on elderly versus adult, and one on infant versus adult) were analysed separated using the same pipeline. Specifically, PCA was performed using the count matrix, after filtering cells with fewer than 100 transcript counts, followed by logCPM transformation. We then performed UMAP and KNN clustering analysis using the top 30 principal components. The resolution of KNN clustering was set to 0.3, yielding 15 clusters in batch 1 and 16 clusters in batch 2. Each cluster was then assigned a specific cell type according to the expression of marker genes (Extended Data Fig. 6b and Supplementary Table 11).
In batch 1, clusters 12 and 14 showed mixed expression of marker genes, preventing cell-type assignment, and were removed from downstream analysis. Cluster 1 was composed of excitatory neurons that could not be assigned to a specific layer owing to mixed expression of layer-specific markers. To investigate the transcriptome change during ageing, we compared gene expression between adult and elderly donors for each cell type. We normalized gene expression first to cell volume (molecules per 2,000 μm3) and then to the average expression of a set of control genes that are stably expressed during ageing (Supplementary Table 11). The control genes were defined as genes with a log2-transformed fold change of expression between elderly and adult donors >−0.3 and <0.3 in our snRNA-seq dataset.
In batch 2, clusters 9, 10, 12 and 15 showed mixed expression of marker genes and were removed from downstream analysis. Different layers of excitatory neurons and different subtypes of inhibitory neurons were analysed together because many of them could not be assigned to a specific layer owing to mixed expression of layer-specific markers. We investigated transcriptome change during brain development using the same strategy as we did in the elderly and adult dataset. Gene expression between infant and adult donors was compared, after normalizing to cell volume and a set of control genes stably expressed in infant and adult donors.
MERFISH gene panel selection
The gene panel used for MERFISH was composed to validate initial snRNA-seq findings generated from 13 donors, focusing on differences in the elderly and adult donors. It is composed of 70 marker genes (used to identify cell types), 33 short housekeeping genes, 33 long housekeeping genes, 24 short neuron-specific genes, 21 long neuron-specific genes, 9 ribosomal-protein genes, 10 nuclear-encoded mitochondrial genes, 11 DNA damage repair genes and 35 other genes of interest (Supplementary Table 11). All short housekeeping and neuron-specific genes came from the first length decile of their respective gene groups and all long housekeeping and neuron-specific genes came from the tenth length decile of their respective gene groups. After the addition of six donors to our snRNA-seq data, our housekeeping and neuron-specific gene lists changed slightly, although the method used to generate the list did not, and not all of the neuron-specific and housekeeping genes in the MERFISH panel met the criteria. The MERFISH gene tab of Supplementary Table 11 reports the decile according to the original housekeeping and neuron-specific lists used to generate the panel. If the gene is present on the current list, the corresponding decile is reported in parentheses.
Reporting summary
Further information on research design is available in the Nature Portfolio Reporting Summary linked to this article.
Data availability
Raw RNA-seq and scWGS sequencing data not previously published, and MERFISH data, are available at dbGaP (phs003445.v1.p1). Processed data are available at https://publications.wenglab.org/SomaMut/. An interactive genome browser of the snRNA-seq pseudo bulk expression data can be found at https://genome.ucsc.edu/s/yutianxiong/Weng_Lodato_Aging. Previously published single cells analysed in this study can be found at dbGaP (phs001485.v3.p1) and NIAGADS (NG00121). Previously published bulk DNA-sequencing data can be found at dbGap (phs001485.v1.p1), the NCBI Sequence Read Archive (SRA; accession numbers SRP041470 and SRP061939) and NIAGADS (NG00121). The previously published Velmeshev et al.19 data used for cell-type annotation were downloaded from SRA accession number PRJNA434002. The previously published Herring et al.25 data were downloaded from the Gene Expression Omnibus (GEO) under accession number GSE168408. The previously published Ling et al.29 data were downloaded from the Neuroscience Multi-omic Data Archive (NeMo) (https://assets.nemoarchive.org/dat-bmx7s1t). The previously published Mathys et al.30 data were downloaded from the Alzheimer’s disease and ageing brain atlas data repository (https://compbio.mit.edu/ad_aging_brain). GTEx data were downloaded from the GTEx portal (https://www.gtexportal.org/home/downloads/adult-gtex/bulk_tissue_expression). GO biological process terms were sourced from https://geneontology.org/. DepMap data came from https://depmap.org/portal/ using version Public 22Q4.
References
Lopez-Otin, C., Blasco, M. A., Partridge, L., Serrano, M. & Kroemer, G. Hallmarks of aging: an expanding universe. Cell 186, 243–278 (2023).
Ham, S. & Lee, S. V. Advances in transcriptome analysis of human brain aging. Exp. Mol. Med. 52, 1787–1797 (2020).
Frenk, S. & Houseley, J. Gene expression hallmarks of cellular ageing. Biogerontology 19, 547–566 (2018).
Lu, T. et al. Gene regulation and DNA damage in the ageing human brain. Nature 429, 883–891 (2004).
Kim, J. et al. Prevalence and mechanisms of somatic deletions in single human neurons during normal aging and in DNA repair disorders. Nat. Commun. 13, 5918 (2022).
Luquette, L. J. et al. Single-cell genome sequencing of human neurons identifies somatic point mutation and indel enrichment in regulatory elements. Nat. Genet. 54, 1564–1571 (2022).
Miller, M. B. et al. Somatic genomic changes in single Alzheimer’s disease neurons. Nature 604, 714–722 (2022).
Lodato, M. A. et al. Aging and neurodegeneration are associated with increased mutations in single human neurons. Science 359, 555–559 (2018).
Abascal, F. et al. Somatic mutation landscapes at single-molecule resolution. Nature 593, 405–410 (2021).
Chronister, W. D. et al. Neurons with complex karyotypes are rare in aged human neocortex. Cell Rep. 26, 825–835 (2019).
Eze, U. C., Bhaduri, A., Haeussler, M., Nowakowski, T. J. & Kriegstein, A. R. Single-cell atlas of early human brain development highlights heterogeneity of human neuroepithelial cells and early radial glia. Nat. Neurosci. 24, 584–594 (2021).
Lake, B. B. et al. Integrative single-cell analysis of transcriptional and epigenetic states in the human adult brain. Nat. Biotechnol. 36, 70–80 (2018).
Berg, J. et al. Human neocortical expansion involves glutamatergic neuron diversification. Nature 598, 151–158 (2021).
Siletti, K. et al. Transcriptomic diversity of cell types across the adult human brain. Science 382, eadd7046 (2023).
He, X., Memczak, S., Qu, J., Belmonte, J. C. I. & Liu, G. H. Single-cell omics in ageing: a young and growing field. Nat. Metab. 2, 293–302 (2020).
Chien, J. F. et al. Cell-type-specific effects of age and sex on human cortical neurons. Neuron 112, 2524–2539 (2024).
Frohlich, A. S. et al. Single-nucleus transcriptomic profiling of human orbitofrontal cortex reveals convergent effects of aging and psychiatric disease. Nat. Neurosci. 27, 2021–2032 (2024).
Caglayan, E., Liu, Y. & Konopka, G. Neuronal ambient RNA contamination causes misinterpreted and masked cell types in brain single-nuclei datasets. Neuron 110, 4043–4056 (2022).
Velmeshev, D. et al. Single-cell genomics identifies cell type-specific molecular changes in autism. Science 364, 685–689 (2019).
Velmeshev, D. et al. Single-cell analysis of prenatal and postnatal human cortical development. Science 382, eadf0834 (2023).
Yang, J., Wang, M., Lv, Y. & Chen, J. Cortical layer markers expression and increased synaptic density in interstitial neurons of the white matter from drug-resistant epilepsy patients. Brain Sci. 13, 626 (2023).
Morcom, L. et al. DCC regulates astroglial development essential for telencephalic morphogenesis and corpus callosum formation. eLife 10, e61769 (2021).
Lee, Y. S., Kang, J. W., Lee, Y. H. & Kim, D. W. ID4 mediates proliferation of astrocytes after excitotoxic damage in the mouse hippocampus. Anat. Cell Biol. 44, 128–134 (2011).
Akdemir, E. S., Huang, A. Y. & Deneen, B. Astrocytogenesis: where, when, and how. F1000Res. 9, 233 (2020).
Herring, C. A. et al. Human prefrontal cortex gene regulatory dynamics from gestation to adulthood at single-cell resolution. Cell 185, 4428–4447 (2022).
Enge, M. et al. Single-cell analysis of human pancreas reveals transcriptional signatures of aging and somatic mutation patterns. Cell 171, 321–330 (2017).
Hernando-Herraez, I. et al. Ageing affects DNA methylation drift and transcriptional cell-to-cell variability in mouse muscle stem cells. Nat. Commun. 10, 4361 (2019).
Martinez-Jimenez, C. P. et al. Aging increases cell-to-cell transcriptional variability upon immune stimulation. Science 355, 1433–1436 (2017).
Ling, E. et al. A concerted neuron–astrocyte program declines in ageing and schizophrenia. Nature 627, 604–611 (2024).
Mathys, H. et al. Single-cell atlas reveals correlates of high cognitive function, dementia, and resilience to Alzheimer’s disease pathology. Cell 186, 4365–4385(2023).
Madabhushi, R. & Kim, T. K. Emerging themes in neuronal activity-dependent gene expression. Mol. Cell. Neurosci. 87, 27–34 (2018).
Blokzijl, F. et al. Tissue-specific mutation accumulation in human adult stem cells during life. Nature 538, 260–264 (2016).
Zhang, L. et al. Single-cell whole-genome sequencing reveals the functional landscape of somatic mutations in B lymphocytes across the human lifespan. Proc. Natl Acad. Sci. USA 116, 9014–9019 (2019).
Huang, Z. et al. Single-cell analysis of somatic mutations in human bronchial epithelial cells in relation to aging and smoking. Nat. Genet. 54, 492–498 (2022).
Franco, I. et al. Whole genome DNA sequencing provides an atlas of somatic mutagenesis in healthy human cells and identifies a tumor-prone cell type. Genome Biol. 20, 285 (2019).
Gonzalez-Pena, V. et al. Accurate genomic variant detection in single cells with primary template-directed amplification. Proc. Natl Acad. Sci. USA 118, e2024176118 (2021).
Alexandrov, L. B. et al. The repertoire of mutational signatures in human cancer. Nature 578, 94–101 (2020).
Marteijn, J. A., Lans, H., Vermeulen, W. & Hoeijmakers, J. H. Understanding nucleotide excision repair and its roles in cancer and ageing. Nat. Rev. Mol. Cell Biol. 15, 465–481 (2014).
Bizzotto, S. et al. Landmarks of human embryonic development inscribed in somatic mutations. Science 371, 1249–1253 (2021).
Park, S. et al. Clonal dynamics in early human embryogenesis inferred from somatic mutation. Nature 597, 393–397 (2021).
Coorens, T. H. H. et al. Extensive phylogenies of human development inferred from somatic mutations. Nature 597, 387–392 (2021).
Petljak, M. et al. Characterizing mutational signatures in human cancer cell lines reveals episodic APOBEC mutagenesis. Cell 176, 1282–1294 (2019).
Gyenis, A. et al. Genome-wide RNA polymerase stalling shapes the transcriptome during aging. Nat. Genet. 55, 268–279 (2023).
Vermeij, W. P. et al. Restricted diet delays accelerated ageing and genomic stress in DNA-repair-deficient mice. Nature 537, 427–431 (2016).
Stoeger, T. et al. Aging is associated with a systemic length-associated transcriptome imbalance. Nat. Aging 2, 1191–1206 (2022).
Madabhushi, R. et al. Activity-induced DNA breaks govern the expression of neuronal early-response genes. Cell 161, 1592–1605 (2015).
McCoy, M. J. & Fire, A. Z. Intron and gene size expansion during nervous system evolution. BMC Genomics 21, 360 (2020).
Brown, J. C. Role of gene length in control of human gene expression: chromosome-specific and tissue-specific effects. Int. J. Genomics 2021, 8902428 (2021).
Chiaromonte, F., Miller, W. & Bouhassira, E. E. Gene length and proximity to neighbors affect genome-wide expression levels. Genome Res. 13, 2602–2608 (2003).
Castillo-Davis, C. I., Mekhedov, S. L., Hartl, D. L., Koonin, E. V. & Kondrashov, F. A. Selection for short introns in highly expressed genes. Nat. Genet. 31, 415–418 (2002).
Koch, Z., Li, A., Evans, D. S., Cummings, S. & Ideker, T. Somatic mutation as an explanation for epigenetic aging. Nat. Aging 5, 709–719 (2025).
Spencer Chapman, M. et al. Prolonged persistence of mutagenic DNA lesions in somatic cells. Nature 638, 729–738 (2025).
Selby, C. P., Lindsey-Boltz, L. A., Li, W. & Sancar, A. Molecular mechanisms of transcription-coupled repair. Annu. Rev. Biochem. 92, 115–144 (2023).
Nakazawa, Y. et al. Ubiquitination of DNA damage-stalled RNAPII promotes transcription-coupled repair. Cell 180, 1228–1244 (2020).
Tufegdzic Vidakovic, A. et al. Regulation of the RNAPII pool is integral to the DNA damage response. Cell 180, 1245–1261 (2020).
Milano, L., Gautam, A. & Caldecott, K. W. DNA damage and transcription stress. Mol. Cell 84, 70–79 (2024).
Drost, J. et al. Use of CRISPR-modified human stem cell organoids to study the origin of mutational signatures in cancer. Science 358, 234–238 (2017).
Lodato, M. A. et al. Somatic mutation in single human neurons tracks developmental and transcriptional history. Science 350, 94–98 (2015).
Matevossian, A. & Akbarian, S. Neuronal nuclei isolation from human postmortem brain tissue. J. Vis. Exp. 20, e914 (2008).
Spalding, K. L., Bhardwaj, R. D., Buchholz, B. A., Druid, H. & Frisén, J. Retrospective birth dating of cells in humans. Cell 122, 133–143 (2005).
Zheng, G. X. et al. Massively parallel digital transcriptional profiling of single cells. Nat. Commun. 8, 14049 (2017).
Hao, Y. et al. Integrated analysis of multimodal single-cell data. Cell 184, 3573–3587 (2021).
Stuart, T. et al. Comprehensive integration of single-cell data. Cell 177, 1888–1902 (2019).
DePristo, M. A. et al. A framework for variation discovery and genotyping using next-generation DNA sequencing data. Nat. Genet. 43, 491–498 (2011).
Blokzijl, F., Janssen, R., van Boxtel, R. & Cuppen, E. MutationalPatterns: comprehensive genome-wide analysis of mutational processes. Genome Med. 10, 33 (2018).
Roadmap Epigenomics Consortium et al.Integrative analysis of 111 reference human epigenomes. Nature 518, 317–330 (2015).
Meyers, R. M. et al. Computational correction of copy number effect improves specificity of CRISPR–Cas9 essentiality screens in cancer cells. Nat. Genet. 49, 1779–1784 (2017).
Dempster, J. M. et al. Chronos: a cell population dynamics model of CRISPR experiments that improves inference of gene fitness effects. Genome Biol. 22, 343 (2021).
Arafeh, R., Shibue, T., Dempster, J. M., Hahn, W. C. & Vazquez, F. The present and future of the Cancer Dependency Map. Nat. Rev. Cancer 25, 59–73 (2025).
The GTEx Consortium. The GTEx Consortium atlas of genetic regulatory effects across human tissues. Science 369, 1318–1330 (2020).
Acknowledgements
We thank T. Krumpoch and S. Pechold of the UMass Chan Medical School Flow Cytometry Core (funded by NIH S10 OD028576) for assistance with single-nuclei sorting; the UMass Chan Medical School SCOPE core for use of their analysis equipment (funded by a Massachusetts Life Sciences Center Research Infrastructure grant awarded to K. Fitzgerald and C. Baer; RRID SCR_022721); D. Kim, A. Mercurio and R. Logan for manuscript feedback; and T. Chittenden, J. Lopez, R. Li and A. McLean for assistance with high-throughput sequencing and for discussion. Human tissue was obtained from the NIH NeuroBioBank at the University of Maryland, the Banner Sun Health Research Institute Brain Bank and the Sepulveda Research Corporation. We thank the donors and their families for their contributions to research, and the Banner Sun Health Research Institute Brain and Body Donation Program of Sun City, Arizona for providing human biological materials. The Brain and Body Donation Program has been supported by the National Institute of Neurological Disorders and Stroke (U24 NS072026, National Brain and Tissue Resource for Parkinson’s Disease and Related Disorders), the National Institute on Aging (P30 AG019610 and P30 AG072980, Arizona Alzheimer’s Disease Center), the Arizona Department of Health Services (contract 05700, Arizona Alzheimer’s Research Center), the Arizona Biomedical Research Commission (contracts 4001, 0011, 05-901 and 1001 to the Arizona Parkinson’s Disease Consortium) and the Michael J. Fox Foundation for Parkinson’s Research. M.A.L. was supported by R00 AG054748, R56 AG078453, the American Federation for Aging Research, the Glenn Foundation for Medical Research and the Charles H. Hood Foundation. Z.W. was supported by U24HG012343.
Author information
Authors and Affiliations
Contributions
A.M.J. and M.A.L. conceived and designed the study. A.M.J. performed snRNA-seq. T.Y. performed bioinformatic analysis. J.S.Z., C.B.S. and A.K.T. performed single-neuron sorting and sequencing. C.E.B. performed spatial transcriptomics. Y.K. and A.M.J. performed data analysis. A.M.J. and M.A.L. wrote the manuscript. M.A.L. and Z.W. supervised the study.
Corresponding authors
Ethics declarations
Competing interests
The authors declare no competing interests.
Peer review
Peer review information
Nature thanks Young Seok Ju and the other, anonymous, reviewer(s) for their contribution to the peer review of this work.
Additional information
Publisher’s note Springer Nature remains neutral with regard to jurisdictional claims in published maps and institutional affiliations.
Extended data figures and tables
Extended Data Fig. 1 Cell-type ratios do not change significantly with age.
(a) Neuron to glia ratio shows no significant change with age. (b) Excitatory to inhibitory neuron ratio shows no significant change with age. (c) Contribution of each cell type to each donor, shown as a percentage of total cells. Columns in this panel plus Fig. 2b sum to 100. (d) We see no significant differences between elderly and adult in the proportion of inhibitory neuron subtypes. (IN – inhibitory neurons, AST – astrocytes, Endo – endothelial cells).
Extended Data Fig. 2 Marker-gene expression in infant-specific neurons.
UMAP shows cell-type prediction score for each cell on the plot. Prediction scores shown for L2/3 neurons, L4 neurons, L5/6 neurons, L5/6-CC neurons, and Neu-mat neurons, a cell type identified in our reference data thought to be a mix of ambient RNA and maturing neurons. The infant-specific neuron cluster is circled in red and shows mixed cell-type composition based on prediction scores. Neuron prediction scores otherwise show cluster-specific patterning.
Extended Data Fig. 3 Cortical layers in MERFISH data.
MERFISH sections of infant male, 15-year-old female, 28-year-old male, and 57-year-old male individuals showing marker-gene expression for cortical layers. Circles represent excitatory neurons coloured by gene expression. (a,b) Red: CUX2-L2/3; Green: RORB-L4; Yellow: CUX2 and RORB co-expression. (b) Blue: HS3ST4-L5/6; Teal: RORB and HS3ST4 co-expression. X- and Y-axis values reflect pixel positions.
Extended Data Fig. 4 Infant-specific gene expression across ages in two independent datasets.
Heat maps (top) plotting infant-specific gene expression ordered by age in this study and Herring et al.25 showing higher expression in infant and gestational cases and lower expression in adults for L2/3 neurons and astrocytes. Box plots (bottom) showing mean expression of infant-specific genes and adult-specific genes in L2/3 neurons and astrocytes across ages in this study and Herring et al.25 Expression of infant-specific genes is significantly higher in donors 28 days to 301 days, the subset that most closely matches the ages of the two infants in this study, compared to donors ≥15. Expression of adult-specific genes is significantly lower in the same group of infant donors compared to donors ≥15. All box plots depict median, and first and third quartile. Whiskers show 1.5 × IQR beyond the first and third quartiles. (Two-sided Wilcoxon rank-sum test).
Extended Data Fig. 5 Validation of downregulation during ageing.
(a) Expression of genes downregulated in the primary analysis (elderly vs. adult) are also downregulated when data is broken down into three groups, donors 15–39 (red, N = 5), donors 40–69 (magenta, N = 6), and donors 70–104 (purple, N = 6). Some cell types exhibit continuous downregulation, showing significant decreases with each age group while others are significantly downregulated between the 15–39- and 40–69-year-old groups but expression does not change between the older adult and elderly groups (Two-sided Wilcoxon rank-sum test). (b) Volcano plots showing the results of expression changes during ageing, determined by linear regression. Regression slope is shown on the x axis and -log10(p-value) on the y axis. Dotted lines indicate slope and p-value thresholds, slope < −0.001 or > 0.001 and p < 0.05, used to determine significance. In addition, genes had to be expressed in at least 25% of the elderly or adult cells to be considered. Blue dots indicate genes that were also identified as significantly downregulated by pairwise comparison and Two-sided Wilcoxon rank-sum test. Red dots indicate genes that were identified as significantly upregulated by pairwise comparison and Wilcoxon test. Open circles indicate genes that did not meet the pairwise comparison criteria for fold change and grey circles indicate genes that met the fold change criteria but did not have significant p-values in the pairwise comparison. (c) Box plots showing the expression, in log(CPM), of significantly downregulated genes in elderly excitatory neurons identified in this study in our donors (left) with the donors from Ling et al.29 (right). (d) Box plots comparing expression of downregulated genes identified in this study in adults from this study (red, N = 9), all donors from Mathys et al.30 (violet, N = 189), elderly donors from this study (lilac, N = 7), donors 70–79 from Mathys et al. (light purple, N = 34), and donors over 80 from Mathys et al. (dark purple, N = 155). Two-sided Wilcoxon rank-sum test comparing adults in this study to each of the Mathys groups are all significant. All box plots depict median, and first and third quartile. Whiskers show 1.5 × IQR beyond the first and third quartiles. (*, p > 0.05; **, p > 0.01; ***, p > 0.001).
Extended Data Fig. 6 Spatial transcriptomic validation of snRNA-seq data.
(a) Representative MERFISH sections, showing the assigned cell type from Seurat clustering. (b) UMAP clustering of MERFISH cells showing all identified cell types. Clusters of unknown cells were removed from downstream analysis. Ext indicates cells that expressed multiple excitatory markers and could not be assigned to a specific layer. X- and Y-axis values in a and b reflect pixel positions. (c) Fold change of elderly and adult MERFISH cells of 9 ribosomal proteins (left) and 10 nuclear-encoded mitochondrial proteins (right) in excitatory and L2/3 neurons (Two-sided Wilcoxon rank-sum test, elderly N = 3, adult N = 3). (d,e) Log2 fold change of elderly vs. adult nuclear-encoded mitochondrial genes by snRNA-seq (Two-sided T-Test, elderly N = 7, adult N = 9) (d) and MERFISH (Two-sided Wilcoxon rank-sum test, elderly N = 3, adult N = 3) (e). Genes shown in both d and e are colour-coded. All box plots depict median, and first and third quartile. Whiskers show 1.5 × IQR beyond the first and third quartiles. Points beyond whiskers are outliers. (*, p < 0.05; **, p < 0.01).
Extended Data Fig. 7 Validation of changes in ribosomal-protein genes and nuclear-encoded mitochondrial genes during ageing.
(a) Expression of ribosomal-protein genes in three age groups, 15–39 (red, N = 5), 40–69 (magenta, N = 6), and 70–104 (purple, N = 6) always decreases significantly after age 39. (*, p < 0.05; **, p < 0.01; ***, p < 0.001; Two-sided Wilcoxon rank-sum test). (b) Box plots showing the regression slope of ribosomal-protein genes (teal, N = 81) and nuclear-encoded electron transport chain genes (purple, N = 82). Ribosomal genes shown are the same as shown in Extended Data Fig. 8 and mitochondrial genes shown are the same as shown in Extended Data Fig. 10. (c) Fold change of ribosomal proteins (top) and nuclear-encoded mitochondrial genes (bottom) in ageing in the Ling et al.29 data for each cell type. The expression changes match those seen in this study. Ext, excitatory neurons; Inb, inhibitory neurons; Oli, oligodendrocytes; OPC, oligodendrocyte precursor cells; Ast, astrocytes; Micro, microglia; Endo, endothelial. (*, p < 0.05; two-sided T-test, elderly N = 116, adult N = 64). (d) Box plots comparing expression of ribosomal-protein genes in adults from this study (red, N = 9), all donors from Mathyset al.30 (violet, N = 189), elderly donors from this study (lilac, N = 7), donors 70–79 from Mathys et al. (light purple, N = 35), and donors over 80 from Mathys et al. (dark purple, N = 155). Wilcoxon rank-sum test comparing adults in this study to each of the Mathys groups are all significant. (*, p < 0.05; ***, p < 0.001; Two-sided Wilcoxon rank-sum test). (e) Expression of nuclear-encoded mitochondrial genes of the electro transport chain in three age groups, 15–39 (red, N = 5), 40–69 (magenta, N = 6), and 70–104 (purple, N = 6) always decreases significantly after age 39. (*, p < 0.05; **, p < 0.01; ***, p < 0.001; Two-sided Wilcoxon rank-sum test). (f) Box plots comparing expression of nuclear-encoded mitochondrial genes of the electron transport chain in adults from this study (red, N = 9), all donors from Mathys et al. (violet, N = 189), elderly donors from this study (lilac, N = 7), donors 70–79 from Mathys et al. (light purple, N = 34), and donors over 80 from Mathys et al. (dark purple, N = 155). Wilcoxon rank-sum test comparing adults in this study to each of the Mathys groups are all significant. All box plots depict median, and first and third quartile. Whiskers show 1.5 × IQR beyond the first and third quartiles. (***, p < 0.001; Two-sided Wilcoxon rank-sum test).
Extended Data Fig. 8 Mutation spectrum of sSNVs in human neurons.
(a) Total mutation accumulation per neuron correlates significantly with age at a rate of 15.1 SNVs gained/year (p = 2.2×10⁻¹⁶, Pearson’s correlation). (b) Mutation spectrum of sSNVs called in human neuron scWGS data. Each bar represents a specific mutation in a different trinucleotide context. (c) Cosine similarity of the two signatures, A1 and A2, derived de novo from the total mutation spectrum to each single-base substitution signature in the COSMIC database. Signature A1 is most similar to SBS5. Signature A2 is most similar to SBS30.
Extended Data Fig. 9 Comparison of signature A2 with COSMIC and known developmental signatures.
(a) Heat map showing cosine similarity of Signature A2, the mutation spectrum of the infant cells included in this study, signatures identified in Bizzotto et al.39, Coorens et al.41 and Park et al.40, and COSMIC SBS1, SBS5, and SBS30. (b) COSMIC SBS1, SBS5, and SBS30 contribution to Signature A2, the infant mutation spectrum, and developmental signatures identified in Bizzotto et al., Coorens et al. and Park et al. (c) Mutation plots of the signatures compared in a. Percentage of C>T mutations at CpG sites is higher than the percentage of C>N mutations at CpG sites for all signatures except SBS30. Our mutation calling algorithm, SCAN2, is biased against early developmental somatic mutations, because SCAN2 requires called somatic variants in single cells to show no mutant reads in corresponding bulk tissue from the same donor. In practice, this means that many somatic mutations that occur very early in development, which are widely distributed across the body at a high mosaic fraction, are filtered out by our analysis, whereas late-occurring, lower allele fraction variants are likely to remain. Non-scWGS studies designed to study developmental mosaic mutations do not filter out early variants, probably contributing to differences in the overall patterns of mutations between A2 and clonal mosaics identified in other studies. Thus, Signature A2 may represent a mutational process that is prominent in late stages of development that persists in postnatal life.
Extended Data Fig. 10 Validation of changes in gene length and expression during ageing.
(a,b) Box plots show expression of housekeeping genes in decile 1 (a) and neuron-specific genes in decile 10 (b) in three age groups, 15–39 (red, N = 5), 40–69 (magenta, N = 6), and 70–104 (purple, N = 6). Housekeeping genes always decreases significantly after age 39, while neuron-specific genes show no significant changes. (**, p < 0.01; ***, p < 0.001; Two-sided Wilcoxon rank-sum test). (c,d) Linear regression slope of housekeeping (c) and neuron-specific (d) genes by length decile. (e,f) Comparison of elderly to adult expression of housekeeping (e) and neuron-specific genes (f), as determined in this study, by size decile in Ling et al.29 (R2 = 0.16, p = 2.29×10−67 and R2 = 0.0009, N.S., respectively, elderly N = 116, adult N = 64). Housekeeping genes demonstrate the same length dependent expression changes seen in this study. Neuron-specific genes show no significant relationship between length and expression change, matching the findings of this study. (g,h) Box plots show expression of housekeeping genes in decile 1 (g) and neuron-specific genes in decile 10 (h) in adults from this study (red, N = 9), all donors from Mathys et al.30 (violet, N = 189), elderly donors from this study (lilac, N = 7), donors 70–79 from Mathys et al. (light purple, N = 34), and donors over 80 from Mathys et al. (dark purple, N = 155). Two-sided Wilcoxon rank-sum test comparing adults in this study to each of the Mathys groups are all significant in housekeeping genes, but neuron-specific genes show no significant changes. All box plots depict median, and first and third quartile. Whiskers show 1.5 × IQR beyond the first and third quartiles. (***, p < 0.001; Wilcoxon rank-sum test).
Supplementary information
Supplementary Figures
Supplementary Figures 1–13
Supplementary Tables
Supplementary Tables 1–16
Rights and permissions
Open Access This article is licensed under a Creative Commons Attribution-NonCommercial-NoDerivatives 4.0 International License, which permits any non-commercial use, sharing, distribution and reproduction in any medium or format, as long as you give appropriate credit to the original author(s) and the source, provide a link to the Creative Commons licence, and indicate if you modified the licensed material. You do not have permission under this licence to share adapted material derived from this article or parts of it. The images or other third party material in this article are included in the article’s Creative Commons licence, unless indicated otherwise in a credit line to the material. If material is not included in the article’s Creative Commons licence and your intended use is not permitted by statutory regulation or exceeds the permitted use, you will need to obtain permission directly from the copyright holder. To view a copy of this licence, visit http://creativecommons.org/licenses/by-nc-nd/4.0/.
About this article

Cite this article
Jeffries, A.M., Yu, T., Ziegenfuss, J.S. et al. Single-cell transcriptomic and genomic changes in the ageing human brain. Nature 646, 657–666 (2025). https://doi.org/10.1038/s41586-025-09435-8
Received:
Accepted:
Published:
Version of record:
Issue date:
DOI: https://doi.org/10.1038/s41586-025-09435-8
This article is cited by
-
Human adipose stem cell-derived exosomes modulate the transcriptome of D-galactose-Induced neuronal cells
Scientific Reports (2026)
-
Reconstructing the lifelong history of cells and tissues via somatic mutation analysis
Cellular and Molecular Life Sciences (2025)
