
Abstract
In the face of complex domestic and international situations, the influence of domestic trade on economic growth has been paid more and more attention by the academic community while we still know little about its internal mechanism. From the perspective of China’s inter-provincial trade, based on the panel data of 29 provinces (municipalities and autonomous regions) in China from 2000 to 2021, this paper studies the impact of inter-provincial trade on economic growth by using a two-way fixed effects model. It is found that inter-provincial trade has a significant positive effect on economic growth, and each 1% increase in inter-provincial trade will increase per capita GDP by 0.19%. Furthermore, inter-provincial trade positively affects economic growth through the effect of technology improvement and industrial structure upgrading. However, the two mechanisms are heterogeneous in the eastern, central, and western regions. Among them, the technology improvement mechanism is only established in the central and western regions and the industrial structure upgrading mechanism is only established in the eastern and central regions. Finally, we suggest that governments should formulate targeted development goals and plans according to the actual situation of each region, to ensure that inter-provincial trade can play a full role in promoting economic growth.
Introduction
In the face of the complex situation of economic globalization and the increasing downward pressure on the world economy, to ensure sustained, high-quality economic development and reduce dependence on international trade, enhancing the vitality of domestic trade has become the new goal of economic development for most countries. Due to the rapid economic development, the conditions in all aspects of China have undergone obvious changes. In April 2020, according to national development status and goals, the Chinese government proposed to build a new development paradigm of ‘dual circulation’ with the domestic market as the mainstay (Lin, 2021). The increasing status of domestic trade makes inter-provincial trade in a more important position. Through simple logical analysis, we can see that the development of inter-provincial trade can not only expand the market scale but also form a close cooperative circulation system between provinces. This deepening of the division of labor can promote economic growth. However, in China’s specific development practice, can inter-provincial trade promote economic growth in the face of various factors’ influence and uncertainties brought by them? What is its mechanism for promoting economic growth? Is there heterogeneity among different regions? The answers to these questions have important theoretical and practical significance for promoting the development of domestic trade and sustainable economic growth.
To date, many scholars have begun to pay attention to the relationship between inter-provincial trade and economic growth. The existing studies are mainly divided into the estimation and measurement methods of inter-provincial trade and the economic growth effect of inter-provincial trade. In terms of inter-provincial trade data acquisition, the main methods include official report acquisition (Naughton, 2003; Poncet, 2005; Felbermayr and Steininger, 2019), model estimation (Yotov, 2022) and VAT invoice information acquisition (Xing and Whalley, 2014; Xing et al., 2015). Due to the lack of data in official reports that meet the definition of inter-provincial trade and the limited access to VAT invoice information, the model estimation method is the most widely used. In terms of the economic growth effect of inter-provincial trade, most studies agree that inter-provincial trade can promote economic growth. For example, Ferrarini (2012) believes that the domestic trade potential explained by country size is a factor in the income growth of developing countries in Asia. Yilmazkuday (2020), based on data from various departments and states in the United States, draws an empirical conclusion that interstate trade is the source of about 90% of a state’s welfare income. Li et al. (2023a) conclude by using the spatial econometric model that the digital economy can significantly promote the development of China’s inter-regional trade, and then improve the economic development level of various regions through this channel. Ke (2015) uses the instrumental variable method to argue that the improvement of China’s market integration can significantly promote regional economic growth. Since the scale of inter-provincial trade can measure the degree of inter-provincial market integration (Xu and Fan, 2012; Zhang and Li, 2013), this conclusion confirms the positive influence of inter-provincial trade on economic growth. From the perspective of the transportation industry, Li et al. (2022a) argue that the increase in the turnover of goods between Chinese provinces will increase carbon emissions. According to the study of the environmental Kuznets curve in China (Wang et al., 2022, 2023), this conclusion indirectly affirms the promoting function of inter-provincial goods turnover to economic growth. Nevertheless, there are also a few studies that hold different views. For example, Hong et al. (2019) found by constructing the DMI index matrix that domestic market integration has no direct influence on China’s regional economic development, and even shows a negative effect before and after some years. The relationship between the two subjects is not stable.
In summary, the existing literature shows that some scholars have conducted a preliminary study on the function of inter-provincial trade in promoting economic growth, but there are still some problems that need to be further explored. First, the existing research on the economic growth effect of inter-provincial trade is still inconsistent, especially the lack of research on the mechanism of inter-provincial trade to promote economic growth. Second, China has a vast territory, and there are great differences in resource factor endowment and development levels in different regions. The existing studies lack the heterogeneity studies that combine the differences of different regions. Given this, based on an in-depth analysis of the mechanism and heterogeneity of inter-provincial trade affecting economic growth, we attempt to investigate the impact of inter-provincial trade on China’s economic growth, explore the mechanism of action between the two research subjects and further verify the regional heterogeneity of the mechanism of action. The results are important for understanding the nature of inter-provincial trade affecting economic growth and they have crucial implications for the formulation of subsequent domestic trade development policies.
Theory and hypotheses
The promoting effect of inter-provincial trade on economic growth
In the early days of trade development, the differences in natural resources, labor resources, and other resource endowments among provinces led to different levels of labor productivity under different products, forming absolute or relative comparative advantages. Between provinces, products with comparative advantages flow out of the province and products with comparative disadvantages flow in. With more and more frequent inter-provincial trade exchanges, the trade of the provinces began to be market-oriented. Based on continuous investment and technological innovation, differentiated products more in line with the needs of buyers were produced, and some provinces formed competitive advantages (Li et al., 2020). In the trade exchanges that follow the pattern of “absolute advantage-comparative advantage-competitive advantage”, the scope of inter-provincial trade is increasing and the market scale is gradually expanding. According to Adam Smith, “the division of labor arises from the power of exchange, and the extent of the division of labor is therefore always limited by the size of the power of exchange, in other words by the breadth and narrowness of the market.” Inter-provincial trade expands the market scale of products produced in each province; The expansion of the market also promotes the upgrading of the industrial structure within the provinces by improving the scientific and technological level of the provinces, deepening the existing inter-provincial division of labor, and forming a closer and more efficient inter-provincial cooperation cycle system (Chaney and Ossa, 2013). As Smith’s theorem says, the division of labor is the source of economic growth, and inter-provincial trade promotes provincial economic growth by deepening the division of labor. Based on the above analysis, this paper proposes:
H1: Inter-provincial trade has a positive impact on economic growth.
The function mechanism of inter-provincial trade promoting economic growth
Inter-provincial trade is a channel for each province to obtain advanced technology, and the trading of high-quality products provides it with resources for research and learning (Damijan and Kostevc, 2015). The exchange of products and services also brings spillover effects of knowledge, technology, and management experience, which is conducive to technology improvement. Secondly, the rapid progress of inter-provincial trade will put forward higher requirements for production quality, transportation efficiency, and cost reduction, which will force the continuous development of emerging technologies (Trofimenko, 2008). The market’s urgent demand for advanced science and technology will also attract researchers in relevant fields to carry out targeted research and development, which will bring about the improvement of scientific and technological levels (Bloom et al., 2016). Based on trade exchanges, the provinces establish direct or indirect technical contacts through the above two channels to promote the coordinated development of the regional economy. Both the extended neoclassical growth model with additional technological variables and the endogenous growth theory regard technological innovation as the fundamental source of economic growth. They believe that the improvement of production efficiency of products, and services and the reduction of production costs generated by technology improvement will bring sustained and long-term economic growth. From inter-provincial trade promoting technological innovation to technological progress leading to economic growth, this process will ultimately lead to long-term sustained growth of the national economy.
Similar to the core idea of Heckscher–Ohlin’s factor ratio theory, in the early stage of inter-provincial trade development, the provinces exchanged products and services because of the comparative advantage of factor endowment, which led to the industrial structure in the province tending to a specific factor combination mode. The industrial structure, with the dominant industry as the core, began to develop. With the further expansion of the scale of inter-provincial trade, provinces will improve their industrial structure through the inflow and outflow of inter-provincial products and services (Chang et al., 2014). The first path is to stimulate the development of the industry through the inflow of products. If the incoming goods are products that cannot be produced in the province, to achieve the sales of products and services in the province, related industries such as wholesale, retail, and transportation services will be driven to develop. At the same time, the new product as the object of imitation and research also makes it possible for the provincial enterprises to produce the product themselves; If the inflow of products for the province does not have a comparative advantage of products, this will have a competitive effect, stimulate the province’s enterprises through technology research and other ways to upgrade the product, to achieve the purpose of improving the industry. The second path, in the face of the market with greater potential, actively develops new products within the province, making full use of advanced technology, high-quality talents, etc. After the provincial market of new products is saturated, use inter-provincial trade to gradually open up the market in other provinces. Other provinces improve their industrial structure through the first path after the inflow of such new products. Then, a cycle of industrial structure upgrading composed of two paths is formed. The upgrading of the industrial structure is one of the important factors affecting China’s economic growth (Yi, 2021; Liu et al., 2018). In the process of continuous improvement of industrial structure, input factors flow from industrial sectors with low productivity or low productivity growth potential to industrial sectors with high productivity or high growth potential, driving the improvement of the overall productivity level (Sun and Xue, 2021). The clearer division of labor and more detailed industrial chain generated in the whole process also improve labor productivity. This positive flow between industries keeps the economy growing. Accordingly, this paper proposes:
H2: Inter-provincial trade acts on economic growth through the effect of technology improvement and the effect of industrial structure upgrading.
Heterogeneity about the mechanism of inter-provincial trade promoting economic growth
The influence mechanism of inter-provincial trade on economic growth may be different due to diverse regional development status, resource conditions, and system implementation (Li et al., 2023b).
First of all, from the perspective of the development goals and status quo of different regions, the original development model, which mainly relies on inter-provincial trade or international trade to support economic growth, and the current level of development, that is, the level of science and technology and the strength of the economy, both may greatly affect the performance of technology improvement as a mechanism of action. With an early start in development and strong economic strength, the eastern region of China takes international trade as the main pillar of economic growth and is ahead of the central and western regions in terms of comprehensive development strength (Li et al., 2019). Therefore, in the case that the knowledge and technology spillover from international trade may be the main source of scientific and technological level improvement in the eastern region, inter-provincial trade cannot bring more obvious scientific and technological level improvement. This means that the technology improvement mechanism of inter-provincial trade promoting economic growth may not be established in this region. Meanwhile, due to the high level of science and technology in the eastern region, these provinces may only be the subject of technology spillovers in the trade process rather than the subject of accepting positive spillovers, which will also lead to the invalidity of the intermediary mechanism. In contrast, as a potential area that the government has focused on development in recent years, it has gradually improved its trade environment and technical conditions. This kind of technology spillover brought by inter-provincial trade will be more easily absorbed by the central region. With the specific technological progress brought by it, the region will finally realize the improvement of the regional economic level. However, the establishment of a technology improvement mechanism in the western area is uncertain. Although the western area’s trade is mainly based on domestic trade and its development level has been greatly improved compared with its early stage, the large technological gap between the western region and the two regions, especially the eastern region, will affect its technology absorption capacity. This is a question that needs empirical research.
Secondly, regional differences in terms of trade and factor endowments may also have an impact on the role of industrial structure upgrading as an intermediary. The western region is limited by its remote geographical location, and its overall development is relatively backward compared with the eastern and central areas, with a low level of infrastructure improvement. Such adverse factors related to trade may directly limit the upgrading of industrial structures in the West. In addition, from the source of production factors, the extreme imbalance of factor endowment in the western region may also significantly inhibit the overall development of industrial structure by limiting the types of industries that can be developed. The eastern and central regions are likely to promote the industrial structure upgrading through inter-provincial trade because they benefit from relatively perfect transportation and balanced resources. However, considering that industries with regional competitive advantages are unable to upgrade because of the lack of incentives, the establishment of an industrial structure upgrading mechanism in the two regions may be affected. Therefore, this study believes that regional differences in eastern, central, and western China may lead to different situations regarding whether these two types of mechanisms are established in different regions, so the following hypothesis is proposed:
H3: As intermediary effects, technology improvement and industrial structure upgrading have regional heterogeneity.
Research design
Variables
Dependent variable
Economic growth (per_GDP)
Based on the practice of Rani and Kumar (2019) and Lv et al. (2020), this article uses the GDP per capita of each province to measure economic growth.
Independent variable
Inter-provincial trade (trade)
There is no single, precise way to measure inter-provincial trade. Among the model estimation methods that are used more widely, the gravity model, input-output model (Sun et al., 2020), mathematical programming model (Paris et al., 2011), and location quotient method (Jahn, 2017) are more frequently used. Based on the different calculation methods of trade friction coefficient, as a model with a long development period and clear logic, the application of the gravity model can be divided into three categories: transport volume distribution coefficient method (Kaukin et al., 2020), single point estimation method (Che et al., 2023) and cross entropy method. Considering the availability of data, complexity, and accuracy of the method, this paper uses the distribution coefficient method of traffic volume and the interregional gravity model to calculate the inter-provincial trade flow.
The transportation volume distribution coefficient method is a method proposed by Ihara (1996) that can be used to estimate the trade friction coefficient of products and services. This method assumes that the proportion of material delivery from a certain region to other regions is approximately equal to the proportion of product and service delivery from this region to other regions. The friction coefficient is defined as
\({Q}^{{{\rm {RS}}}}\) is the friction coefficient of product and service trade between R province and S province. \({H}^{{{\rm {RO}}}}\) is the total delivery volume of goods in R province. \({H}^{{{\rm {OS}}}}\) is the total arrival of goods in S province. \({H}^{{{\rm {RS}}}}\) is the volume of goods transported from R province to S province. \({H}^{{{\rm {OO}}}}\) is the total delivery volume of goods in all provinces (equal to the total arrival volume).
The variables on the right side of the equation are obtained by reasonable estimation based on the cargo exchange data between national railway administrative regions. Since the cargo transport volume of railway, road, and water transport accounts for a relatively high proportion of the total cargo transport volume of all transport modes, therefore, regarding the ratio of the sum of the three cargo transport volumes to the railway freight volume as the amplification factor. Then, enlarging the matrix data of cargo transport volume between provinces, that is the data of cargo exchange between railway administrative regions. And the matrix data of cargo delivery and arrival between provinces are obtained.
The interregional gravity model can be used to calculate the inter-provincial trade flow of products and services. The formula is as follows:
\({s}^{{\rm {R}}}\) is the total supply of products and services in province R. \({d}^{{\rm {S}}}\) is the total demand of products and services in province S. \(\sum {s}^{{\rm {R}}}\) is the total supply of products and services in all provinces. \({t}^{{{\rm {RS}}}}\) is the trade volume of products and services flowing from province R to province S. \({Q}^{{{\rm {RS}}}}\) is the friction coefficient, the definition is consistent with the above.
In this paper, the product and service demand of each province is defined as the domestic demand. Drawing on Yu’s (2013) practice, the total provincial supply, total provincial demand, and total supply of all provinces (taking R Province as an example) are as follows:
When calculating the net export data of the provinces, the import and export data divided by the destination and source of goods will be adjusted to the data calculated according to the FOB standard, and the service trade will be included in the data range, where:
As for the calculation of the total demand of a province, the net outflow data of goods and services should be used. Since the relevant departments no longer publish the data after 2017, this paper refers to the core idea of the transportation volume distribution coefficient method: It is assumed that the ratio of the net outflow of a certain region in the current year to the net outflow from the region in the previous year is similar to the proportion of the outflow of goods transportation in the corresponding year. The estimation formula is as follows:
\({{{\rm {RG}}}}_{{\rm {R}},t}\) is the total amount of goods sent between the national railway regions in R province except itself in t year.
Based on obtaining accurate inter-provincial trade data through calculation, to test the accuracy of the data, we compare inter-provincial trade with total retail sales of consumer goods in the unit of annual total. Figure 1 shows the results. Many literatures on domestic trade regard the total retail sales of consumer goods as a relatively reliable indicator that can represent domestic trade (Jin et al., 2021). This is not only because the development of domestic trade and the growth of total retail sales of consumer goods are mutually reinforcing, but also because retail sales of consumer goods are the last link in domestic trade activities for consumers. However, the total retail sales of consumer goods is a relatively narrow concept compared to domestic trade. The total retail sales of consumer goods are part of the retail sales of goods and services to consumers in the domestic trade, while the domestic trade includes the whole process of business activities from production to consumption. Combined with the above analysis, as reflected in Fig. 1, the inter-provincial trade volume (lntrade) and the total retail sales of consumer goods (lnretail_sales) in China have the same change trend, and the inter-provincial trade volume is higher than the total retail sales of consumer goods in the observable period. The data of inter-provincial trade we calculate are reliable.

This figure compares the trends of China's retail sales of consumer goods (lnretail_sales) and inter-provincial trade volume (lntrade) from 2000 to 2021 at the national level. The unit of data is RMB 100 million. Additionally, logarithmic procession is carried out for both types of data. The comparison results show that the change trend of the two is roughly the same.
Control variables
International trade (interna_trade)
Relevant studies show that trade openness is essential for high-quality economic development (Wang et al., 2023a). Meanwhile, as an important part of the national economy, the development of international trade has a great contribution to the growth of GDP. So, it is controlled in the main effect study as a secondary explanatory variable. In this paper, the total import and export volume of each province is selected as the index to measure the development level of international trade.
Technical input (patents)
In the theory of endogenous growth, rapid and sustained economic growth fundamentally benefits from technological innovation. Technology input is used as a control variable to measure how many emerging technologies are developed each year, and to what extent the investment in technology directly drives economic growth (Wang, 2011). In this paper, the acceptance of domestic invention patents is used as a proxy index.
Investment (cap)
As an important part of the GDP, the continuous injection of investment is the main driving force for economic growth, among which the investment in fixed assets like real estate plays a pivotal role in promoting the positive growth of the economy. Endogenous growth theory recognizes the decisive role of technology in economic growth, but a huge investment as the guarantee of technological innovation should also be fully considered when studying this effect. In this study, concerning the index selection of Mishra (2020), we use the total investment in fixed assets of the whole society to represent the annual investment level of each province.
Human capital (h_cap)
Many studies regard human capital as one of the important driving factors of economic growth (Rahman and Alam, 2021). Therefore, we draw on the research idea of Sohail and Yang (2022) and use the per capita years of education to measure the human capital level in each province and adopt the formula SCHOOLING = (uneducated × 1 + prime × 6 + middle × 9 + high × 12 + college × 15 + university × 16 + graduate × 19)/age_above6 to calculate the average years of schooling. prime, middle, high, college, university and graduate represent the population of elementary school, middle school, high school, junior college, undergraduate, and graduate students, respectively, uneducated represents the number of people aged 6 and above who have not been educated, age_above6 represents the population aged 6 years and above.
Data
This paper uses the panel data of 29 provinces (municipalities and autonomous regions) in China (except Hainan Province, Tibet Autonomous Region, Hong Kong Special Administrative Region, Macao Special Administrative Region, and Taiwan Province) from 2000 to 2021. The data are from the China Science and Technology Statistical Yearbook, China Statistical Yearbook, China Transportation Yearbook, and provincial and municipal statistical yearbooks. To ensure the smoothness of the data and eliminate the influence of heteroscedasticity and collinearity of the model, logarithmic processing of the variables is carried out. At the same time, to avoid the influence of extreme values and outliers, the data are indentured. The descriptive statistical analysis of each variable is shown in Table 1.
Model
Considering the large differences among provinces and regions, the fixed effect model is considered. Besides, from the perspective of empirical test results, the p-value of both the F-test and BP-test is 0.000, which confirms that the fixed effects model and random effects model are better than the POOL model. Meanwhile, the Hausman test’s results indicate that a fixed effects model rather than a random effects model should be used. Then, to avoid heteroscedasticity and sequence correlation problems, we use the clustering robust standard error for the model. The relevant test results are shown in Table 2. According to the above statement and the explanation of the selection of variables, this paper sets the following empirical model for studying the economic growth effect of inter-provincial trade:
Among this, i stands for province, t stands for time. \({\rm{lnper}}\_{\rm{GDP}}_{it}\) stands for the logarithm of i province’s per capita GDP in t year, \({\rm{lntrade}}_{it}\) stands for the logarithm of i province’s total trade volume in t year with other provinces except its own, \({{\rm{lninterna}}{\_}{\rm{trade}}}_{it}\) stands for the logarithm of i province’s total import and export trade volume in t year, \({\rm{lnpatents}}_{it}\) represents the logarithm of the number of accepted invention patent applications in i province in t year, \({\rm{lncap}}_{it}\) represents the logarithm of the total investment in fixed assets of the whole society in i province in t year, \({{\rm{lnh}}{\_}{\rm{cap}}}_{it}\) represents the logarithm of the average years of education in i province in t year, \({\mu}_{i}\) is the fixed effect of the province, \({\lambda}_{t}\) is the fixed effect of the year, \({\varepsilon}_{it}\) is the random error term.
Empirical findings
Baseline regression
Table 2 shows the estimated results of the impact of inter-provincial trade on the economic growth of each province. By gradually introducing each explanatory variable, it is not difficult to find that the estimated coefficient and significance level of each variable have not changed significantly, which indicates that the influence effect of each variable has good stability. The regression results show that: First, the coefficient of inter-provincial trade is significantly positive. During the sample period, every 1% increase in inter-provincial trade will increase per capita GDP by 0.19%. The development of inter-provincial trade significantly promotes economic progress. All provinces trade in goods and services through large domestic markets, which brings comparative advantages to improve the division of labor among provinces and promote the realization of inter-regional industrial transfer. Meanwhile, the technology spillover effect between different provinces improves production efficiency and product quality, thus promoting economic growth. The baseline regression results confirm hypothesis 1. Second, the coefficients of control variables such as international trade, investment, and human capital are significantly positive, which is similar to the existing research conclusions and in line with theoretical expectations. The international trade coefficient is significantly positive. Trade exchanges in the international market can introduce advanced technology and management experience, and achieve economic growth by reducing production costs and improving the efficiency of all links. The coefficient of technical input is positive. The corresponding technological input can effectively promote economic growth, increase scientific and technological input, and strengthen the transformation of innovation results into real productivity, which is an important source of power for the sustained growth of China’s economy. The human capital coefficient is significantly positive. The accumulation of human capital is conducive to long-term economic growth. The emergence of more and more high-quality labor can not only improve the overall efficiency of inter-provincial trade but also increase the possibility of technological innovation to a certain extent. These action paths make human capital become one of the main factors promoting economic growth.
Robustness test
The above empirical results show that the progress of inter-provincial trade can positively affect the economic growth. However, there are possibilities such as potential index selection bias and measurement errors which could lead to incorrect conclusions. Therefore, the following robustness tests need to be performed.
Robustness tests 1 and 2
In the baseline regression, the model chooses to use per capita GDP to reflect the degree of economic growth. To enhance the reliability of the results, robustness test 1 selection replaces the dependent variables per capita GDP with gross regional domestic product. In addition, as for the research on the effect of inter-provincial trade on economic growth, the previous literature mostly measured the level of economic growth by income, so we chose to replace the variable per capita GDP with per capita disposable income to complete the robustness test 2 of the basic model. In the two tests, logarithm and tail reduction were performed on the data. The regression results are shown in Table 3(1) and (2). The increase in inter-provincial trade flow will promote economic growth, while the expansion of international trade, the increase of investment, and the continuous improvement of human capital level can have a positive impact on economic development. The direction and significance of the variables’ coefficients are almost unchanged, which effectively supports the basic conclusions obtained above.
Robustness test 3
As an important economic index, population migration can affect the development of regional resources and production activities and then have an impact on economic development. The explained variable in the baseline regression is the indicator that has been treated on a per-capita basis. The effect of population migration is ignored, which weakens the credibility of the results to some extent. For example, a large number of people migrating into a province may increase the gross regional product but also may decrease the GDP per capita. Hence, to verify that population migration does not affect the conclusions drawn above, robustness test 3 refers to the research conclusion of Gu et al. (2022) and divides all provinces into in-migration areas and out-migration areas. The results in Table 3(3) and (4) show that the coefficients of inter-provincial trade in the two regressions are significantly positive. The in-migration or out-migration of the population does not affect the function of inter-provincial trade in promoting economic growth.
Robustness test 4
Given the description of domestic trade and total retail sales of consumer goods in the variable section above, this paper uses the method of replacing the total amount of inter-provincial trade with the total retail sales of consumer goods (\({\rm{lnretail}}{\_}{\rm{sales}}\)) to re-estimate the model. The robustness test results of Table 3(5) show that the expansion of the inter-provincial trade scale and the increase of trade volume will still promote economic growth. The improvement of the scale of international trade, the total amount of investment, and the quality of human capital are conducive to the sustainable development of the regional economy, indicating that the benchmark regression results are stable and reliable.
Endogeneity test
The above quantitative analysis fails to fully consider endogeneity. There may be a reverse causality between the progress of inter-provincial trade and economic growth. The provinces with higher levels of economic development have sufficient capital to optimize their terms of trade, such as improving transportation infrastructure. Or the more flexible supportive policies of the region may attract other provinces to trade with it, to take the positive political spillover effect. Economic growth may have a reverse impact on inter-provincial trade. Although some scholars have built indicators as basic data and then conducted IV tests to negate the hypothesis that there is a two-way causal relationship between domestic trade and economic growth (Frankel and Romer, 1999), it still needs more rigorous proof whether inter-provincial trade will be affected by economic growth. Additionally, the variables selected and estimated above are only obtained through artificial statistics and operations, which will inevitably deviate from the real value. The existence of these two kinds of issues may lead to endogenous problems. Therefore, this paper draws on the treatment method of Tian et al. (2020) and selects the lag period of inter-provincial trade as the instrumental variable to conduct endogeneity test 1. Considering the externality, the inter-provincial trade variable that lags one period is the historical data that is not affected by the current economic development, which satisfies the externality. From the perspective of correlation, the lag period of inter-provincial is affected by the demand structure of all parties and the trade transportation network. It has certain continuity and stability, that is, it has a high correlation with this variable in the current period. The results are shown in Table 4(1) and (2).
In addition to the core independent variable with a lag of one period as the instrumental variable, referring to the method of Lin (2017), the instrumental variable of inter-provincial trade, namely domestic market convenience (DMC) and domestic trade constraint (DTC), were constructed based on the geographical environment characteristics of each province. Those are endogeneity tests 2 and 3. Since geographic variables a quantity that does not change with time, to reflect dynamic characteristics and ensure the realization of individual fixed effect and time fixed effect, referring to the processing method of Fenske et al. (2023), we multiply the instrumental variable that does not change with time by an exogenous variable that changes with time. For endogeneity test 2, first, take the reciprocal of the river density (in kilometers per square kilometer) of each province, and then multiply by year to form the variable DMC. The regression results are shown in Table 4(3) and (4). The IV strategy of endogenous test 3 is to take the topographic relief of each province as the core index to measure the degree of domestic trade constraints. Meanwhile, the exchange rate of RMB against the US dollar is multiplied by topographic relief as the final instrumental variable DTC. Table 4(5) and (6) show the test results.
According to the estimation results of the two-stage least square method (2SLS), all three instrumental variables have a high correlation with the core independent variables. Moreover, on the basis of the research method in the available literature, with 10 as the reference value, the minimum eigenvalue statistic of the three endogeneity tests is greater than 10, rejecting the null hypothesis of a weak instrumental variable. Their Kleibergen–Paap rk LM statistics are all significant at the level of at least 5%, indicating that there is no insufficient identification problem of instrumental variables. The instrumental variables selected in this paper are reasonable and effective. The regress results in Table 4 show that the promotion effect of inter-provincial trade on economic growth is still valid, which is consistent with the results of baseline regression. The conclusions have not fundamentally changed.
Comparative analysis
The promotion effect of China’s inter-provincial trade on economic growth is still valid after the robustness tests and the endogeneity tests. In fact, different from the cognitive default that trade development can promote economic growth, the promotion effect of inter-provincial trade on economic growth is a specific performance under China’s unique environment, conditions, and foundation. This is because the positive relationship between the two objectives is uncertain in other economies that are also expanding their domestic trade. For example, in recent years, relevant governments and organizations have promoted the integration process of the Common Market for Eastern and Southern Africa (COMESA) to promote intra-regional trade flows and reduce dependence on external economies. However, relevant studies have shown that this regional integration has not had a significant impact on economic growth (Liu et al., 2021). Therefore, to deepen the comprehension of the relationship between inter-provincial trade and economic growth in China, we examine and analyze the mechanism and heterogeneity of the two based on the actual situation of different regions in China.
Mechanism test
The above content explores the positive impact of inter-provincial trade on economic growth. Based on this, the mechanism is further tested from the perspective of technological progress and industrial structure upgrading.
Firstly, the intermediary effect of technology improvement. To accurately identify the existence of the mechanism of action and verify the rationality of theoretical analysis, taking technology improvement as an intermediary variable to explore whether inter-provincial trade has a positive effect on economic growth because of technology improvement. This paper chooses total factor productivity to represent technology improvement. Besides, to explore the differences of this mechanism in different regions in China in more detail and analyze how to give full play to the economic promotion role of inter-provincial trade across the country, the sample provinces are divided into three regions for regression. The classification criteria refer to the method of the National Bureau of Statistics of China. The eastern part is defined as 11 provinces or regions, including Beijing, Tianjin, Hebei, Shanghai, Jiangsu, Zhejiang, Fujian, Shandong, Guangdong, Liaoning, and Guangxi. The central part is defined as 9 provinces or regions: Shanxi, Anhui, Jiangxi, Henan, Hubei, Hunan, Heilongjiang, Jilin, and Inner Mongolia. The western part is defined as 9 provinces or regions: Chongqing, Sichuan, Guizhou, Yunnan, Shaanxi, Gansu, Qinghai, Ningxia, and Xinjiang. This thesis draws on the research idea of Jiang (2022) on mediating effects based on baseline regression and proposes mediating variables that have a direct impact on explained variables. The model built with core independent variables and mediating variables is as follows:
where \({\rm{T}}\_{\rm{progress}}_{{it}}\) is the intermediary variable for measuring technology improvement, and it represents the TFP of i province in t year. The remaining variables are consistent with those in baseline regression. Table 5(1), (3), (5), and (7) report the regression results.
Table 5 shows that, during the sample period, technology improvement as an intermediary mechanism works nationwide. The coefficient of the explanatory variable in the ‘Entirety’ regression is 0.074 at the 5% level. At the same time, the coefficient of the inter-provincial trade variable is 0.153 and 0.217 in the central and western regions, respectively. And both of them are significant at the level of at least 5%. Similarly, through the visual comparison of the inter-provincial trade regression coefficients of each group in Fig. 2, it can also be seen that technology improvement is an effective mechanism for inter-provincial trade to promote economic growth in the central and western regions. Nevertheless, the regression results of the eastern region negate the hypothesis that this mechanism can be established in this region.

This figure compares core explanatory variable (lntrade) coefficients under the Entirety, East, Middle, and West regressions in the empirical test of technology improvement mechanism. The vertical axis shows the magnitude, plus or minus of the coefficients of the core explanatory variables, and the value 0 is indicated by a dotted line as the cut-off point for positivity. The horizontal coordinate represents the four different groups, and we use four different colors here for easy observation. The four points are the values of the core explanatory variables in the corresponding four sets of regressions, and the confidence interval is 95%. Among them, the coefficient of core explanatory in the Entirety, Middle, and West is positive, while the coefficient of core explanatory variable in the East is negative. The four values in descending order are West, Middle, Entirety, and East. This reveals that the technology improvement, as an intermediary mechanism for inter-provincial trade to promote economic growth, is established in the overall, middle, and western regions, but not in eastern region.
About the selection of indicators, the selection of TFP to represent technological improvement may lead to uncertainty in the results. Some non-technical advancement changes like the enhancement of organizational management ability and the realization of scale effects in enterprise production, may lead to the increase of TFP. Therefore, to avoid potential error, this part further uses the proportion of local financial expenditure on science and technology in the general budget expenditure of local finance (do the log transform) to measure the technology improvement of each province. Limited by the period of official data, the indicators start in 2007. The regression model is the same as formula (4). The test results in Table 5(2), (4), (6), and (8) show that the symbol and significance of the inter-provincial trade coefficient have not changed significantly either in the whole or in each region. The above test results of the mechanism of technological progress are accurate.
Secondly, the intermediary effect of industrial structure upgrading. According to the conclusion of benchmark regression, as long as inter-provincial trade can promote the upgrading of industrial structure, the upgrading of industrial structure is established as a mechanism. Referring to the practice of Xing and Ye (2022) and Gu et al. (2022), this thesis chooses the ratio of the added value of tertiary industry to the added value of secondary industry as the index of industrial structure upgrading. The construction model is as follows:
Among them, \({\mathrm{ln}{{\rm{Indus}}\_{\rm{structure}}}}_{{it}}\) is the intermediary variable to measure the upgrading of industrial structure, representing the logarithm of the ratio between the added value of the tertiary industry and the added value of the secondary industry of i province in t year. The remaining variables are consistent with the baseline regression.
Regressing the sample combinations by region, the results are shown in Table 6(1), (2), (3) and (4). From 2000 to 2021, the intermediary effect of industrial structure upgrading is established across the country. In the empirical tests of the eastern and central regions, their independent variables’ coefficients are 0.242 and 0.401, which are both statistically significant. It supports that the inter-provincial trade significantly promotes the upgrading of industrial structure, and the industrial structure upgrading is established in these two areas as a mechanism for inter-provincial trade to exert the effect of economic growth. However, in the regression of the western area, the coefficient of inter-provincial trade is not significant, which shows that this mechanism is not valid in this region. The same conclusions can also be drawn through the direct comparison of the inter-provincial trade regression coefficients of the four groups in Fig. 3.

This figure compares core explanatory variable (lntrade) coefficients under the Entirety, East, Middle, and West regressions in the empirical test of industrial structure upgrading mechanism. The vertical axis shows the magnitude, plus or minus of the coefficient of the core explanatory variables, and the value 0 is indicated by a dotted line as the cut-off point for positivity. The horizontal coordinate represents the four different groups, and we use four different colors here for easy observation. The four points are the values of the core explanatory variables in the corresponding four sets of regressions, and the confidence interval is 95%. Among them, the coefficient of core explanatory variables in the Entirety, East, and Middle is positive, while the coefficient of core explanatory variables in the West is negative. The four values in descending order are Middle, East, Entirety, and West. This reveals that the industrial structure upgrading, as an intermediary mechanism for inter-provincial trade to promote economic growth, is established in the overall, eastern, and middle regions, but not in western region.
During the sample period, since the average value of the ratio of primary industry’s output value to regional GDP is much smaller than the average value of secondary and tertiary industries to regional GDP, the added value of the secondary and tertiary industries is chosen above to represent the industrial structure upgrading. However, to ensure the accuracy of the results and consider the possible influence caused by the primary industry, we conduct another test on the western region, where the primary industry’s output value accounts for the largest proportion. Considering the method of Wang et al. (2023b), the IS (Industrial structure upgrading) index, which covers all three industrial characteristics, is constructed as the intermediary variable. The model is similar to Eq. (5) and the regression results are shown in Table 6(5). The establishment of the industrial structure upgrading mechanism in the western region is the same as above. The feature of primary industry has no impact on the empirical results.
In general, inter-provincial trade acts on economic growth through the effect of technology improvement and the effect of industrial structure upgrading, and the two mechanisms have regional heterogeneity. Hypotheses 2 and 3 have been confirmed.
Discussion
Technology improvement mechanism
Based on sound empirical tests, our study concludes that inter-provincial trade cannot improve economic development by promoting technology improvement within the eastern region. There are three possible reasons for this result: First, as a region with a higher level of science and technology, the eastern part can only receive a smaller spillover effect of technology from other provinces through trade. Similar to the core idea of the reverse technology spillover effect, when the central and western regions engage in inter-provincial trade with the eastern region, they will be exposed to the reverse technology spillover through contact with advanced production technology and strict production standards, thus improving the scientific and technological level (Liu and Fan, 2020). However, this will not bring positive technology spillover to the eastern region that can improve its technical level. Second, the improvement of the scientific and technological level in the eastern region is mostly caused by the technology spillover effect of international trade. According to previous studies like Li et al. (2020), most provinces in eastern China are located in coastal areas. Their superior geographical location provides convenience for their development of international trade. Meanwhile, in terms of supporting policies, both the early basic national policy of ‘Reform and Opening Up’ and the recent strategy of ‘21st Century Maritime Silk Road’ have further promoted the development of its international trade. Trade openness has effectively driven the economic growth of the region, and eventually, international trade has become the main driver of the region’s economy. The import of foreign superior products provides enterprises in the Eastern region with the opportunity to learn and master advanced technologies, making it possible to imitate or even copy technologies unmastered previously. The high proportion of international trade in the eastern region limits the inter-provincial trade to play its role in promoting technology improvement. Third, against the backdrop of the global economic downturn, China is paying more attention to the development of domestic trade. This means that the eastern provinces should put more resources into inter-provincial trade. This kind of resource tilt from international trade to inter-provincial trade will restrain the knowledge and technology spillover effect of international trade in the short term. Simultaneously, due to the initial stage of development, the role of technology improvement of inter-provincial trade cannot work quickly in the short term. The two will lead to a slowdown in the pace of technological advancement in the eastern region.
Different from the results of the eastern area, the technology improvement mechanism is established in the central area and western area. This is due to their strong technology absorption capacity and good technological innovation foundation. The central region of China is rising under the guidance of corresponding policies. Its relatively perfect infrastructure, gradually mature financial market, and appropriate technological gap between it and the eastern region all provide the basis for inter-provincial trade to promote technological progress (Wang et al., 2024a). The western region is benefiting from the ‘Great Western Expansion’ strategy. The improvement of regional openness makes the region more exposed to advanced technology and management experience. Besides, facing the technology spillover effect brought by inter-provincial trade, the increase in human capital level brought by the introduction of talents also helps provincial enterprises to realize the transformation to the actual level of science and technology. Figure 4 summarizes the relevant results and analysis of the technology improvement mechanisms.
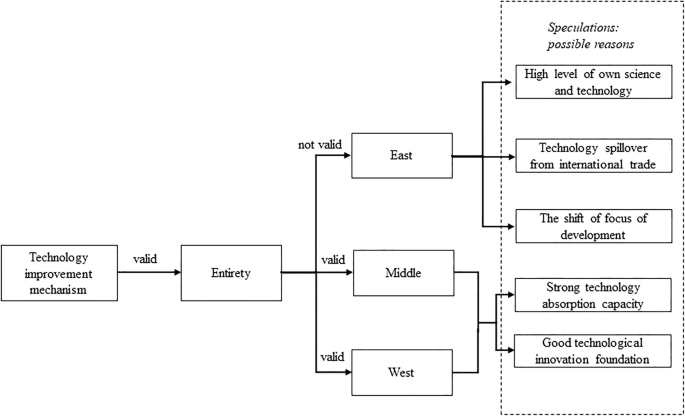
This figure shows whether the mechanism of technology improvement is established in the overall, eastern, middle, and western regions, and outlines the possible reasons for these conditions. Among them, the technology improvement mechanism is established in all regions except the East part.
Industrial structure upgrading mechanism
According to the results of Table 6, we suppose that the industrial structure upgrading mechanism cannot play a role in the western area, and this may be due to the following five reasons: First, the level of transport infrastructure development in the western region is not advanced enough. Compared with the eastern and central regions, both the transport level and the growth potential are lagging. It weakens the enthusiasm of other provinces to trade with the western region. This reduction in trade exchange will inhibit the progress of the comparative advantage industry in the Western region by reducing the outflow of comparative advantage products. Besides, it will also reduce the possibility of other provinces transferring their high-end mature industries to Western provinces. Both of them will hinder the Western region’s industrial chain from climbing to the high end and inhibit the upgrading of the industrial structure in the Western region (He and Duchin, 2009). Moreover, the upgrading of the industrial structure essentially involves the redistribution of resources. Underdeveloped transportation infrastructure will reduce the flow of factors and the efficiency of allocation, which will also decrease the possibility of upgrading the industrial structure. Second, the resource endowment of the western region is unbalanced. Some resources, such as energy resources and mineral resources, occupy a prominent position in the whole country. While the amount of other resources in the western region is small. Hence, it is easier for it to develop an industrial system which has a strong dependence on resources, dominated by energy, chemical, and mineral resources (Qiu and Zhang, 2023). The possibility of multiple industries developing commonly or service-oriented tertiary industries evolving is small. Third, inter-provincial trade can affect the upgrading of industrial structure through the change in consumer demand. The population density in the western region is small, and the consumption demand with few changes cannot stimulate more development of demand product sectors. Besides, in the Western region, education, research, management, and other resources are limited. Consequently, when other provinces choose high quality, lower prices, and various types of products from other regions due to changes in consumer demand, it is particularly difficult for the western region to rely on sufficient but unabundant resources to achieve product optimization and then complete the upgrading of industrial structure (Yang, 2017). Fourth, because of the geographical location, short history of modern industry, and capital scarcity, the western region has a comparative advantage in the primary and secondary industries, while the central and eastern regions have a comparative advantage in the tertiary industry. Due to the relatively passive position in the regional division of labor, there is little choice for the industrial structure of the western region to transform and upgrade itself (Yan and Qin, 2015). Fifth, the industrial relocation from the eastern region to the western region hurts industrial structure upgrading in the western region. Industrial relocation (industrial transfer) refers to the economic phenomenon of industrial transfer between regions with different economic development levels. Since the international financial crisis in 2008, with the rising costs of factors like labor and land, and the tightening of environment protection constraints, the energy-intensive and high-emission industries in the eastern area have gradually transferred to the western area. As pointed out by Qi and Peng (2019) and Li and Li (2021), China’s inter-regional carbon emission transfers from economically developed regions, especially the decline of carbon intensity in the eastern region and the rise of carbon intensity in western regions, confirm the existence of such industrial transfer. Additionally, the progress of inter-provincial trade has strengthened the formation of a unified domestic market, and the more open and convenient trade environment has facilitated the transfer of non-sustainable industries in the eastern region. Facing the energy-intensive and high-emission industries, the western region not only needs to solve the problem of how to effectively undertake these industries but also needs to consider how to transform the high energy consumption industries into their development competitiveness under the background of national ‘Carbon Peaking and Carbon Neutrality Goals’. These issues greatly inhibit the western region’s industrial structure to a higher level of optimization.
In the eastern and central areas, the industrial structure upgrading mechanism is practicable. Compared with the western region, the higher economic level of eastern and central regions determines their strong industrial structure upgrading foundation and potential. Better infrastructure, capital accumulation, and market demand all contribute to industrial upgrading and transformation. Furthermore, through the average value of total factor productivity (East: 0.99, Middle: 0.65, West: 0.55) in the sample period, it can be seen that, as the crucial driving force to promote the industrial structure upgrading, the eastern and western regions with higher scientific and technological level can promote the generation of new products and new services, and facilitate the development of traditional industries to a more advanced and modern direction. Moreover, from the perspective of enterprises, more large enterprises and small and medium-sized companies are located in the eastern and central areas. Whether the strong market competitiveness and risk resistance of large enterprises or the vitality and innovation ability of small and medium-sized enterprises play a key role in the regional industrial structure upgrading. Figure 5 summarizes the relevant results and analysis of the industrial structure upgrading mechanisms.
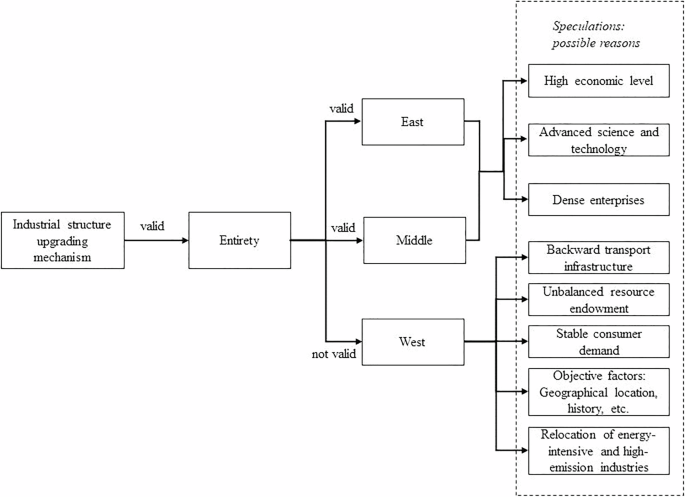
This figure shows whether the mechanism of industrial structure upgrading is established in the overall, eastern, middle, and western regions, and outlines the possible reasons for these conditions. Among them, the industrial structure upgrading mechanism is established in all regions except the West part.
Limitations
This study has some limitations. Since there is no official data with a proper definition, we choose the transport distribution coefficient method and the interregional gravity model to calculate the inter-provincial trade volume. Regarding the coefficient of distribution of traffic volume method: Firstly, the method assumes that the proportion of the distribution of the volume of material transported from one area to other areas is similar to the proportion of important goods and services. Nevertheless, ‘material’ and ‘goods and services’ are not the same. Material refers to concrete, tangible products. Goods and services include not only physical products but also a series of services that ensure the usage of products and enhance the consumer experience. The exclusion of services will lead to a deviation in the calculation of the friction coefficient. Secondly, when using the cargo transport matrix, considering the small proportion of the volume about them, we did not include the volume of cargo transported by air and pipeline. This affects the coefficient of friction by affecting the amplified volume of goods transported and, ultimately, the inter-provincial trade flows. As for the inter-regional gravity model: Due to the processing of net outflow data by relevant departments, we have assumed in this section for the indicator after 2017 that “the ratio of net outflow in a region in the current year to the net outflow in the region in the previous year is similar to the proportion of cargo transportation outflows in the region in the current year”, but this may be different from the reality. If the net outflow we estimated is greater than the actual value of it, the total demand of the province will be smaller. Then, if the estimated net outflow is smaller than the actual value, the total demand of the province will be too large. Either case will influence the estimate of the scale of inter-provincial trade. Finally, the selection of estimation methods and the estimation of relevant variables may lead to the accumulation of errors, which may lead to certain deviations in the results. Based on possible workload, future studies could be carried out by choosing data that are more consistently defined, published over a longer period, or by taking into account the exchange of goods across all transport channels as much as possible. As Li et al. (2022b) pointed out, the use of VAT invoice data may be a promising research direction.
Conclusion
This paper explores the impact of inter-provincial trade on economic growth, its mechanisms, and the heterogeneity in China. We empirically test the panel data from 2000 to 2021. The results show that inter-provincial trade promotes economic growth, and the outcomes pass a series of robustness tests and endogeneity tests. Similar to the research result of Yang (2023) on domestic market integration and economics, this finding affirms the role of inter-provincial trade in promoting economic growth. This conclusion also provides a basis for the government to further promote domestic circulation. In addition, we also test the theoretical mechanism of the impact of inter-provincial trade on economic growth. We find that at the national level, inter-provincial trade leads to the expansion of the market and the deepening of labor division, generates the technology improvement effect and industrial structure upgrading effect, and then promotes the advancement of the regional economic level. It provides a new perspective on understanding how inter-provincial trade drives economic growth. Next, just as Miao et al. (2024) believe that regional heterogeneity exists in the mechanism of action when studying the effects of agricultural market integration on regional economic progress, we discuss heterogeneity of the mechanism of action between inter-provincial trade and economic growth. We find that the mechanism of technology improvement is only established in the central and western regions; The industrial structure upgrading mechanism is established only in the eastern and central regions. This finding suggests that policymakers need to take into account the specific conditions of different regions and formulate differentiated inter-provincial trade development policies to maximize its potential benefits.
This study not only provides new theoretical and empirical evidence for comprehending the complex relationship between inter-provincial trade and economic growth but also provides a valuable reference for local governments to formulate economic policies in the context of the dual circulation development pattern. In addition, as the main body of this paper, inter-provincial trade and economic growth are at the intersection of many research topics, such as market integration, green growth, spatial analysis, innovative human capital, etc. Our research conclusions of this paper will lay a theoretical foundation for the subsequent research on related topics.
Policy implications
Based on the above conclusions, we put forward the following suggestions: (1) As a whole, since inter-provincial trade can promote economic growth, the country should continue to vigorously accelerate the development of inter-provincial trade based on maintaining the stability of international trade. (2) If the eastern region wants to achieve sustained and high-quality economic development through inter-provincial trade, the key is to make good use of the mechanism of industrial structure upgrading. In the process of trade, the region should make full use of advanced transportation infrastructure and abundant resource endowments, and play the role of industrial structure upgrading as an intermediary mechanism. Additionally, for the technological progress mechanism to work, the eastern region should strengthen its scientific and technological exchanges with other regions and reduce its dependence on international technology spillovers. Meanwhile, to properly deal with the resource allocation problem, policymakers should introduce guiding policies to help the eastern region smoothly through the painful period of the transformation of trade development mode. (3) The central region should continue to improve its scientific and technological level. Based on the existing good momentum of development, it ought to further create conditions for technology improvement and industrial structure upgrading. (4) During the trade process, the Western region should make full use of the existing scientific and technological development basis, constantly enhance the absorption and utilization of technical knowledge, and make the intermediary role of technology improvement work. In addition, the western region needs to improve the level of infrastructure. Regional governments need to formulate appealing training measures and development policies to attract quality talent and investment, laying the foundation for the realization of industrial structure upgrading. (5) Although the development of inter-provincial trade is crucial, carbon transfer and carbon leakage, which are key factors affecting sustainable economic development, should also be given priority consideration (Dong et al., 2022). Facing the carbon peaking and neutrality goals of China, local governments should upgrade existing emission measurement standards to take into account the development of inter-provincial trade, economic progress, and emission reduction. Finally, based on the results of each region, specific countermeasures, and development targets for the next stage are formulated.
Scope for future study
In future studies, other forms of communication, like digital trade, could be considered for inclusion in the analytical framework to more fully understand the full picture of inter-provincial trade and its impact on economic growth. Meanwhile, researchers can expand the study of regional heterogeneity in this paper to explore the mechanism of inter-provincial trade under different geographical, cultural, and economic backgrounds. For example, compare the differences in trade patterns between coastal and inland provinces, or how special trade policies in frontier areas affect their economic development. Additionally, future studies can adopt a more micro perspective, such as firm-level or industry-level data, to explore the specific impact of inter-provincial trade on firm production and innovation activities. Eventually, as globalization and technological innovation continue to evolve, exploring how emerging phenomena such as global value chain integration, cross-border e-commerce, artificial intelligence, and green trade initiatives reshape the relationship between inter-provincial trade and economic growth will provide new perspectives and strategies for promoting balanced and sustainable economic development (Wang et al., 2024b).
Data availability
All data generated or analyzed during this study are included in this published article and its supplementary information file (‘Supplementary Data’). We have organized the data as necessary to make it easier for people to view and use. About more specific and original data to be obtained, the dataset of economic life and social development of each province is from the China Statistical Yearbook (https://kns.cnki.net/knavi/yearbooks/YINFN/detail?uniplatform=NZKPT) and the China Science and Technology Statistical Yearbook (https://kns.cnki.net/knavi/yearbooks/YBVCX/detail?uniplatform=NZKPT). The basic data of inter-provincial trade volume come from the China Statistical Yearbook (https://kns.cnki.net/knavi/yearbooks/YINFN/detail?uniplatform=NZKPT) and China Transportation Yearbook (https://kns.cnki.net/kcms2/article/abstract?v=gR09I6yibQ7M52E8BB0tsOo5jnlRPU1YieO2gQrcb77GiIsnBIvDI9AqQN4CCLtQU8bRki7xZuVU_6fT2nw_QVjviXOKibpk2hPEmEhkx-wJj7NqMSanqg==&uniplatform=NZKPT).
References
Bloom N, Draca M, Reenen JV (2016) Trade induced technical change? The impact of Chinese imports on innovation, IT and productivity. Rev Econ Stud 83(1):87–117. https://doi.org/10.1093/restud/rdv039
Chaney T, Ossa R (2013) Market size, division of labor, and firm productivity. J Int Econ 90(1):177–180. https://doi.org/10.1016/j.jinteco.2012.11.003
Chang D, Yeh L, Chen Y (2014) The effects of economic development, international trade, industrial structure and energy demands on sustainable development. Sustain Dev 22(6):377–390. https://doi.org/10.1002/sd.1555
Che Z, Kong M, Wang S, Zhuang J (2023) How does the COVID-19 pandemic impact internal trade? Evidence from China’s provincial-level data. Sustainability 15(14):1–24. https://doi.org/10.3390/su151410769
Damijan J, Kostevc C (2015) Learning from trade through innovation. Oxford Bull Econ Stat 77(3):408–436. https://doi.org/10.1111/obes.12071
Dong B, Xu Y, Li Q (2022) Carbon transfer under China’s inter-provincial trade: evaluation and driving factors. Sustain Prod Consum 32:378–392. https://doi.org/10.1016/j.spc.2022.04.031
Felbermayr G, Steininger M (2019) Revisiting the Euro’s trade cost and welfare effects. Jahrb Nationalökon Stat 239:917–956. https://doi.org/10.1515/jbnst-2019-0015
Fenske J, Kala N, Wei J (2023) Railways and cities in India. J Dev Econ 161:103038. https://doi.org/10.1016/j.jdeveco.2022.103038
Ferrarini B (2012) International trade, domestic market potential and income in developing Asia. J Asia Pac Econ 17(1):127–137. https://doi.org/10.1080/13547860.2012.640012
Frankel J, Romer D (1999) Does trade cause growth? Am Econ Rev 89(3):379–399. https://doi.org/10.1257/aer.89.3.379
Gu H, Lao X, Wen F, Zhao Z (2022) Spatiotemporal patterns and determinants of interprovincial migration in China between 2000 and 2020. Acta Geogr Sin 77(12):3041–3054. https://doi.org/10.11821/dlxb202212007
Gu R, Li C, Li D, Yang Y, Gu S (2022) The impact of rationalization and upgrading of industrial structure on carbon emissions in the Beijing–Tianjin–Hebei urban agglomeration. Int J Environ Res Public Health 19(13):7997. https://doi.org/10.3390/ijerph19137997
He L, Duchin F (2009) Regional development in China: interregional transportation infrastructure and regional comparative advantage. Econ Syst Res 21(1):3–22. https://doi.org/10.1080/09535310802703395
Hong T, Yu N, Storm S, Gao B (2019) How much does regional integration contribute to growth? An analysis of the impact of domestic market integration on regional economic performance in China (1997–2011). Econ Res-Ekon Istraž 32(1):3189–3210. https://doi.org/10.1080/1331677X.2019.1592006
Ihara T (1996) Economic analysis of region. Central Economic Agency
Jahn M (2017) Extending the FLQ formula: a location quotient-based interregional input–output framework. Reg Stud 51(10):1518–1529. https://doi.org/10.1080/00343404.2016.1198471
Jiang T (2022) Mediating effect and moderating effect in causal inference. China Ind Econ 05:100–120. https://doi.org/10.19581/j.cnki.ciejournal.2022.05.005. (in Chinese)
Jin G, Yu B, Shen K (2021) Domestic trade and energy productivity in China: an inverted u-shaped relationship. Energy Econ 97(C):105234. https://doi.org/10.1016/j.eneco.2021.105234
Kaukin AS, Tomaev A, Pavlov P (2020) Russian domestic trade: applying the gravity mode for rail cargo flows. Econ Policy 5:60–89
Ke S (2015) Domestic market integration and regional economic growth—China’s recent experience from 1995–2011. World Dev 66(C):588–597. https://doi.org/10.1016/j.worlddev.2014.09.024
Li M, Zhang L, Zhang Z (2023a) Impact of digital economy on inter-regional trade: An empirical analysis in China. Sustainability 15(15):1–22. https://doi.org/10.3390/su151512086
Li P, Li L, Zhang X (2019) Regional inequality of firms’ export opportunity in China: geographical location and economic openness. Sustainability 12(1):1–16. https://doi.org/10.3390/su12010009
Li P, Li L, Zhang X (2020) Regional inequality of firms’ export opportunity in China: geographical location and economic openness. Sustainability 12(1):1–16. https://doi.org/10.3390/su12010009
Li R, Li L, Wang Q (2022a) The impact of energy efficiency on carbon emissions: evidence from the transportation sector in Chinese 30 provinces. Sustain Cities Soc 82:103880. https://doi.org/10.1016/j.scs.2022.103880
Li R, Wang Q, Guo J (2023b) Revisiting the Environmental Kuznets Curve (EKC) hypothesis of carbon emissions: exploring the impact of geopolitical risks, natural resource rents, corrupt governance, and energy intensity. J Environ Manag 351:119663. https://doi.org/10.1016/j.jenvman.2023.119663
Li Y, Li H (2021) China’s inter-regional embodied carbon emissions: an industrial transfer perspective. Environ Sci Pollut Res 29:4062–4075. https://doi.org/10.1007/s11356-021-15694-5
Li Z, Yang R, Huang G (2022) Research on inter-provincial trade estimation and trade barriers of China. Econ Res J 57(7):118–135 http://hdl.handle.net/20.500.11897/656840 (in Chinese)
Lin F (2017) Trade openness and air pollution: city-level empirical evidence from China. China Econ Rev 45(C):78–88. https://doi.org/10.1016/j.chieco.2017.07.001
Lin Y (2021) Dual circulation and China’s development. Front Econ China 16(1):30–34. https://doi.org/10.3868/s060-013-021-0002-7
Liu H, Xie Z, Song X (2018) The impact of industrial structure change on economic growth. In: Xu, J., Gen, M., Hajiyev, A., Cooke, F. (eds) Proceedings of the Eleventh International Conference on Management Science and Engineering Management (ICMSEM 2017) pp. 522–529. https://doi.org/10.1007/978-3-319-59280-0_42
Liu H, Yahia Y, Hossain M, Shah S (2021) The effect of integration processes of the Common Market for Eastern and Southern Africa on the economic growth of the member states. Int J Finance Econ 28(01):93–111. https://doi.org/10.1002/ijfe.2407
Liu N, Fan F (2020) Threshold effect of international technology spillovers on China’s regional economic growth. Technol Anal Strateg Manag 32(8):923–935. https://doi.org/10.1080/09537325.2020.1729977
Lv L, Yin Y, Wang Y (2020) The impact of R&D input on technological innovation: evidence from South Asian and Southeast Asian Countries. Dyn Nat Soc https://doi.org/10.1155/2020/6408654
Miao X, Wang S, Han J, Ren Z, Ma T, Xie H (2024) The regional heterogeneity of the impact of agricultural market integration on regional economic development: an analysis of pre-COVID-19 data in China. Sustainability https://doi.org/10.3390/su16051734
Mishra B (2020) Role of external and domestic demand in economic growth: a study of BRICS countries. Global Bus Rev 21(02):547–566. https://doi.org/10.1177/0972150919850408
Naughton B (2003) 8 How much can regional integration do to unify China’s markets? In: N. Hope, D. Yang, M. Li (Ed.) How far across the river? Chinese policy reform at the millennium. pp. 204–232. https://doi.org/10.1515/9780804767095-012
Paris Q, Drogué S, Anania G (2011) Calibrating spatial models of trade. Econ Model 28(6):2509–2516. https://doi.org/10.1016/j.econmod.2011.07.008
Poncet S (2005) A fragmented China: measure and determinants of Chinese domestic market disintegration. Rev Int Econ 13(3):409–430. https://doi.org/10.1111/j.1467-9396.2005.00514.x
Qi Y, Peng W (2019) Effects of China’s regional industrial structure adjustment on carbon emission transfer based on gravity model. Environ Eng Manag J 18(11):2475–2490. https://doi.org/10.30638/eemj.2019.235
Qiu Q, Zhang R (2023) Impact of environmental effect on industrial structure of resource-based cities in western China. Environ Sci Pollut Res Int 30(3):6401–6413. https://doi.org/10.1007/s11356-022-22643-3
Rahman M, Alam K (2021) Exploring the driving factors of economic growth in the world’s largest economies. Heliyon 7(05):e07109. https://doi.org/10.1016/j.heliyon.2021.e07109
Rani R, Kumar N (2019) On the causal dynamics between economic growth, trade openness and gross capital formation: evidence from BRICS countries. Global Bus Rev 20(3):795–812. https://doi.org/10.1177/0972150919837079
Sohail M, Yang M (2022) Environmental concern in the era of digital fiscal inclusion: the evolving role of human capital and ICT in China. Front Psychol 13. https://doi.org/10.3389/fpsyg.2022.990793
Sun L, Qin L, Taghizadeh‐Hesary F, Zhang J, Mohsin M, Chaudhry IS (2020) Analyzing carbon emission transfer network structure among provinces in China: new evidence from social network analysis. Environ Sci Pollut Res 27:23281–23300. https://doi.org/10.1007/s11356-020-08911-0
Sun W, Xue S (2021) Factor flowing, industrial structure change and regional economic divergence. Stud Sci Sci 39(11):1947–1959. https://doi.org/10.16192/j.cnki.1003-2053.20210202.001. (in Chinese)
Tian J, Sim N, Yan W, Li Y (2020) Trade uncertainty, income, and democracy. Econ Model 90(C):21–31. https://doi.org/10.1016/j.econmod.2020.04.022
Trofimenko N (2008) Learning by exporting: does it matter where one learns? Evidence from Colombian manufacturing plants. Econ Dev Cult Change 56(4):871–894. https://doi.org/10.1086/588156
Wang C, Qiao G, Ahmad M, Ahmed Z (2023) The role of the government in green finance, foreign direct investment, technological innovation, and industrial structure upgrading: evidence from China. Sustainability 15(19):14069. https://doi.org/10.3390/su151914069
Wang L (2011) Science & technology input and economic growth: an empirical analysis based on the three major coastal economic regions of China. Energy Procedia 5:1779–1783. https://doi.org/10.1016/j.egypro.2011.03.303
Wang Q, Hu S, Li R (2024a) Could information and communication technology (ICT) reduce carbon emissions? The role of trade openness and financial development. Telecommun Policy 48(3):102699. https://doi.org/10.1016/j.telpol.2023.102699
Wang Q, Zhang F, Li R, Sun J (2024b) Does artificial intelligence promote energy transition and curb carbon emissions? the role of trade openness. J Clean Prod 447:141298. https://doi.org/10.1016/j.jclepro.2024.141298
Wang Q, Zhang F, Li R (2022) Revisiting the environmental Kuznets curve hypothesis in 208 counties: the roles of trade openness, human capital, renewable energy and natural resource rent. Environ Res https://doi.org/10.1016/j.envres.2022.114637
Wang Q, Zhang F, Li R (2023a) Free trade and carbon emissions revisited: the asymmetric impacts of trade diversification and trade openness. Sustain Dev 32(1):876–901. https://doi.org/10.1002/sd.2703
Wang Y, Yang H, Guan G (2023b) Carbon emissions, energy consumption and economic growth: mediating effect model based on Chinese provincial panel data. J Appl Stat Manag https://doi.org/10.13860/j.cnki.sltj.20231128-001
Xing W, Whalley J (2014) The golden tax project, value-added tax statistics, and the analysis of internal trade in China. China Econ Rev 30:448–458. https://doi.org/10.1016/j.chieco.2014.05.005
Xing W, Whalley J, Li S (2015) Value, structure and spatial distribution of interprovincial trade in China. China World Econ 23(4):84–103. https://doi.org/10.1111/cwe.12122
Xing X, Ye A (2022) Consumption upgrading and industrial structural change: a general equilibrium analysis and empirical test with low-carbon green transition constraints. Sustainability 14(20):13645. https://doi.org/10.3390/su142013645
Xu Z, Fan J (2012) China’s regional trade and domestic market integrations. Rev Int Econ 20(5):1052–1069. https://doi.org/10.1111/roie.12013
Yan L, Qin H (2015) Selection and strategy: the dominant industries in Western China under the framework of the Silk Road Economic Belt. In: Destech Publications, INC (Publisher) International conference on Advances in Management Engineering and Information Technology (AMEIT 2015). pp. 176–182. https://doi.org/10.2495/AMEIT140081
Yang J (2017) The implementation of the western development strategy and the research of human resource management. Agro Food Ind Hi Tech 28(1):730–734
Yang J (2023) A study of the economic growth effects of market integration: an examination of 27 cities in the Yangtze River Delta city cluster. PLoS ONE 18(11):e0287970. https://doi.org/10.1371/journal.pone.0287970
Yu Y (2013) The re-estimation and decomposition of China provincial trade flow. Econ Issues China 5:100–108. https://doi.org/10.19365/j.issn1000-4181.2013.05.011. (in Chinese)
Yi Y (2021) The relationship between industrial structure and economic growth in China—an empirical study based on panel data. E3S Web Conf 275(2):01009. https://doi.org/10.1051/e3sconf/202127501009
Yilmazkuday H (2020) Gains from domestic versus international trade: evidence from the US. J Int Trade Econ Dev 29(2):199–210. https://doi.org/10.1080/09638199.2019.1662075
Yotov YV (2022) On the role of domestic trade flows for estimating the gravity model of trade. Contemp Econ Policy 40(3):526–540. https://doi.org/10.1111/coep.12567
Zhang S, Li S (2013) Evolution trend, characteristics and outlook of the inter-provincial trade in China: from 1987 to 2007. Finance Trade Econ 10:100–107. https://doi.org/10.19795/j.cnki.cn11-1166/f.2013.10.011. (in Chinese)
Acknowledgements
This paper was supported by the Shandong Province Quality Graduate Course Project: National Economic Accounting (SDYKC2022010).
Author information
Authors and Affiliations
Contributions
JJ: conceptualization, methodology, funding acquisition, writing-reviewing and editing. QS: methodology, software, formal analysis, data curation and writing-original draft. XY: software, writing-reviewing and editing. All authors contributed to the study's conception and design. Material preparation, data collection and analysis were performed by JJ, QS, and XY. The first draft of the manuscript was written by QS and all authors commented on previous versions of the manuscript. All authors read and approved the final manuscript.
Corresponding author
Ethics declarations
Competing interests
The authors declare no competing interests.
Ethical approval
This article does not contain any studies with human participants performed by any of the authors.
Informed consent
This article does not contain any studies with human participants performed by any of the authors.
Additional information
Publisher’s note Springer Nature remains neutral with regard to jurisdictional claims in published maps and institutional affiliations.
Supplementary information
Rights and permissions
Open Access This article is licensed under a Creative Commons Attribution-NonCommercial-NoDerivatives 4.0 International License, which permits any non-commercial use, sharing, distribution and reproduction in any medium or format, as long as you give appropriate credit to the original author(s) and the source, provide a link to the Creative Commons licence, and indicate if you modified the licensed material. You do not have permission under this licence to share adapted material derived from this article or parts of it. The images or other third party material in this article are included in the article’s Creative Commons licence, unless indicated otherwise in a credit line to the material. If material is not included in the article’s Creative Commons licence and your intended use is not permitted by statutory regulation or exceeds the permitted use, you will need to obtain permission directly from the copyright holder. To view a copy of this licence, visit http://creativecommons.org/licenses/by-nc-nd/4.0/.
About this article

Cite this article
Ji, J., Shan, Q. & Yin, X. How does inter-provincial trade promote economic growth? Empirical evidence from Chinese provinces. Humanit Soc Sci Commun 11, 996 (2024). https://doi.org/10.1057/s41599-024-03411-9
Received:
Accepted:
Published:
Version of record:
DOI: https://doi.org/10.1057/s41599-024-03411-9
This article is cited by
-
Impact of Internet Access on Inter-Provincial Trade in China: A Study of Inter-Provincial Railway Freight
Journal of the Knowledge Economy (2025)
